Transcription
Resilient FairfaxClimate Projections ReportFebruary 2022A Fairfax County, VA publication.To request this information in an alternate format, please call theOffice of Environmental and Energy Coordination at 703-324-7136 TTY 711.
AcknowledgementsPrepared by:WSP USA Inc.: Dr. Rawlings Miller, Jordyn Gross, and Josh AmosReviewed by:Fairfax County Office of Environmental and Energy Coordination (OEEC): Matthew Meyers, Allison Homer,Stephanie Cornejo, and Aline AlthenCadmus: Julia NassarThe Urban Heat Island Effect Data was prepared by:NASA Develop National Program, Langley Research Center: William (Pierce) Holloway, Patricia Murer, CadenO’Connell, Ryan Newell, and Rose Eichelmann, with supervision by Adriana Le Compte and Dr. Kenton RossWe acknowledge the World Climate Research Programme's Working Group on Coupled Modelling, which isresponsible for the Coupled Model Intercomparison Project (CMIP), and we thank the climate modeling groupsfor producing and making available their model output. For CMIP the U.S. Department of Energy's Program forClimate Model Diagnosis and Intercomparison provides coordinating support and led development of softwareinfrastructure in partnership with the Global Organization for Earth System Science Portals.Prepared for the Fairfax County Office of Environmental and Energy Coordination (OEEC)Disclaimer: These projections provide an indication of future conditions based on the state of the science andcurrent best practices in projection analyses. It is not known with certainty how the future society may evolve,and conditions may change.2
Table of ContentsExecutive Summary . 41. Introduction. 62. Glossary . 83. Methodology . 103.1 Planning Horizons . 103.2 Future Scenarios . 113.3 Climate Model Data . 133.4 Geographic Scale . 143.5 Observation Data . 143.6 Uncertainty and Confidence. 153.7 Climate Indicators . 164. Climate and Weather Hazards . 175. Temperature . 215.1 Annual Trends . 215.2 Seasonal and Monthly Trends . 225.3 Extreme Heat & Humidity . 245.4 Extreme Cold . 315.5 Heating and Cooling Degree Days. 316. Precipitation . 326.1 Annual Trends . 326.2 Seasonal and Monthly Trends . 346.3 Heavy Precipitation & Inland Flooding . 367. Drought . 408. Coastal Flooding. 449. Storm and Wind Events . 539.1 Tropical Cyclones . 539.2 Severe Thunderstorms . 549.3 Winter Storms . 5510. Conclusions . 55Chronic and Acute Indicators . 57Precipitation Events . 63I.Endnotes . 843
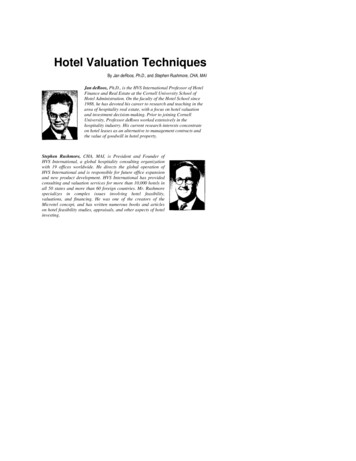
Executive SummaryThis Climate Projections Report provides an analysis of projected future climate conditions in Fairfax County,Virginia. It answers the following question: “what climate conditions and hazards are we likely to face inFairfax County by 2050 and by 2085?” The climate projections report is one component of the larger ResilientFairfax Climate Adaptation and Resilience Plan.Two emissions scenarios were used for these projections: the Representative Concentration Pathway (RCP) 4.5“lower emissions scenario,” and the RCP 8.5 “higher emissions scenario.” Climate data was obtained throughmultiple avenues including: the Localized Constructed Analogues (LOCA) technique (which includes 32 climatemodels), observation station data (from stations at the Washington Reagan National Airport, WashingtonDulles International Airport, and Vienna, Virginia), METDATA (which draws on the NASA North American LandData Assimilation System (NL-DAS2)), NASA DEVELOP satellite data, and reviews of existing data from FairfaxCounty, the Metropolitan Washington Council of Governments (MWCOG), the Northern Virginia RegionalCommission (NVRC), the National Oceanic and Atmospheric Administration (NOAA), the United States ArmyCorps of Engineers (USACE), the Chesapeake Bay Program, the Interstate Commission on the Potomac RiverBasin (ICPRB) and other sources.This analysis included the following climate hazards: extreme heat, extreme cold, heavy precipitation/inlandflooding, coastal flooding, severe storm and wind events, and drought. The results of the study showed thatsome of these hazards are projected to become more severe for the county, as summarized in the graphicbelow. The more severe projections for the county are extreme heat and heavy precipitation and inlandflooding. While storm activity is projected to intensify as the planet warms, which would place it under the“most severe” category, there is less confidence compared to heat and precipitation, which is why it is placedunder “moderate.” Drought projections for the county are comparatively minor as precipitation is projectedto increase, but intermittent drought may occur. Extreme cold is projected to decrease as temperatures warm.Most severe:Extreme heat, heavy precipitation and inland floodingMinor:DroughtModerate:Severe storm and wind events, coastal floodingOpportunities (Reduced):Extreme coldThis report focuses only on the data of projected climate conditions. It does not discuss the impacts orvulnerabilities associated with those projected conditions. The impacts are discussed in a subsequentvulnerability and risk assessment (VRA) report. The climate projections detailed in this report lay thegroundwork for the subsequent deliverables of Resilient Fairfax, including the climate VRA, the audit of4
existing policies, plans, and programs, the adaptation and resiliency strategies, and the implementationroadmap.5
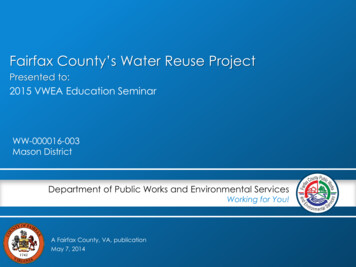
1. IntroductionOver the past century, Fairfax County has experienced increased temperature, precipitation, storm severity,and rising water levels along its shorelines. Climate change is anticipated to continue to increase the numberand intensity of these events. Resilient Fairfax is an initiative to help our county prepare for and become moreresilient to these hazards. This report is one component of the Resilient Fairfax climate adaptation andresilience plan. The purpose of this report is to identify future climate conditions and hazards in Fairfax County.A subsequent report, the vulnerability and risk assessment, will describe the impacts of those projectedconditions. The following diagram shows how this report relates to the other deliverables of Resilient Fairfax.This report is shown in green.Resilient Fairfax Climate Adaptation and Resilience PlanClimate Projections Report: How has the climate changed? What will the future climate look like? Will there be change in temperature?Will there be change in storm severity?Will there be change in precipitation and intensity of rain events?Will there be coastal flooding?Will there be drought?Climate Vulnerability and Risk Assessment: Where are we vulnerable? What are the top risks? Which of our infrastructure, populations, and systems are exposed to climate hazards?Which are sensitive to these climate hazards?Which lack the adaptive capacity to handle changing conditions?What are our top vulnerabilities?Which are most likely? Which have the most severe consequences?Audit of Existing Plans, Policies, and Programs: Do our policies, plans, and programs include resilience? How do our policies, plans, and programs compare to best practices?Which programs are working well and should be potentially expanded?Where are the gaps or opportunities to update policies and programs?Strategies for Climate Adaptation & Resilience: What should we do to enhance the county's resilience? What strategies would help the county address our climate vulnerabilities and risks?Which of these strategies are top priority?Implementation Roadmap: What is the plan to implement the priority strategies? What actions would be taken to implement the strategies?Who would be responsible for implementation?What is the timeframe for implementation?6
“Climate” is often confused with “weather.” Climate refers to long-termstatistical averages of 20 years or more, while weather refers to day-today conditions. Climate models provide projections of how the futureclimate may change.“Climate” vs. “Weather”Climate means long-termstatistical averages of 20 yearsor more.This Climate Projections Report presents future conditions under twogreenhouse (GHG) scenarios: (1) a moderate warming future scenario,Representative Concentration Pathway (RCP) 4.5, where global GHGWeather means day-to-dayemissions peak around 2040 and then, through climate policies,conditions.stabilize at around 540 parts per million (ppm) by 2100 (referred to“lower emissions” in this report), and (2) a high future warming scenario,RCP8.5, where there is little curbing of emissions and concentrations continue to increase rapidly reachingabout 940 ppm by 2100 (referred to as “higher emissions” in this report).i For reference, the global averageatmospheric carbon dioxide level in 2020 was over 410 ppm.The two emissions scenarios (RCP4.5 and RCP8.5) are used to help address uncertainty associated with howsociety may evolve over the coming century. Over the course of this century, there are significant differencesin the possible rates of accelerated change, largely dependent on future greenhouse gas emissions. This meansthat today’s decisions and actions concerning GHG mitigation may have profound consequences on the longterm outcome of Fairfax County’s future climate. If global society successfully reduces our greenhouse gasemissions, future climate scenarios may be milder. If global society does not take action to reduce ouremissions, future climate scenarios may be more extreme.Regardless of which future scenario best aligns with our trajectory, Fairfax County’s governance of assets,systems, and population is likely to be strained if the county is not adequately prepared for these plausiblefutures. Based on discussions with local stakeholders and a review of local resources, the following climaterelated hazards were selected for analysis in Fairfax County: Extreme Heat Heavy Precipitation and Inland Flooding Severe Storm and Wind Events Coastal Flooding Drought Extreme ColdWhile some of these hazards may overlap during an event, such as heavy precipitation and storm and windevents, they are analyzed distinctly in this study because the hazards do not always occur simultaneously. Forexample, strong wind leading to power outages would not be factored in under “heavy precipitation,” andflooding from “heavy precipitation” that is not the result of a storm would not be factored in under “stormevents.”To determine how these hazards may change over the coming century, climate indicators were identified toconsistently quantify and analyze these hazards (see Appendix A). An analysis of climate projections was thenconducted for the climate indicators. This analysis compared the results of daily maximum temperature, dailyminimum temperature, and daily precipitation projections from 32 downscaled climate models. The analysis7
was conducted for two 30-year future time periods: 2035-2064 (termed “2050” for the mid-point or “midcentury”) and 2070-2099 (termed “2085” or “end of century”), for comparison to a “baseline period” of 19762005 and a “current period” of 1991-2020. These indicators were supplemented with desktop reviews ofapplicable climate data and regional literature.This Climate Projections Report presents the findings of the climate projections analysis and desktop reviewfor Fairfax County, Virginia specifically. This analysis focuses only on climate projection data; it does not discussthe impacts or vulnerabilities and risks associated with those projections.2. GlossaryiiTo ensure consistency in terminology, the following definitions were adopted for this analysis. Acute Hazard: An event-driven hazard that may damage or impact an area, people, asset, and/orsystem. Blizzards, heat events, and heavy rainfall events are all examples of acute hazards. Baseline Conditions (also referred to as Baseline Period): The Baseline Conditions are used forcomparison with current and future climate conditions. The 30-year baseline period for this study isfrom 1976 to 2005, with a centered year of 1991. This period was selected as the reference period forconsistency with other local, regional, national, and international analyses. Climate simulations beginto divert from each other when emissions scenarios are introduced into climate model analysis in 2006(see Section III.I)). Chronic Hazard: A long-term change that can impact an area, people, asset, and/or system. Risingtemperatures, rising sea level, and changes in seasonal precipitation are all examples of chronichazards. Concentrations: Measure of a chemical species such as a greenhouse gas in the Earth’s atmosphere.For long-lived gases, concentrations can accumulate over time as emissions continue. Cooling Degree Days (CDD): The hotter the temperature, the more “cooling” through air conditioningis required. CDD is a measure of temperature and energy needed for space cooling. Despite the name,the metric does not refer to number of days. It is calculated for days above 65 F by subtracting 65 Ffrom the outdoor temperature. The higher the cooling degree days, the more energy is needed. Forexample, a day with an average temperature of 80 F has a CDD of 15, because 80 F - 65 F 15. Climate: A statistical average of weather conditions over a 20-year or 30-year period. Climate Change: Changes in average weather conditions that persist over multiple decades or longer. Climate Models: Computer code that simulates the climate system using advanced mathematicalequations and powerful supercomputers, based on well-documented physical processes. Climate Projections: Simulated response of the climate system to a scenario of future emissionsderived from climate models. Climate Indicator: Quantifiable variable that can be used to represent changes in the hazard. Forexample, the climate indicator “number of days above 95 F” can be used to represent change for theclimate hazard “extreme heat.”8
Current Climate: The “current climate” is a time period used for comparison with future climateconditions. For this study, the “current climate” period is based on observations from 1991 to 2020,with a centered year of 2006. Downscaled Projections: Projections from climate models that have been post-processed to betterrepresent local- and regional-scale conditions. Drought: Based on the meteorological drought, “drought” is the degree of dryness or rainfall deficitand the length of the dry period. Hydrologic drought is based on the impact of rainfall deficits on thewater supply such as stream flow, reservoirs and lake levels, and ground water table. Emissions: Gases and particles released into the Earth’s atmosphere. End-of-century: For the purposes of this study, “end-of-century” is defined as 2085, based on anaverage across 2070-2099. Exposure: The presence of people, assets, and systems in places where they could be adverselyaffected by hazards. Freeze-thaw Day: Defined as a day when maximum temperature is at/above 32 F and minimumtemperature drops below 30.2 F. Greenhouse Gas (GHG): Gases that absorb heat in the atmosphere near the Earth's surface,preventing the heat from escaping into space. If the atmospheric concentrations of these gases rise,the average temperature of the lower atmosphere will gradually increase. This is a phenomenonknown as the greenhouse effect. Greenhouse gases include, for example, carbon dioxide, water vapor,and methane. Hazard: An event or condition that may cause injury, illness, harm, or death to people, unsafeconditions, damage to assets and systems, and/or impact on services. Heating Degree Days (HDD): When temperatures are colder, more heat is needed in buildings. HDD isa measure of temperature and energy needed for space warming. Despite the name, HDD does notrefer to number of days. HDD is calculated for cold days below 65 F by subtracting the outdoortemperature from 65 F. The higher the HDD, the more energy use is needed for heating. For example,a day with an average temperature of 30 F would have an HDD of 35, because 65 F - 30 F 35. Mid-century: For the purposes of this study, “mid-century” is defined as 2050, based on an averageacross 2035-2064. Representative Concentration Pathways (RCPs): Scenarios that include time series of emissions andconcentrations of the full suite of greenhouse gases, aerosols, and other chemically active gases, aswell as land use/land cover. The word "representative" signifies that each RCP provides only one ofmany possible scenarios that would lead to the specific radiative forcing characteristics. The term"pathway" emphasizes that not only the long-term concentration levels are of interest, but also thetrajectory taken over time to reach that outcome. Emissions scenarios are labeled as “RCP” followedby a number, such as RCP 2.5, RCP 4.5, RCP 6.0, and RCP 8.5. The numbers refer to the warming (inwatts) per square meter across the planet by the end of century. For example, “RCP 8.5” means the9
emissions scenario where the concentration of carbon results in warming at an average of 8.5 wattsper square meter over the planet in 2100. Sea Level Rise: Average long-term rise of sea level. When measured at a site-specific tide gage, it maybe referred to as “relative” sea level rise. Storm Surge: The sea height during storms such as hurricanes and tropical storms that is above thenormal level expected at that time and place based on the tides alone. Tropical Cyclones: Low pressure system (not associated with a front) that develops over tropical andsometimes sub-tropical waters and has organized deep convection with a closed wind circulationabout a well-defined center. Tropical depression, tropical storms, and hurricanes are all examples oftropical cyclones. Urban Heat Island Effect (UHI): The tendency for higher air temperatures to persist in urban areas as aresult of heat absorbed and emitted by buildings and asphalt, tending to make urbanized areaswarmer than the areas with ample green space.3. MethodologyThis section describes the approach in estimating current and future conditions for Fairfax County. The climatedescriptions of historic and projected change provided in this document are based on: (1) in-house processingof publicly available observed and climate model simulation data, (2) review of scientific literature providedthrough peer reviewed journal articles and government reports; and (3) review of vetted grey matter such as aNational Oceanic and Atmospheric Administration (NOAA) website and publicly available governmental tools.Two types of climate conditions were considered: (1) chronic hazards that demonstrate historic and futuretrends in long-term baseline conditions, such as rising sea levels and rising annual temperatures, and (2) acutehazards, or events that may increase or decrease over time, such as very heavy rainfall events or severestorms. There is greater confidence in projecting future conditions in chronic changes than acute events.3.1 Planning HorizonsClimate projections are generally provided as statistically averaged data over a 20-year or 30-year period.Time periods shorter than 20-years are not considered representative of climate change. For the FairfaxCounty study, 30-year planning horizons were chosen for a more robust analysis of the heavy precipitation andextreme heat events. A time period longer than 30 years was not adopted because the climate is changingover the coming century, and the longer the time period selected, the less likely the future signal of changewould be effectively captured for planning purposes. The exception to this stance is for the projected changein precipitation events for 2-year through 500-year return periods, which are based on 40-year time periods.The longer time frame was chosen specifically for this precipitation component because estimates of futurereturn periods are based on the annual maximum data (that is, the heaviest 24-hr precipitation event of eachyear). The more years used in the precipitation analysis, the more robust the result.Climate models study the statistical change in future conditions compared to baseline conditions. Therefore,both baseline and future time periods are identified for the analysis. For Fairfax County, the 1976-2005 timeperiod, centered in 1991, was used to represent baseline conditions. This baseline time period ensures a10
“clean” comparison across each emissions scenario where the results are representative of simulatedprojected change. This baseline period was chosen in part because the climate projections used in this analysisbegin to consider potential changes described by the emissions scenarios in 2006 (see next section for moredetail). This period was also selected for consistency with other local, regional, national, and internationalanalyses.However, because this report was written in 2021, using this baseline also creates a 16-year gap between thebaseline end year (2005) and today. To address this gap, this analysis includes not only a “baseline” period(1976 – 2005), but also a current period of 1991 – 2020, centered in 2006.For future conditions, this climate projections report primarily focuses on the mid-century timeframe, whichmeans the time period from 2035-2064, centered at the year 2050. This mid-century horizon was chosen forseveral reasons. First, it enables staff to plan for current and near-term vulnerabilities. Second, the 2050timeframe aligns with other county and regional climate planning-related efforts. Third, projections after 2050have a greater degree of uncertainty.However, to complement this detailed analysis of mid-century projections with additional context of futurechange, this report also includes less detailed end-of-century results for the time period 2070-2099, centeredat the year 2085.Table 1 provides a reference for the time horizons used (unless otherwise noted in the text in the followingsections).Table 1. Time period and planning horizons adopted for the Fairfax County study.Time Period /Planning HorizonReference IDTime periodCentered YearBaseline period“Baseline”1976-20051991Current period“Current Climate”1991-20202006Mid-century n“2085”2070-209920853.2 Future ScenariosTo investigate future changes in climate, climate models are used to simulate a range of climate futures thatrepresent, in part, how global society may evolve over the coming century. These conditions can be connectedto society’s choices and behavior in fossil fuel use, land use, population growth, technology advances, policiesto mitigate greenhouse gas emissions, and other factors. Based on a monumental undertaking supported bythe Intergovernmental Panel on Climate Change (IPCC), a suite of emissions scenarios was developed toprovide a range of plausible climate futures that could be used to “drive” climate models, which in turnestimate projected changes based on each emissions scenario (see Table 2). iii Climate projections based onclimate models driven by these emissions scenarios were adopted by and presented in the 2014 IPCC Fifth11
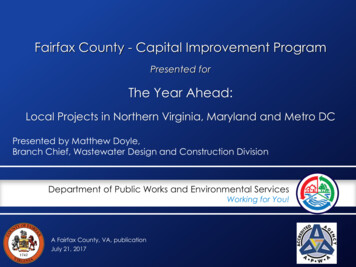
Assessment Report and the 2018 National Climate Assessment (NCA4) (see Figure 1). Emissions scenarios arelabeled as “RCPs,” which stands for “Representative Concentration Pathway.”Table 2. Emissions scenarios developed by the IPCC.Emissions ScenarioRCP 2.5RCP 4.5RCP 6.0RCP 8.5DescriptionEmissions peak in the early part of this century and then decline substantially. Thisis not considered a plausible scenario because this aggressive reduction inemissions would need to have occurred already.There is a continued increase in emissions until 2040 and then a decline, withstabilization achieved by end of century.There is a continued increase in emissions until 2080 and then a decline (thisscenario is not shown in Figure 1 as the NCA4 did not include this scenario).Significant increases in emissions continue through the end of century. Thisscenario aligns with our current trajectory.Figure 1. Observed and projected change in carbon emissions and temperature. (The thick lines represent the average of multipleclimate models; the shaded regions represent the 5% to 95% confidence intervals for each projection; the global average temperaturechange is relative to 1986-2015; source: NCA4 2018iv.)The Fairfax County Climate Projections Report study adopted the higher emissions scenario (RCP8.5) and thelower emissions scenario (RCP4.5), which is generally consistent with climate assessments in the United States.Though some studies simply focus on the RCP8.5, this analysis included two emissions scenarios (RCP4.5 andRCP8.5) to quantify some of the uncertainty associated with how future society may evolve over the comingcentury (see “Uncertainty and Confidence” section below). There is more warming projected for RCP8.5 thanRCP4.5. However, in some locations, future precipitation may be projected to be greater for the RCP4.5 thanRCP8.5. This is because precipitation is based on complex atmospheric conditions and changes in otheremissions such as particles that serve as cloud condensation nuclei. Hence, when possible, it is preferred toconsider both scenarios.12
3.3 Climate Model DataClimate models simulate past and future climate using computer code. The computer code is based onmathematical representations of the important processes within the climate system. This includes the use ofatmospheric principles for large-scale atmospheric phenomena (such as the upper-level winds) andparameterizations based on empirical data of small-scale phenomena (such as cloud development). Climatemodels are developed and run at institutions around the world, where each climate model may use a distinctselection of algorithms to simulate these large-scale to small-scale processes.This Fairfax County Climate Projections study collected publicly available statistically downscaled climatemodel data developed by the Scripps Institute of Oceanography at the University of California, San Diego andsupported by the United States federal government.v Global climate models are available in a range ofgeographic resolutions. “Statistical downscaling” applies relationships to transform these large-scalep
latitude frontal storm events. Over the past 40 to 50 years, extreme weather events have become more frequent. xliv From 1996 to 2021, there have been a total of 115 FEMA Major Disaster Declarations including blizzards and winter storms (6), tropical cyclones (5), and severe storm