Transcription
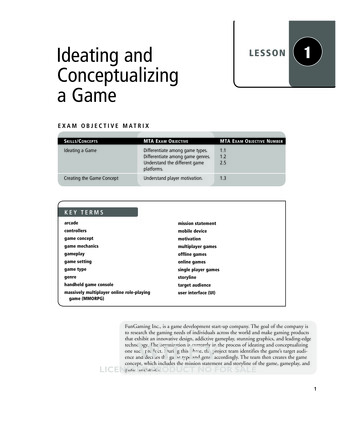
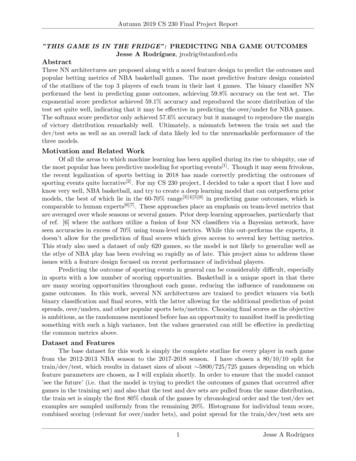
Autumn 2019 CS 230 Final Project Report”THIS GAME IS IN THE FRIDGE”: PREDICTING NBA GAME OUTCOMES.Jesse A Rodrı́guez, jrodrig@stanford.eduAbstractThree NN architectures are proposed along with a novel feature design to predict the outcomes andpopular betting metrics of NBA basketball games. The most predictive feature design consistedof the statlines of the top 3 players of each team in their last 4 games. The binary classifier NNperformed the best in predicting game outcomes, achieving 59.8% accuracy on the test set. Theexponential score predictor achieved 59.1% accuracy and reproduced the score distribution of thetest set quite well, indicating that it may be effective in predicting the over/under for NBA games.The softmax score predictor only achieved 57.6% accuracy but it managed to reproduce the marginof victory distribution remarkably well. Ultimately, a mismatch between the train set and thedev/test sets as well as an overall lack of data likely led to the unremarkable performance of thethree models.Motivation and Related Work.Of all the areas to which machine learning has been applied during its rise to ubiquity, one ofthe most popular has been predictive modeling for sporting events[1] . Though it may seem frivolous,the recent legalization of sports betting in 2018 has made correctly predicting the outcomes ofsporting events quite lucrative[2] . For my CS 230 project, I decided to take a sport that I love andknow very well, NBA basketball, and try to create a deep learning model that can outperform priormodels, the best of which lie in the 60-70% range[3][4][5][6] in predicting game outcomes, which iscomparable to human experts[6][7] . These approaches place an emphasis on team-level metrics thatare averaged over whole seasons or several games. Prior deep learning approaches, particularly thatof ref. [6] where the authors utilize a fusion of four NN classifiers via a Bayesian network, haveseen accuracies in excess of 70% using team-level metrics. While this out-performs the experts, itdoesn’t allow for the prediction of final scores which gives access to several key betting metrics.This study also used a dataset of only 620 games, so the model is not likely to generalize well asthe stlye of NBA play has been evolving so rapidly as of late. This project aims to address theseissues with a feature design focused on recent performance of individual players.Predicting the outcome of sporting events in general can be considerably difficult, especiallyin sports with a low number of scoring opportunities. Basketball is a unique sport in that thereare many scoring opportunities throughout each game, reducing the influence of randomness ongame outcomes. In this work, several NN architectures are trained to predict winners via bothbinary classification and final scores, with the latter allowing for the additional prediction of pointspreads, over/unders, and other popular sports bets/metrics. Choosing final scores as the objectiveis ambitious, as the randomness mentioned before has an opportunity to manifest itself in predictingsomething with such a high variance, but the values generated can still be effective in predictingthe common metrics above.Dataset and Features.The base dataset for this work is simply the complete statline for every player in each gamefrom the 2012-2013 NBA season to the 2017-2018 season. I have chosen a 80/10/10 split fortrain/dev/test, which results in dataset sizes of about 5800/725/725 games depending on whichfeature parameters are chosen, as I will explain shortly. In order to ensure that the model cannot’see the future’ (i.e. that the model is trying to predict the outcomes of games that occurred aftergames in the training set) and also that the test and dev sets are pulled from the same distribution,the train set is simply the first 80% chunk of the games by chronological order and the test/dev setexamples are sampled uniformly from the remaining 20%. Histograms for individual team score,combined scoring (relevant for over/under bets), and point spread for the train/dev/test sets are1Jesse A Rodrı́guez
Autumn 2019 CS 230 Final Project Reportincluded below in Figure 1. We can see already that the train set has a slightly different distributionthan the test/dev sets, most evident in the per game scoring where the mean of the distributionis shifted upward 10 points in the dev/test sets. This is likely due to the recent change in paceand style of play in the NBA à la the Golden State Warriors post-2016 where teams take and makemuch more 3 pointers than before and thus have much higher scoring games. The distributions ofthe point spreads (margin of victory) seem to be fairly consistent, however. We will discuss thepotential impact of these factors later.Figure 1: Histograms for individual team scores (left), combined scores (middle) and point spreads(right) from the NBA game corpus used in this project.The main aspect of my approach that differs from previous attempts at final score prediction or even just game outcomes in the past is feature engineering. Up until now, all of the priorattempts at predicting NBA game outcomes that I found used team-level metrics (total points,rebounds, assists, etc.) averaged over entire seasons[8][9][10][11] . While this does lead to predictionaccuracies of game outcomes on par with the experts, I felt that this data is just too simplistic toaccurately predict the outcomes of games, and particularly their scores. For example, what if oneplayer will not be playing due to injury, or is just returning from one? What if one player is havingan incredible hot streak (many NBA fans will remember ’Linsanity’, for example)? What if theteam itself is in a slump? These are the edge cases that I aimed to capture with my feature design.My feature/label set up is as follows: Each feature vector contains the statlines of the topnp players (ranked by scoring) that are on the roster for the game in question for each team intheir personal previous ng games. This means that if a player is just returning from an injury,we pull from the last ng games they played before being injured. For example, when you considerthe performance in the previous 5 games of the top 8 players and omit no stats (17 total), youhave feature vectors of length 1360. The player statlines for each team are stacked home teamfirst, so as to encode the home-court advantage, and then standardized by subtracting the meanand dividing by the standard deviation. The labels are simply the final scores of each team withthe order corresponding to the order in which the statlines are stacked. If a binary classifier isbeing trained, the labels are converted to 1’s and 0’s where 1 corresponds to home team win. Anexample of an un-normalized/standardized feature vector for ng 1 and np 2 is found below,where THP is top home player, 2HP is second-ranked home player, and TAP is top away player,and the stats you see are the statlines for the players in question from the last game that they played:[ {z}111 , {z}102 ] [ {z}29 , {z}8, {z}5, . {z}17 , {z}3 , . {z}26 , {z}4, .]THP PTS THP REB THP AST2HP PTS 2HP REBTAP PTS TAP REBhome score away score{z} {z} feature vectorlabel.The code to produce these datasets from player box scores stored in csv files can be found athttp://github.com/JesseRodriguez/CS230 229 FinalProject. The Box Score data must be in the2Jesse A Rodrı́guez
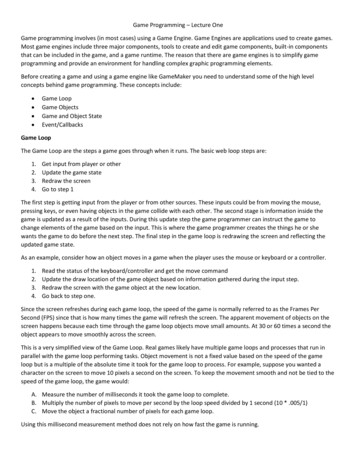
Autumn 2019 CS 230 Final Project Reportsame format as the Kaggle dataset found at he Refridgerator class (found in RNBA.py in the repo), as I’ve called it (this is a reference tothe late, great NBA commentator Chick Hearn), takes these box scores and produces a dataset fordifferent values of ng and np specified by the user. Below, we sweep these values to search for anoptimal combination to maximize predictive power of the model.Methods.In this work, three distinct Neural Network architectures are explored. The first and mostsimple architecture is a simple binary classifier fully-connected network with 3 hidden layers and asigmoid output layer that utilizes the binary cross entropy loss. The second architecture is designedto predict final scores and is forked; containing 6 fully connected layers with a fork after layer 3 andan output layer with an exponential activation for each fork. This model utilizes the summed meansquared error loss of each of the forked outputs. The final architecture contains 9 fully connectedlayers with a fork after layer 6. The output layer is a softmax classifier where the classes are thepossible final scores of each team. In our dataset, the highest score observed is 149 and the lowestis 58, leading to two output layers of size 92 (one for each fork). This model uses the categoricalcross entropy loss. A diagram of each model along with the number of nodes in each layer andexpressions for their output layer activations and losses is included below.BinaryClassifierExponentialScore PredictorSigmoid Output ActivationExponential Output Activationa [L] a [L] e Z11 e ZBinary Cross Entropy LossJ 1 m(i)(i)(i)(i)(y logŷ (1 y )log(1 ŷ ))m i 1Number of Nodes[nx; 2; 5; 5; 1]MSE LossJ 1 m̂ y (i) 22 y(i)m i 1Number of NodesSoftmaxScore PredictorSoftmax Output Activatione Zkak[L] i e ZiCategorical Cross Entropy LossJ 1 m (i)̂y logy(i)m i 1Number of Nodes[nx; 6; 5; 5; fork; 5; 5; 1][nx; 200; 100; 50; 20; 10; 5; fork; 5; 5; 92]Figure 2: NN architectures for the three model types explored in this work.Each model uses ReLU activations in the hidden layers. The weight kernels are initialized viaXavier Initialization and the biases are initialized at 0. The models are optimized via the Adamalgorithm[12] with a minibatch size of 128, a learning rate of 0.001, with β1 0.9 and β2 0.999.Regularization methods experimented with include L2 and L1. Due to the small size of the dataset,HPC resources were not required and the models were trained on a personal laptop with Keras[13] .Results and DiscussionDesign Considerations/Hyperparameters.The first observation we need to make here is how large our dataset is in relation to the sizeof our feature vectors. For example, if ng np 10 (yielding feature vectors of length 1700) andthe first hidden layer of the neural network is just 4 units, we already have more parameters thantraining examples, so the model will almost certainly overfit if there is just one output. Thus, the3Jesse A Rodrı́guez
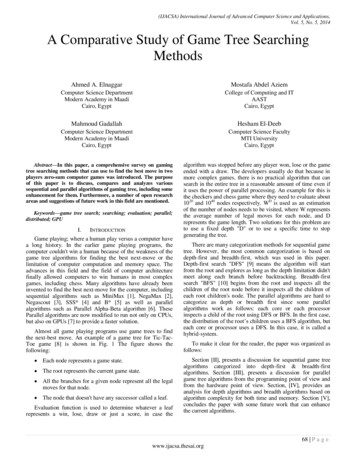
Autumn 2019 CS 230 Final Project Reportnumber of nodes in each layer of each model was chosen according to the train set accuracy. Oncethe game outcome prediction accuracy for the train set corresponding to ng np 10 approached90%, I ceased modifying the NN architecture. Ideally, the architecture would be optimized foreach ng /np pair, but that type of investigation proved to be beyond the time constraints of thisproject. The learning rate, Adam parameters, and number of training epochs were similarly setvia an optometrist-like algorithm. Since the novelty in this project lies in the feature design, thehyperparameter tuning effort was invested in the hyperparameters associated with the features,leaving further tuning of other hyperparameters to future work.Feature Development.To see which feature design would lead to a model with the greatest predictive power, I sweptover all combinations of ng and np in the range of 1 to 10 and trained each model architecturearrived at above. The results of this sweep are found below in Figure 3 where the models areevaluated according to whether or not they predicted the outcomes of the games correctly.Softmax Score PredictorBinary ClassifierDev Set AccuracyTrain Set AccuracyExponential Score PredictorFigure 3: Dev set performance of the 3 NN models for each ng , np pair.We can see immediately that of the two score predictor models, the exponential score predictoris far superior, where the softmax score predictor for most combinations of np and ng performs a bitbetter than a coin flip, occasinally approaching 60% accuracy on the dev set. The binary classifiermodel consistently performs in excess of 60% on the dev set, reaching the realm of human expertsin performance. It is clear through evaluation of these values, however, that all three architectureshave bias and variance problems, and tend to overfit to the training set for large values of ng andnp . Adding L2 or L1 regularization to all or a subset of the model layers does not seem to addressthe variance problem. I also tried modifying the complexity of the models manually to try anddecrease variance in the lower right regions of these heatmaps, but ultimately the performance forother combos of ng and np would suffer and the accuracy values reached would not be as high aswe observe here. It is possible that adding dropout could improve model performance. Ultimately,however, it may just be a fundamental mistmatch of the train set to the dev set that causes theproblems we see here. As was mentioned before, unfortunately the NBA saw quite the revolutionin style of play right about at the time of the train/dev split, so any model trained on this corpusis somewhat destined to be biased.4Jesse A Rodrı́guez
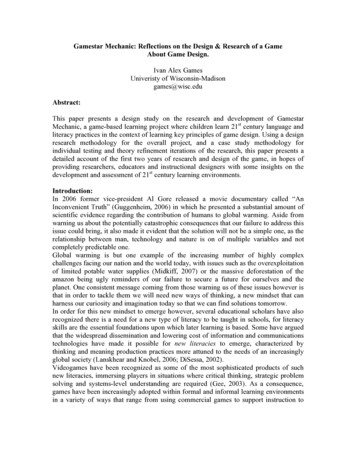
Autumn 2019 CS 230 Final Project ReportTest Set Performance.Based on the results above, for the exponential score predictor, I tested the ng 4, np 3dataset; for the softmax score predictor, I tested the ng 4, np 2 dataset; and for the binaryclassifier, I chose the ng 4, np 3 dataset. Accuracies on the test set are found below:Modelng ,np pairTrain Set AccuracyDev Set AccuracyTest Set 59%75%60%59%62%59.1%57.6%59.8%Thus we have some slight overfitting to the dev set, but overall we have comparable performanceon the test set. In addition, we take a look at the distributions of the scores predicted by theexponential and softmax models as compared to the true test set labels.Figure 4: Histograms for individual team scores (left), combined scores (middle) and point spreads(right) from the true test set values and the predictions from each model.Interestingly, the predicted score distributions produced by the exponential model look muchbetter than the sigmoid (despite some evidence of overfitting to the train set as the mean is shifteddown about 10 points as we see above), but the point spread distribution produced by the sigmoidis much more representative. This suggests that the sigmoid architecture may be more conducive topredicting point spreads while the exponential model is more suited to predicting game outcomesand over/unders, though a more rigorous investigation of these metrics is needed to say for sure.Conclusion and Future Work.The most predictive feature design consisted of the statlines of the top 3 players of each teamin their last 4 games. The binary classifier NN performed the best in predicting game outcomes,nearly achieving a performance on the test set on par with human experts. The exponential scorepredictor reproduced the score distribution of the test set quite well, indicating that it may beeffective in predicting the over/under for NBA games. The softmax score predictor performed relatively poorly on the previous two tasks but managed to reproduce the margin of victory distributionremarkably well. Ultimately, a mismatch between the train set and the dev/test sets as well as anoverall lack of data likely led to the unremarkable performance of the three models.In the future, a number of immediate next steps along with a couple long-term steps areapparent. First, tuning of the hyperparameters associated with the optimization algorithm wouldlikely lead to stronger results. Second, omission of some stats (like 2 pointers made and attempted,for example) along with the inclusion of other stats that might be quite predictive and weren’tpresent in this dataset (such as /- or unique player IDs), would likely improve performance byshrinking the size of the feature vectors and making the information present more potent. Ultimately, however, the main issue that needs to be addressed is the lack of training data and themismatch between the train and dev/test sets. To tackle both of these problems, it may be effective to artificially generate data via the new (and quite sophisticated) NBA basketball video games.These games simulate entire seasons of the NBA remarkably well, and using them to generate animmense dataset to train on may lead to very high prediction accuracy. Overall though, I believethe work presented here is a good first step toward considering a new dataset paradigm in NBAbasketball prediction, and it is primed to be built upon.5Jesse A Rodrı́guez
Autumn 2019 CS 230 Final Project ReportReferences[1] : Bunker, R. et al., A Machine Learning Framework for Sport Result Prediction. Applied Computing and Informatics Vol. 15, Issue 1, Pg. 27-33. (2019)[2] : Ryan, S. et al., Application of Bayesian Network to total points in NBA Games. Industrial and ManufacturingSystems Engineering Conference Proceedings and Posters. 179. (2019)[3] : Lin, J. et al., Predicting National Basketball Association Winners. CS 229 Final Project. (2014)[4] : Torres, R., Prediction of NBA games based on Machine Learning Methods. University of Wisconsin-Madison.(2013)[5] : Jain, S. et al., Machine Learning Approaches to Predict Basketball Game Outcome. 3rd International Conferenceon Advances in Computing, Communication & Automation. IEEE. (2017)[6] : Loeffelholz, B. et al., Predicting NBA Games using Neural Networks. Journal of Quantitative Analysis in Sports.Vol. 5 Iss. 1, Article 7. (2009)[7] : AccuScore, The Leader in Sports Forecasting, https://accuscore.com/basketball/nba-picks[8] : Uudmae, J., CS 229 Final Project: Predicting NBA Game Outcomes. CS 229 Final Project. (2017)[9] : Avalon, G. et al., Various Machine Learning Approaches to Predicting NBA Score Margins. CS 229 FinalProject. (2016)[10] : Thabtah, F. et al., NBA Game Result Prediction Using Feature Analysis and Machine Learning. Annals ofData Science 6(1):103–116. (2019)[11] : Bucquet, A., Sarukkai, V., The Bank Is Open: AI in Sports Gambling. CS 229 Final Project. (2018)[12] : D. P. Kingma, J. Lei Ba. Adam : A method for stochastic optimization. arXiv:1412.6980v9 (2014)[13] : tensorflow.org, Keras (accessed 2019)6Jesse A Rodrı́guez
popular betting metrics of NBA basketball games. The most predictive feature design consisted of the statlines of the top 3 players of each team in their last 4 games. The binary classi er NN performed the best in predicting gam