Transcription
1MBP1133 Managerial AccountingPrepared by Dr Khairul AnuarL7 – Variable Costing and SegmentReporting: Tools for Managementwww.notes638.wordpress.com
2Learning Objective 1Explain how variable costing differs fromabsorption costing and compute unit productcosts under each method.
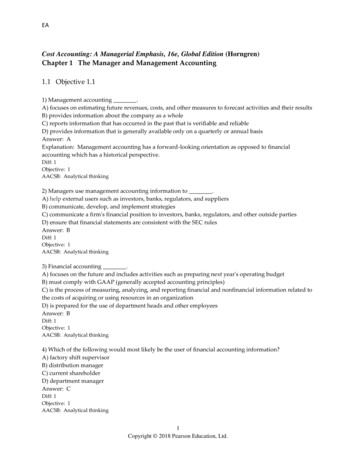
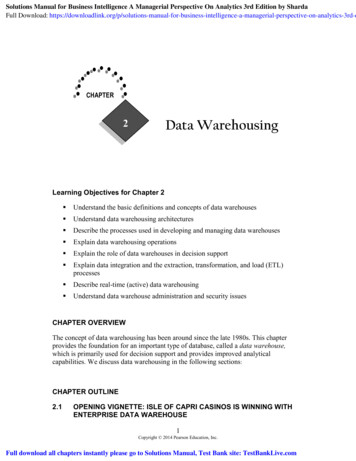
3Overview of Variable and Absorption CostingVariableCostingAbsorptionCostingDirect MaterialsProductCostsDirect LaborVariable Manufacturing OverheadProductCostsFixed Manufacturing OverheadPeriodCostsVariable Selling and Administrative ExpensesFixed Selling and Administrative ExpensesPeriodCosts
4Quick Check Which method will produce the highest valuesfor work in process and finished goodsinventories?a. Absorption costing.b. Variable costing.c. They produce the same values for theseinventories.d. It depends
5Quick Check Which method will produce the highest valuesfor work in process and finished goodsinventories?a. Absorption costing.b. Variable costing.c. They produce the same values for theseinventories.d. It depends. . .
6Unit Cost ComputationsHarvey Company produces a single productwith the following information available:
7Unit Cost ComputationsUnit product cost is determined as follows:Under absorption costing, all production costs, variableand fixed, are included when determining unit productcost. Under variable costing, only the variableproduction costs are included in product costs.
8Learning Objective 2Prepare income statements using bothvariable and absorption costing.
9Variable and Absorption Costing IncomeStatementsLet’s assume the following additional informationfor Harvey Company. 20,000 units were sold during the year at a priceof 30 each. There is no beginning inventory.Now, let’s compute net operating income usingboth absorption and variable costing.
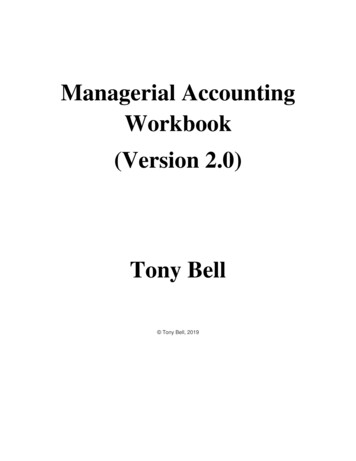
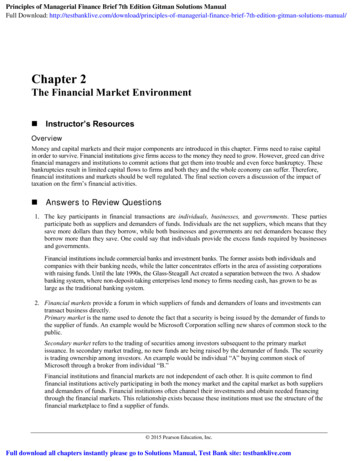
10Variable Costing Contribution Format IncomeStatementAll fixedVariablemanufacturingcosts only.manufacturingoverhead isexpensed.Variable CostingSales (20,000 30)Less variable expenses:Variable cost of goods sold (20,000 10)Variable selling & administrativeexpenses (20,000 3)Total variable expensesContribution marginLess fixed expenses:Fixed manufacturing overheadFixed selling & administrative expensesNet operating income 600,000 200,00060,000260,000340,000 150,000100,000250,000 90,000
11Absorption Costing Income StatementUnit productcost.Fixed manufacturing overhead deferred ininventory is 5,000 units 6 30,000.
12Learning Objective 3Reconcile variable costing and absorptioncosting net operating incomes and explainwhy the two amounts differ.
13Comparing the Two Methods
14Comparing the Two MethodsWe can reconcile the difference betweenabsorption and variable income as follows:Variable costing net operating income 90,000Add: Fixed mfg. overhead costsdeferred in inventory(5,000 units 6 per unit)30,000Absorption costing net operating income 120,000Fixed mfg. overhead 150,000 6 per unitUnits produced25,000 units
15Extended Comparisons of Income Data HarveyCompany – Year Two
16Unit Cost ComputationsSince the variable costs per unit, total fixed costs,and the number of units produced remainedunchanged, the unit cost computations alsoremain unchanged.
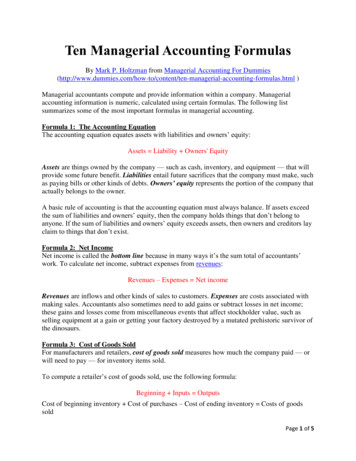
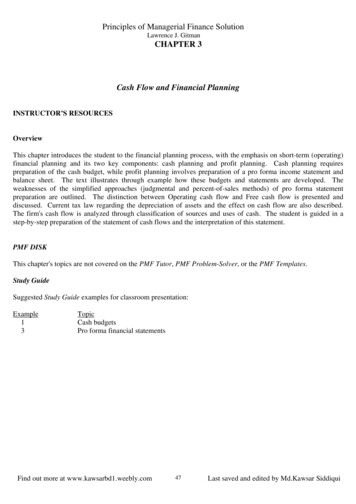
17Variable Costing Contribution Format IncomeStatementVariablemanufacturingcosts only.All fixedmanufacturingoverhead isexpensed.Variable CostingSales (30,000 30)Less variable expenses:Variable cost of goods sold (30,000 10)Variable selling & administrativeexpenses (30,000 3)Total variable expensesContribution marginLess fixed expenses:Fixed manufacturing overheadFixed selling & administrative expensesNet operating income 900,000 300,00090,000390,000510,000 150,000100,000250,000 260,000
18Absorption Costing Income StatementUnit productcost.Fixed manufacturing overhead released frominventory is 5,000 units 6 30,000.
19Comparing the Two MethodsWe can reconcile the difference betweenabsorption and variable income as follows:Variable costing net operating income 260,000Deduct: Fixed manufacturing overheadcosts released from inventory(5,000 units 6 per unit)30,000Absorption costing net operating income 230,000Fixed mfg. overhead 150,000 6 per unitUnits produced25,000 units
20Comparing the Two Methods
21Summary of Key Insights
22Enabling CVP AnalysisVariable costing categorizes costs as fixed andvariable so it is much easier to use this incomestatement format for CVP analysis.Because absorption costing assigns fixedmanufacturing overhead costs to units produced ( 6per unit for Harvey Company), a portion of fixedmanufacturing overhead resides in inventory whenunits remain unsold. The potential result is positiveoperating income when the number of units sold isless than the breakeven point.
23Explaining Changes in Net Operating IncomeVariable costing income is only affected bychanges in unit sales. It is not affected bythe number of units produced. As a generalrule, when sales go up, net operatingincome goes up, and vice versa.Absorption costing income is influenced bychanges in unit sales and units ofproduction. Net operating income can beincreased simply by producing more unitseven if those units are not sold.
24Supporting Decision MakingVariable costing correctly identifies the additionalvariable costs incurred to make one more unit ( 10per unit for Harvey Company). It also emphasizesthe impact of total fixed costs on profits.Because absorption costing assigns fixedmanufacturing overhead costs to units produced ( 6per unit for Harvey Company), it gives the impressionthat fixed manufacturing overhead is variable withrespect to the number of units produced, but it is not.The result can be inappropriate pricing decisions andproduct discontinuation decisions.
25Learning Objective 4Prepare a segmented income statementthat differentiates traceable fixed costsfrom common fixed costs and use it tomake decisions.
26Decentralization and Segment ReportingAn Individual StoreQuick MartA segment is any partor activity of anorganization aboutwhich a managerseeks cost, revenue,or profit data.A Sales TerritoryA Service Center
27Keys to Segmented Income StatementsThere are two keys to buildingsegmented income statements:A contribution format should be usedbecause it separates fixed from variablecosts and it enables the calculation of acontribution margin.Traceable fixed costs should be separatedfrom common fixed costs to enable thecalculation of a segment margin.
28Identifying Traceable Fixed CostsTraceable fixed costs arise because of theexistence of a particular segment and woulddisappear over time if the segment itselfdisappeared.No computerdivision means . . .No computerdivision manager.
29Identifying Common Fixed CostsCommon fixed costs arise because of theoverall operation of the company and wouldnot disappear if any particular segment wereeliminated.No computerdivision but . . .We still have acompany president.
30Traceable Costs Can BecomeCommon CostsIt is important to realize that the traceable fixedcosts of one segment may be a common fixedcost of another segment.For example, the landing feepaid to land an airplane at anairport is traceable to theparticular flight, but it is nottraceable to first-class,business-class, and economyclass passengers.
31Segment MarginProfitsThe segment margin, which is computed by subtractingthe traceable fixed costs of a segment from itscontribution margin, is the best gauge of the long-runprofitability of a segment.Time
32Traceable and Common CostsFixedCostsTraceableDon’t allocatecommon costs tosegments.Common
33Levels of Segmented StatementsWebber, Inc. has two divisions.Webber, Inc.Computer DivisionTelevision DivisionLet’s look more closely at the TelevisionDivision’s income statement.
34Levels of Segmented StatementsOur approach to segment reporting uses thecontribution format.Income StatementContribution Margin FormatTelevision DivisionSales 300,000Variable COGS120,000Other variable costs30,000Total variable costs150,000Contribution margin150,000Traceable fixed costs90,000Division margin 60,000Cost of goodssold consists ofvariablemanufacturingcosts.Fixed andvariable costsare listed inseparatesections.
35Levels of Segmented StatementsOur approach to segment reporting uses thecontribution format.Income StatementContribution Margin FormatTelevision DivisionSales 300,000Variable COGS120,000Other variable costs30,000Total variable costs150,000Contribution margin150,000Traceable fixed costs90,000Division margin 60,000Contribution marginis computed bytaking sales minusvariable costs.Segment marginis Television’scontributionto profits.
36Levels of Segmented StatementsSalesVariable costsCMTraceable FCDivision marginCommon costsNet operatingincomeIncome StatementCompanyTelevision 500,000 0,000 60,000Computer 200,00080,000120,00080,000 40,000
37Levels of Segmented StatementsSalesVariable costsCMTraceable FCDivision marginCommon costsNet operatingincomeIncome StatementCompanyTelevision 500,000 0,000 60,00025,000 75,000Computer 200,00080,000120,00080,000 40,000Common costs should notbe allocated to thedivisions. These costswould remain even if oneof the divisions wereeliminated.
38Traceable Costs Can BecomeCommon CostsAs previously mentioned, fixed costs thatare traceable to one segment can becomecommon if the company is divided intosmaller segments.Let’s see how this worksusing the Webber, Inc.example!
39Traceable Costs Can BecomeCommon CostsWebber’s Television DivisionTelevisionDivisionRegularBig ScreenProductLines
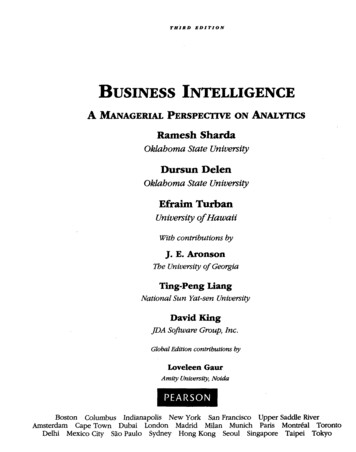
40Traceable Costs Can BecomeCommon CostsIncome StatementTelevisionDivisionRegularSales 200,000Variable costs95,000CM105,000Traceable FC45,000Product line margin 60,000Common costsDivisional marginBig Screen 100,00055,00045,00035,000 10,000We obtained the following information fromthe Regular and Big Screen segments.
41Traceable Costs Can BecomeCommon CostsIncome StatementTelevisionDivisionRegularSales 300,000 200,000Variable costs150,00095,000CM150,000105,000Traceable FC80,00045,000Product line margin70,000 60,000Common costs10,000Divisional margin 60,000Big Screen 100,00055,00045,00035,000 10,000Fixed costs directly tracedto the Television Division 80,000 10,000 90,000
42Segmented Income Statements— DecisionMaking and Break-even AnalysisOnce a company preparescontribution format segmentedincome statements, it can usethose statements to makedecisions and perform breakeven analysis.
43Segmented Income Statements— DecisionMaking5% increase in salesIncome StatementTelevisionDivisionRegularSales 315,000 210,000Variable costs157,50099,750CM157,500110,250Traceable FC80,00045,000Product line margin77,500 65,250Common costs15,000Divisional margin 62,500 5,000 additionaladvertisingDivision marginincreases by 2,500Big Screen 105,00057,75047,25035,000 12,250Marginincreasesby 5,250Marginincreasesby 2,250
44Learning Objective 5Compute companywide and segment breakeven points for a company with traceable fixedcosts.
45Segmented Income Statements— Break-evenAnalysisSalesVariable costsCMTraceable FCDivision marginCommon costsNet operatingincomeIncome StatementCompanyTelevision 500,000 0,000 60,00025,000 75,000Computer 200,00080,000120,00080,000 40,000
46Segmented Income Statements— Break-evenAnalysisSalesVariable costsCMTraceable FCDivision marginCommon costsNet operatingincomeIncome StatementCompanyTelevision 500,000 0,000 60,00025,000 Computer 200,00080,000120,00080,000 40,00075,000The companywide break-even point is computed by dividing thesum of the company’s traceable fixed costs and common fixedcosts by the company’s overall contribution margin ratio.
47Segmented Income Statements— Break-evenAnalysisBreak-even 170,000 25,000 361,111Point0.54Contribution Margin 270,000 Ratio 500,000 0.54The companywide break-even point is computed by dividing thesum of the company’s traceable fixed costs and common fixedcosts by the company’s overall contribution margin ratio.
48Segmented Income Statements— Break-evenAnalysisSalesVariable costsCMTraceable FCDivision marginCommon costsNet operatingincomeIncome StatementCompanyTelevision 500,000 0,000 60,00025,000 Computer 200,00080,000120,00080,000 40,00075,000A business segment’s break-even point is computed by dividing itstraceable fixed costs by its contribution margin ratio.
49Segmented Income Statements— Break-evenAnalysisTelevisionBreak-even 90,000 Point0.50Contribution Margin RatioComputerBreak-evenPoint 80,0000.60 180,000 150,000 300,000 0.50 133,333Contribution Margin 120,000 Ratio 200,000 0.60A business segment’s break-even point is computed by dividing itstraceable fixed costs by its contribution margin ratio.
50Segmented Income Statements— Break-evenAnalysisSalesVariable costsCMTraceable FCDivision marginCommon costsNet operatingincomeIncome StatementCompanyTelevision 500,000 0,000 60,00025,000 Computer 200,00080,000120,00080,000 40,00075,000Notice the 25,000 of companywide common fixed costs areexcluded from the segment break-even calculations because thecommon fixed costs are not traceable to segments and are notinfluenced by segment-level decisions.
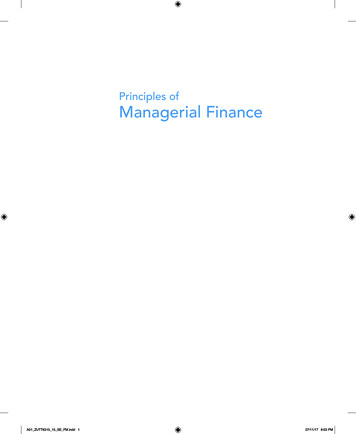
51Omission of CostsCosts assigned to a segment should includeall costs attributable to that segment from thecompany’s entire value chain.Business FunctionsMaking Up TheValue ChainR&DProductDesignCustomerManufacturing Marketing Distribution Service
52Inappropriate Methods of Allocating CostsAmong SegmentsFailure to tracecosts directlySegment1Segment2Inappropriateallocation baseS
Variable costing categorizes costs as fixed and variable so it is much easier to use this income statement format for CVP analysis. Because absorption costing