Transcription
Proceedings of the International MultiConference of Engineers and Computer Scientists 2010 Vol III,IMECS 2010, March 17 - 19, 2010, Hong KongAdopting Lean Principles: A Case StudyN.S.M.ShalahimAbstract—This paper presents a case study in which improvedactivities in a manufacturing centre is conducted. Themanufacturing centre practices make-to-order whichmanufacture its’ product during a particular period when theorder is received from its’ customer (seasonal). The objective ofthis study is to plan activities for the manufacturing centre tofully utilize its resources (employees, machines, andmethodology) during the period when the demand is low(off-season). This paper proposed to adopt Lean Principles asthe main thrust aligned with The Seven Management andPlanning Tools (7 MP) in achieving the objective. Only AffinityDiagram, Matrix Data Analysis, and Activity Network Diagramwill be represented in this paper while in the actual case studyother tools of the 7 MP tools will be used. The result shows thatsimple method of planning the activities during the off-seasonperiod using 7 MP tools align with the Lean Principles canmake significant contribution to utilize the resources.Index Terms— Lean Principles, Seven New Management andPlanning Tools, Seasonal DemandI. INTRODUCTIONLiterature suggested forecasting, make-to-stock, andexponential smoothing were the reasonable methods inattending seasonal adjustment problem [3], [4]. Adaptivemethods in exponential smoothing were also suggested [1].However, the methods suggested are highly depending on theaccuracy of the forecast in demand order [5]. Occurrence inmaking wrong decision in forecasting will increase the sizeof inventory for raw material and also increase the number ofprocesses product which are not needed by the customer [2].This situation is regarded as waste [6].This paper presents a case study which improved theutilization of the manufacturing centre resources (employee,machines, and methodology) during off-season period. Thispaper proposes a methodology to introduce simple planningtools (7 MP) aligned with Lean Manufacturing philosophy inhandling seasonality demand in a manufacturing centre.II.LITERATURE REVIEWVarious approaches have been suggested in attending theoff-season period in seasonality demand manufacturingcompanies [5], [3]. One of the approaches is to practiceforecasting in inventory control. It controls safety stock andholds inventories of raw material and manufactured products.However, this approach is not popular amongst seasonalmanufactured companies and is treated rather casually [2].Manuscript received December 15, 2008.N.S.M.Shalahim is with the Faculty of Mechanical Engineering,Universiti Malaysia Pahang, Lebuhraya Tun Razak, 26300 Gambang,Pahang, Malaysia. (phone: 609-5492215; fax: 609-5492233; e-mail:shahida@ump.edu.my).ISBN: 978-988-18210-5-8ISSN: 2078-0958 (Print); ISSN: 2078-0966 (Online)Another suggestion is to adopt method such as simpleexponential smoothing to set the value in smoothing theparameters and stabilizing the seasonal demand [1].However, there is no evidence that adaptive smoothingparameters have offered any significant advantage in forecastaccuracy [2]. This also will contribute to unnecessary wastein inventory of material and unwanted products inmanufacturing companies [6].The off-season period in seasonality demand could alsoresult as waste if no proper planning is implemented duringthis period. Wastes that could result from the seasonalitydemand is waiting time, where the employee needs to wait fora long time for the next seasonal period. Lean Manufacturingis a multi-dimensional approach that encompasses widevariety of management practices, which can be alignedtogether to create value towards customer [9]. Based on thisinformation, the empirical study considers adopting the LeanManufacturing principles as the main emphasis in thisresearch work.The Seven Management and Planning Tools (7 MP) areused in this empirical research because they providedmethods of organizing verbal data. The basic 7 QC toolswere very effective but focused on numerical data. The 7 MPtools are; Affinity Diagram (AD), Interrelationship Diagram(ID), Tree Diagrams, Matrix Diagram, Matrix Data Analysis(MDA), Arrow Diagrams (Activity Network Diagram), andProcess Decision Program Charts (PDPC). These tools areused for untangling the intricate relationships among thedifferent elements of a problem and to make it easy to clarifya situation, establish a plan and get to the root of the problem.In brief, AD is used to find the most important factors froma large number of ideas, opinions, and issues. ID is used tofind the cause and effect relationships in data using graphicaltechniques, while Tree Diagram is used to get from a highlevel to a low level detail (goals to tasks). Matrix Diagram isused to map between two sets of information (e.g. sets ofcurrent and future processes) and MDA quantifies andarranges data presented in a Matrix Diagram, to find moregeneral indicators that would differentiate and give clarity tolarge amount of complexly intertwined information. PDPC isa tool for preventing unanticipated problems frequentlyoccurring in complex systems and achieving desiredobjectives. Only three of these tools which are AD, MDA,and Arrow Diagram are presented in this paper.Submit your manuscript electronically for review.III.THE EMPIRICAL RESEARCHThis empirical research is based on a case study in amanufacturing centre that experiences seasonal environment.The research objective is to utilize the manufacturingresources during the off-season period. To achieve theobjective, the centre’s resources such as man, machines,material, method, and environment are taken as dependentvariables while the off-season period also known as ‘idleIMECS 2010
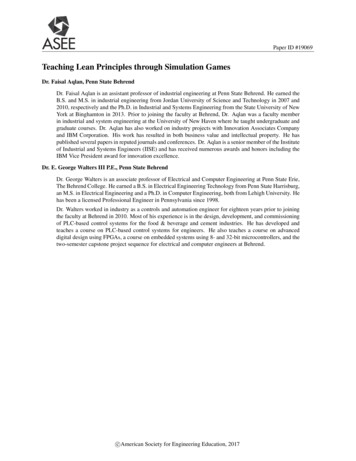
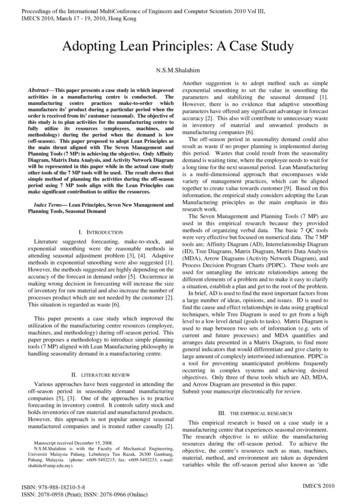
Proceedings of the International MultiConference of Engineers and Computer Scientists 2010 Vol III,IMECS 2010, March 17 - 19, 2010, Hong Kongtime’ is used as independent variables. Figure 1 shows themanufacturing centre’s demand patterns throughout theyears.Figure 1 Demand pattern for the manufacturing centreA. The Seasonal DemandThe manufacturing centre will be fully utilized from June toOctober and from November to March every year. Duringthis period, the manufacturing centre will utilize everyresource in its facility up to 100 percent. The seasonaldemand happens because the manufacturing centre alwayschanges their products during every season according to thecustomers’ orders.The manufacturing centre is notpermissible to manufacture any product in advance until theexact order, design and quantity are received from thecustomers. Due to this, the manufacturing centre is also notallowed to hold any inventories for raw materials or productsuntil the exact order is received.B. Make-to-OrderDue to the seasonal customer demand, the manufacturingcentre practices make-to-order instead of make-to-stock.Hence, no high inventory for raw materials and products arerequired. Consequently the manufacturing process is leanwhere there is minimum waste. For instance, only one part isprocessed at any particular time and the employees areresponsible for their own products. As a result, themanufacturing centre requires less movement of productswhile being processed. The other advantage is that there issufficient number of operators per parts and less waiting timeby the operators during the seasonal period.C. The Off-Season PeriodDue to this make-to-order seasonal environment, theoperation will be down during the off-season period. Thissituation does not add any value to the manufacturing centre,especially in waiting time of the operators and machines fornew products to come. One of the probable solutions thathave been done by the top management is to encourage theoperators to go for a holiday during this time. This solutionalso does not contribute any value to the manufacturingcentre especially in the development of their employees andprocesses. Therefore, the management is planning to includesome activities for the employees during this off-seasonperiod. The activities are believed to increase the employees’performance at work and will add value to the manufacturingcentre environment.D. Value-added ActivitiesSome propositions of activities have been forwarded by theemployees of the manufacturing centre. These activities havebeen considered by the top management. The propositionsare ranked according to their importance due to the benefitsfor the manufacturing centre and their employees. SeriousISBN: 978-988-18210-5-8ISSN: 2078-0958 (Print); ISSN: 2078-0966 (Online)attempt are made by the top management to fulfill everyproposition of activities made by the employees. Theproblem arises when prioritizing the activities. All thepropositions seem to be important to the manufacturingcentre.In order to prioritize the propositions, themanufacturing centre proposes to use 7 New Managementand Planning Tools in prioritizing and planning the activities.E. From Waste to ValueThe manufacturing centre has two off-season periods. Theoff-season period or ‘idle time’ occurs from the middle ofOctober to end of November and from early March to earlyJune every year. The minimum duration for the idle time isthree months every year. The idle time is considered as wasteby the top management. Therefore, the top management hasplan activities to convert the waste to value added activitiesfor the benefits indulge of the employees and themanufacturing centre during this off-season period.F. Additional Consideration FactorsIn planning the activities, the top management has made aconsideration for other factors, which will affect their planfor the off-season period. The factors taken for considerationare:a)The employee plans to take their annual leaveduring this period.b)Different approach for different types of departmentin the manufacturing centre as shown in Table 1. Themanufacturing centre consists of three manufacturingdepartments.The Central Machining Department(CMD), the Machining Department (MD), and FittingDepartment (FD). These departments have variousdifferent functions in the manufacturing centre.Table 1 Types of departmentsWhen planning the activities to be held during theoff-season period, the manufacturing centre is actuallyplanning to practice manufacturing lean. In this lean activity,waste to be eliminated is the ‘idle time’ or the off-seasonperiod. The ultimate aim is to fully utilize every resource inthe manufacturing centre during this off-season period.IV.RESEARCH METHODOLOGYIn order to carry out this empirical study, a set of data andinformation are collected through the distribution ofquestionnaires and interviews. The questionnaires aredistributed to all employees at the manufacturing centre and agroup of employees are selected to be interviewed for thein-depth study. The selection of the employees is based onIMECS 2010
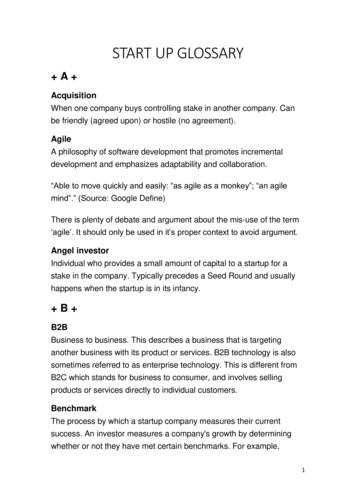
Proceedings of the International MultiConference of Engineers and Computer Scientists 2010 Vol III,IMECS 2010, March 17 - 19, 2010, Hong Kongthe marks from the questionnaires given previously. Onlyemployees that achieve high marks and suggested a numbersof suggestions will be selected for an interview. The selectedemployees are from various departments in themanufacturing centre.The tools that have been used were Affinity Diagram(AD), Matrix Data Analysis (MDA), and the ActivityNetwork Diagram (AND). Brainstorming was conducted toexpand the data received from the questionnaires and theinterviews. After the brainstorming session, the data wereelaborated using AD. AD is used to gather large amounts ofintertwined verbal data. It organizes the verbal data intogroups based on natural relationship. The formation ofdistinct groups helps to bring about a meaningful picture,thereby making it feasible for further analysis and to findsolutions to the problem. The major problems that have beenemphasized from AD will be analyzed using MDA. Fivemain factors have been elaborated in MDA. MDA consistsof a number of columns and rows whose intersections arechecked up, to find out the nature and strength of theproblem.This tool helped to get the key ideas and analyzing therelationship or its absence at the intersection and finding aneffective way of pursuing the problem solving method. In thefinal step of MDA, the solutions of the problems with thehighest point will be considered. This tool is used to plan themost appropriate schedule for any complex task and all of itsrelated subtasks. It projects likely completion time andmonitors all subtasks for adherence to the necessaryschedule. This is used when the task at hand is a familiar onewith subtasks that are of a known duration.A. Qualitative Data from the EmployeeThe questionnaire that was distributed to the employeecontains question on how the seasonal environment affecttheir daily plans and work; for instance the employee is notallowed to go for a vacation during this seasonal period. Thequestionnaire also covered issues such as how the employeesplan their daily life especially during the seasonal period andduring off-season period for purposes of comparison. Thequestionnaire also demands for suggestions from theemployee on activities that could be done during theoff-season period and also suggestions on how to improvetheir workmanship. Such information and data that aregenerated from the questionnaire was classified according toits’ contribution the manufacturing’s resources such as man,method, machine, material, and environment as shown inFigure 2.B. The Information WeightDue to the suggestions received from the questionnaire,the research has weighted the suggestions according to itspriority by doing in depth case study by interviewing theselected employees. Information received from the interviewis used as a measuring weight in constructing MDA. MDA isused to prioritize the activity received from the questionnairedue to it’s’ importance. The result from the in depth casestudy are shown in Table 2 and 3. In Table 2, the MDA isused to prioritize the importance of the manufacturingcentre’s resources (man, machine, method, material, andenvironment). The most weighted resources are identifiedand ranked based on its importance (man, machine, andISBN: 978-988-18210-5-8ISSN: 2078-0958 (Print); ISSN: 2078-0966 (Online)method). These selected resources are believed to be themain contributor to the company success. The result will beused as the main parameter to be measured with valueactivities that soon are planned. In Table 3, the suggestionsfrom the employees are weighted during the interviewsession and discussions with the selected employee. Anotherseparate session of discussion with the top management isalso held. From this interview and discussion, the weightedcriteria are added to the MDA diagram in Table 4. Theoutcome of the analysis is to prioritize the most popularactivities to be held during the off-season period. Data fromTable 3 and Table 4 will be used in generating prioritizingMDA as in Table 5.C. Prioritizing the SuggestionsWith reference to Table 5, the employees have suggestedthat the machinery maintenance activity shall be the toppriority of all the suggestion. The maintenance activityincludes training of the employee on how to service, repairand maintain the machinery.Second most popularsuggestion is the management shall allocate more time duringthis off-season period in training the employee on (other thanwork training) for example, safety training. The employeesfeel that more frequent fire-drill training is most suitable to bedone during this off-season period. The third most weightedsuggestion is to conduct short courses training such asContinuous Quality Improvement Program. This shortcourse is able to improve the employees’ knowledge andefficiency towards producing high quality product in future.The employees also suggested to the management to conductsupplier evaluation during this period. This is to preventdefective raw material be sent to the manufacturing centre infuture. Another most weighted activity that could be doneduring this period of time is to do ‘spring cleaning’ orimplement order and cleanliness program in themanufacturing centre. This is because during the seasonalperiod, it is hard to implement order and cleanlinessthroughout that time.V.EMPIRICAL FINDINGSThe interviews were carried out with the aim ofunderstanding the extent to which the various activitiessuggested by the employee to be applied in themanufacturing centre. As previously stated, the degree ofadoption of each activity was measured by the carryingweight of each suggestion from the interviews anddiscussions with selected employee and the top management.The measured weight is used in MDA as discussed in Section4.2 and 4.3.A. Planning the SuggestionsThe ranking of the selected activities and its’ weight isgiven in Table 4. In general, the manufacturing centre hasdedicated a great deal of attention to all the activities given inthis activity (the activity suggested by the employee to beimplemented during the off-season period). In particular,great effort has been done by the top management toimplement every activities suggested. The final impressions,as a result of MDA, only top five suggestions were selected.IMECS 2010
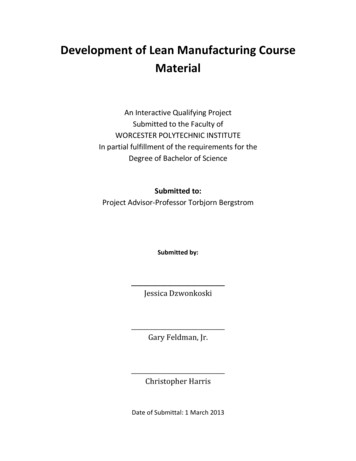
Proceedings of the International MultiConference of Engineers and Computer Scientists 2010 Vol III,IMECS 2010, March 17 - 19, 2010, Hong KongFigure 2 Affinity DiagramFigure 3 The Activity Network DiagramISBN: 978-988-18210-5-8ISSN: 2078-0958 (Print); ISSN: 2078-0966 (Online)IMECS 2010
Proceedings of the International MultiConference of Engineers and Computer Scientists 2010 Vol III,IMECS 2010, March 17 - 19, 2010, Hong KongTable 2 Ranking the criteriaTable 3 Ranking option by criteriaTable 4 Ranking option by all criteriaTable 5 The rank of activitiesISBN: 978-988-18210-5-8ISSN: 2078-0958 (Print); ISSN: 2078-0966 (Online)IMECS 2010
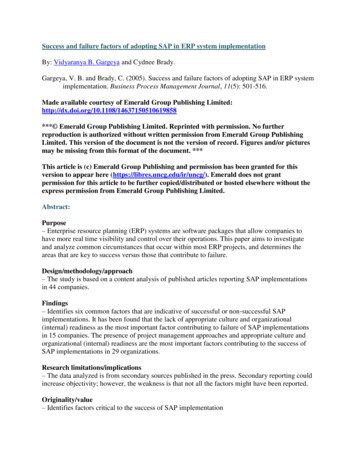
Proceedings of the International MultiConference of Engineers and Computer Scientists 2010 Vol III,IMECS 2010, March 17 - 19, 2010, Hong KongThe planning stage begins with identifying the duration foreach activity. The Activity Network Diagram in Figure 3shows the schedule and the duration for the top five selectedactivities.B. Utilization of ResourcesIn reference to Figure 3, an analysis has been made on thelevel of utilization of the manufacturing centre’s resources(employee, machinery, and method). In the analysis, the timefactor (days during the off-season period) is the independentvariable, while the resources is the dependent variable. Theresults from the analysis received are shown in Figure 4.activities have benefited the manufacturing centre inhandling the manufacturing waste (the off-season period).ACKNOWLEDGMENTThe author would like to acknowledge the personnel at themanufacturing centre for their re 4 Utilization of resources[9]D.W. Trigg, A.G. Leach, “Exponential smoothing with an adaptiveresponse rate”, Operational Research Quarterly, vol. 18, 1967,pp.53-59.E.S. Gardner, J. Diaz-Saiz, “Seasonal adjustment of inventory demandseries: a case study”, Journal of Forecasting, vol. 18, 1985,pp.117-123.E.S. Gardner, “Exponential smoothing: the state of the art”, Journal ofForecasting, vol. 4, 1985, pp.1-38.E.S. Gardner, E. McKenzie, “Model identification in exponentialsmoothing”, Journal of Operational Research Society, vol. 39, 1988,pp.863-867.G.B. Williams, M. Wethues, Manufacturing With Extreme SeasonalDemand, Bristol: Taylor & Francis, 1994, pp. 123–135.J.P. Womack, D.T. Jones, Manufacturing Lean Thinking: BanishWaste and Create Wealth in Your Corporation, Simon & Schuster,1996, pp. 245-279.K.O. Cua, K.E. McKone., R.G. Schroeder, “Relationship betweenimplementation of TQM, JIT, TPM, and manufacturing performance”,Journal of Operations Management, vol. 19, 1985, pp. 117-123.M. Brassard, The Memory Jogger Plus Featuring the SevenManagement and Planning Tools. McGraw-Hill, 1989, pp. 123–135.R. Shah, P.T. Ward, “Lean manufacturing: context, practice bundlesand performance”, Journal of Operations Management, vol. 21, 2002,pp. 129-149.In reference to Figure 4, the block diagram includes theinterrelationship between the resources (employee,machinery, and method) and the departments in themanufacturing centre respectively.The time factor (working days during the off-season period)is used as a measuring weight in this diagram, has beentranslated into percentage in measuring the utilization of theresources.From the diagram, there is a significantimprovement in utilizing the time of their employees duringthis off-season period in the range of 64.6 to 87.9 percent.The involvement of the machinery during this off-seasonperiod range between 33.3 to 47 percent and the activities forimproving the methodology are 25.8 percent with respect toeach department. This has shown that the value addedactivities, which has planned in Figure 4, has increased theutilization of resources in the manufacturing centre duringthis off-season period.VI. CONCLUSIONManagement extrapolated the result presented in Figure 4to the entire Activity Network Diagram (as shown in Figure3) and estimated that the total utilization in manufacturingresources is 59 days from 66 days during the off-seasonperiod.Another benefit would be gained by themanufacturing centre is the increment of the morale amongstthe employees in the centre. During this planned activities,the management has arranged trainings for the employees toimprove their working skills, safety, continuousimprovement, order and cleanliness in the working area. Themanagement also has used the opportunity during thefire-drill training to address the employee in themanufacturing centre statutory. Therefore, the plannedISBN: 978-988-18210-5-8ISSN: 2078-0958 (Print); ISSN: 2078-0966 (Online)IMECS 2010
a long time for the next seasonal period. Lean Manufacturing is a multi-dimensional approach that encompasses wide variety of management practices, which can be aligned together to create value towards customer [9]. Based on this information, the empirical study considers adopting the Lean Manuf