Transcription
MAE 322Machine DesignLecture 5FatigueDr. Hodge JenkinsMercer University
Introduction to Fatigue in MetalsCyclic loading produces stresses that are variable, repeated,alternating, or fluctuating Fracture at Maximum stresses well below yield strength (SY) Failure occurs after many stress cycles Failure is by sudden ultimate fracture No visible warning in advance of failure Shigley’s Mechanical Engineering Design
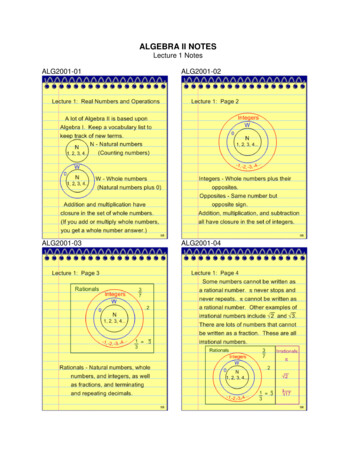
Stages of Fatigue FailureStage I – Initiation of microcrack due to cyclic plasticdeformation Stage II – Progresses tomacro-crack that repeatedlyopens and closes, creatingbands called beach marks Stage III – Crack haspropagated far enough thatremaining material isinsufficient to carry the load,and fails by simple ultimatefailure Fig. 6–1Shigley’s Mechanical Engineering Design
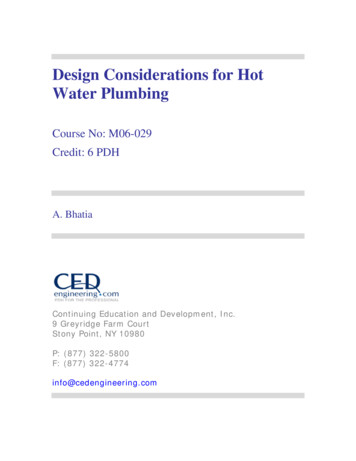
Schematics of Fatigue Fracture SurfacesFig. 6–2Shigley’s Mechanical Engineering Design
Schematics of Fatigue Fracture SurfacesShigley’s Mechanical Engineering Design
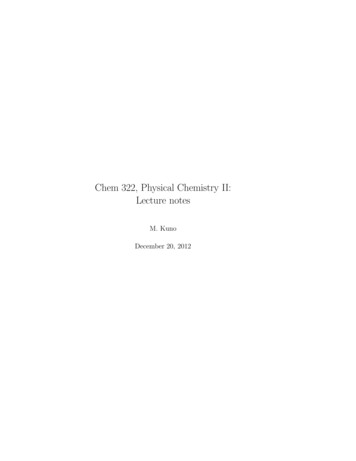
Fatigue Fracture Examples AISI 4320 driveshaftB– crack initiation atstress concentrationin keywayC– Final brittlefailureFig. 6–3Shigley’s Mechanical Engineering Design
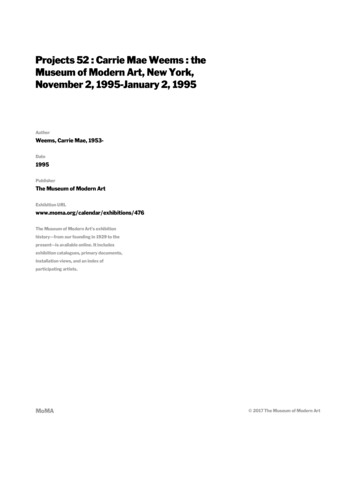
Fatigue Fracture Examples Fatigue failureinitiating atmismatched greaseholesSharp corners (atarrows) providedstress concentrationsFig. 6–4Shigley’s Mechanical Engineering Design
Fatigue Fracture Examples Fatigue failure offorged connecting rodCrack initiated at flashline of the forging at theleft edge of pictureBeach marks showcrack propagationhalfway around the holebefore ultimate fractureFig. 6–5Shigley’s Mechanical Engineering Design
Fatigue Fracture Examples Fatigue failure of a200-mm diameterpiston rod of an alloysteel steam hammerLoaded axiallyCrack initiated at aforging flake internal tothe partInternal crack grewoutward symmetricallyFig. 6–6Shigley’s Mechanical Engineering Design
Fatigue-Life MethodsThree major fatigue life models Methods predict life in number of cycles to failure, N, for aspecific level of loading Stress-life method (used in most designs) Least accurate, particularly for low cycle applications Most traditional, easiest to implement Strain-life method Detailed analysis of plastic deformation at localized regions Several idealizations are compounded, leading to uncertaintiesin results Linear-elastic fracture mechanics method Assumes crack exists Predicts crack growth with respect to stress intensity Shigley’s Mechanical Engineering Design
Stress-Life Method Test specimens are subjected to repeated stress while counting cyclesto failureMost common test machine is R. R. Moore high-speed rotating-beammachineSubjects specimen to pure bending with no transverse shearAs specimen rotates, stress fluctuates between equal magnitudes oftension and compression, known as completely reversed stress cyclingSpecimen is carefully machined and polishedFig. 6–9Shigley’s Mechanical Engineering Design
S-N DiagramNumber of cycles to failure at varying stress levelsis plotted on log-log scale For steels, a knee occurs near 106 cycles Strength corresponding to the knee is called endurance limit Se Fig. 6–10Shigley’s Mechanical Engineering Design
S-N Diagram for Steel Stress levels below Se (Endurance Strength) predict infinite lifeBetween 103 and 106 cycles, finite life is predictedBelow 103 cycles is known as low cycle, and is often consideredquasi-static. Yielding usually occurs before fatigue in this zone.SUTSeFig. 6–10Shigley’s Mechanical Engineering Design
S-N Diagram for Nonferrous Metals Nonferrous metals often do not have an endurance limit.Fatigue strength Sf is reported at a specific number of cyclesFigure 6–11 shows typical S-N diagram for aluminumsFig. 6–11Shigley’s Mechanical Engineering Design
Strain-Life Method Method uses detailed analysis of plastic deformation at localizedregionsCompounding of several idealizations leads to significantuncertainties in numerical resultsUseful for explaining nature of fatigueNot so useful in Machine DesignShigley’s Mechanical Engineering Design
Linear-Elastic Fracture Mechanics Method Assumes Stage I fatigue (crack initiation) has occurred Predicts crack growth in Stage II with respect to stressintensity Stage III ultimate fracture occurs when the stress intensityfactor KI reaches some critical level KIcShigley’s Mechanical Engineering Design
Crack Growth Substituting Eq. (6–4) into Eq. (6–5) and integrating, ai is the initial crack lengthaf is the final crack length corresponding to failureNf is the estimated number of cycles to produce a failure after theinitial crack is formed Shigley’s Mechanical Engineering Design
Returning to Stress-Life Fatigue ModelingFatigue Stress-Life: Sf-N Diagram for steels Stress levels below Se (Endurance Strength) predict infinite lifeBetween 103 and 106 cycles, finite life is predictedBelow 103 cycles is known as low cycle,SUT𝑆𝑓′SeFig. 6–10Shigley’s Mechanical Engineering Design
Fatigue Strength For design, an approximation of the idealized S-N diagram isdesirable.To estimate the fatigue strength at 103 cycles, start with Eq. (6–2) Define the specimen fatigue strength at a specific number ofcycles as Combine with Eq. (6–2),Shigley’s Mechanical Engineering Design
Fatigue Strength At 103 cycles,f is the fraction of Sut represented by ( S f )103Solving for f, The SAE approximation for steels with HB 500 may be used. To find b, substitute the endurance strength and correspondingcycles into Eq. (6–9) and solve for b Shigley’s Mechanical Engineering Design
Fatigue Strength Fraction fPlot Eq. (6–10) for the fatigue strength fraction f of Sut at 103cycles Use f from plot for S'f f Sut at 103 cycles on S-N diagram Assumes Se S'e 0.5Sut at 106 cycles Fig. 6–18Shigley’s Mechanical Engineering Design
Equations for S-N Diagram Write equation for S-N linefrom 103 to 106 cyclesTwo known pointsAt N 103 cycles,Sf f SutAt N 106 cycles,Sf SeEquations for line:Fig. 6–10Shigley’s Mechanical Engineering Design
Equations for S-N Diagram If a completely reversed stress srev is given, setting Sf srev inEq. (6–13) and solving for N (cycles to failure) gives, Note that the typical S-N diagram is only applicable forcompletely reversed stressesFor other stress situations, a completely reversed stress with thesame life expectancy must be used on the S-N diagram Shigley’s Mechanical Engineering Design
Low-cycle Fatigue Low-cycle fatigue is defined for fatigue failures in the range1 N 103On the idealized S-N diagram on a log-log scale, failure ispredicted by a straight line between two points (103, f Sut) and(1, Sut)Shigley’s Mechanical Engineering Design
Example 6–2Shigley’s Mechanical Engineering Design
Example 6–2 (continued)Shigley’s Mechanical Engineering Design
machine Subjects specimen to pure bending with no transverse shear As specimen rotates, stress fluctuates between equal magnitudes of tension and compression, known as completely reversed stress cycling Specimen is carefully machined and polished Shigley’