Transcription
The Myers-Briggs Type Indicator and First-YearCollege Achievement: A Look Beyond AptitudeTest ResultsK. Terry SchurrVirgil E. RubleBall State UniversityA thorough study of an entire entering col/ege classshows that Is and Ns tend to have both higher aptitude andachievement scores than Es and Ss; Js and Psare similar in aptitude, but Js tend to achieve more.Further findings are presented, and implications forcol/ege teaching are discussed.This report summarizes results of a oneyear follow-up of the academic achievementof 2,713 students who entered Ball StateUniversity in the 1983 autumn quarter, andhow their achievement was related topsychological type. The students werefreshmen who were administered the MBTIduring the 1983 summer orientation program,and for whom Scholastic Aptitude Testscores were available. Their type distributions appear below.Academic achievement was assessedthrough the grades earned in most coursesthat would meet these students' generalstudies requirements. Both an average grade(GEN) and the grades in different subjectmatter areas were examined. Grades in thesubject matter areas were studied becausethe MBTI theory suggests that certain personality characteristics might be related tosuccess in some areas, while othercharacteristics might be related to successin other areas. Additionally, course difficultywas considered because the influence of theMBTI characteristics might be more or lessprevalent for courses varying in difficulty.Student gender (SEX) and high schoolgraduating class percentile (HSPER), as wellas the Scholastic Aptitude Test verbal (VER)and mathematics (MATH) scores, were usedin the project. These variables were includedfor three purposes. First; VER, MATH, andHSPER were needed as control variables inorder to assess whether the M BTl providedinformation about student achievementbeyond that provided by their past achievement. Secondly, the relationships betweenthe MBTI characteristics and VER, MATH,and HSPER were of interest. If there is a relationship between personality and achievement, it already would have been manifestedin different types of students' VER andMATH scores and their past academic performance (HSPER). The question about a causeand effect relationship between personalityand achievement is unanswerable, but itseems more likely that personality causesachievement, rather than that achievementcauses personality-perhaps, a nonrecursive relationship would be tenable.Thirdly, the relationships between VER,MATH and HSPER, as well as SEX, andachievement in different areas were of interest. SEX was considered because thepsychological literature indicates there aremany differences between the psychologicalcharacteristics of males and females: Important for this study is the finding that femalesusually demonstrate higher academicachievement than males.Interest in administering the MBTI to thefreshmen stemmed from two sources. Muchhas been written that purports that MBTItypes react differently to (a) formal education, (b) different instructional procedures,and (c) study in different content areas(Myers, 1980). Secondly, research (Nisbet,Ruble, & Schurr, 1982b), as well as practicalexperience (Nisbet, Ruble, & Schurr, 1982a),have indicated that the MBTI can yieldpredictive information about the academicachievement of academically high-riskstudents. Additionally, the MBTIcharacteristics were found to be associatedwith introductory English compositiongrades of a heterogeneous group of students(Schurr, Houlette, & Ellen, 1986).Journal of Psychological Type, Volume 12, 1986Page 25
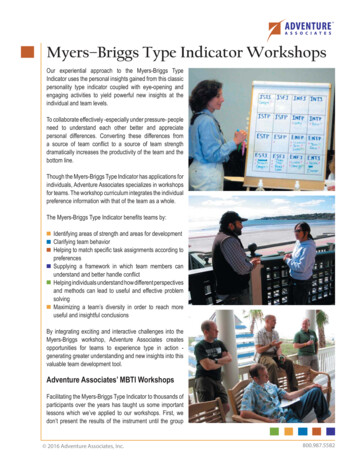
Ball State University Entering Freshmen:All Students (Males and Females)N 27131 1% of NISTJISFJINFJINTJn 262n 239n 82n all State University Entering Freshmen:MalesN 1160I 1% of NISTJn 155(13.4%)111111111IIIISFJINFJn 78n 26n TPISTPISFPINFPINTPn 78n 82n 101n 91n 52n 34n 42n PESFPENFPENTPn 161n 125n 232n 201n 96n 36n 75n 11II(8.3%)11111III(3.1%)III(6.5%)11111II(10.1 %)1111111111ESTJESFJENFJENTJESTJESFJENFJENTJn 35n 69(5.9%)11111n 320n 362n 193n 130n 161n 81(11.8%)1111111111II(13.3%)1111111111III(7.1 11II(3.0%)IIIEI63%SN60% %TFJP %EI % %SN00% % %TFIJ24%IP13%EP 26%EJ 37%IJ25%IP17%EP 28%EJ 30%ST 30%SF 30%NF 22%NT 14%ST 40%SF 20%NF 15%NT 25%SJ 44%SP 16%NP 18%NJ 17%SJ 41 %SP 19%NP 26%NJ 14%TJ 29%TP 20%FP 20%FJ 32%TJ 36%TP 26%FP 16%FJ 19%IN 13%EN 27%IS24%ES 35%IN 15%EN 26%IS28%ES 32%ET 30%EF 34%IF19%ITET 38%EF 20%IF15%IT48% %61 %18%Analyses. A five categorical variable regression model, in which the interactions wereexamined, was used to assess the relationships of the MBTI and SEX with GEN, VER,MATH, and HSPER. A five categoricalvariable model which included VER, MATHand HSPER was used to assess whether thePage 26 Journal of Psychological Type % %JP % %27%MBTI and SEX provided information aboutstudent achievement beyond that providedby their past achievement (VER, MATH,HSPER). Appropriate combinations of theSoN, T-F, and J-P scales were formed in thelatter analyses to reflect the four SP, SJ, NT,and NF temperaments described by Keirsey
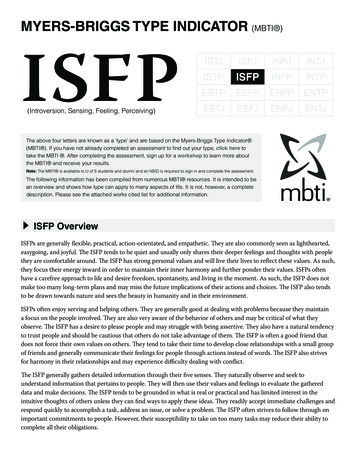
Ball State University Entering Freshmen:FemalesN 1553I 1 % of NISTJISFJINFJINTJn 107n 161n 56n ISTPISFPINFPINTPn 26n 48n 59n 22(1.7%)II(3.1 %)III(3.8%)(1.4%)I1111ESTPESFPENFPENTPn 55n 89n 157n 84(3.5%)(5.7%)(10.1 %)(5.4%)111111111111111111111111IESTJESFJENFJENTJn 159n 281n 158n 61(10.2%)(18.1 1111IIIEI % %SNM% %TF % %IJ23%IP10%EP 25%EJ 42%ST 22%SF 37%NF 28%NT 13%SJ 46%SP 14%NP 21 %NJ 20%TJ 23%TP 12%FP 23%FJ 42%IN 11%EN 30%IS22%ES 38%ET 23%EF 44%IF21 %ITJP % %12%and Bates (1978) and used by many researchers in education, including those atBall State.A regression model that reflected thesystematic GEN variation attributable toVER, MATH, HSPER, the MBTI, and SEX wasused to determine if characteristicsassociated with achievement in particularsubject matter areas varied from thoseassociated with the overall achievement(GEN). The model was constructed so that interactions could be interpreted in simpleterms (or "simple effects"). It was necessaryto rescale the GEN regression model according to the standard deviation of each subjectmatter area because the variability of thegrades in the areas differed, and because thegrade variability in all areas was larger thanthe variability for the average grades. Areadifficulty was determined by the differencebetween the GEN mean and the area meanafter the latter was adjusted for thecharacteristics of the students enrolled inthe subject matter area courses.ResultsGEN, VER, MATH, HSPER with MBTI andSEX. GEN, VER, MATH, and HSPER meansfor both the males and females of the 16MBTI types are contained in Table 1. Mostnotable in the variability among the MBTItype GEN means are the high means of theI NTJ and IN FJ types (2.79 and 2.79) and thelow means of the opposite ESTP and ESFPtypes (2.12 and 2.07). When SEX is considered, the GEN means range from a low of1.94 for ESFP males to a high of 3.08 for INTJfemales. Female means were higher thanmale means for most of the MBTI groups.A casual inspection of the VER, MATH,and HSPER means reveals considerablevariability for the MBTI types and SEX, andthat some of this variability corresponds tothe variability in the GEN means. This correspondence is partially revealed in Table 2which summarizes the major sources (p .01)of the variability among the GEN, VER,MATH, and HSPER means for the separateM BTl scales and for SEX.The data in Table 2 indicate that: (1) thefemale performance exceeded the male performance for both the GEN and HSPERachievement measures, but not for the standardized test VER and MATH aptitudeachievement measures; (b) the performanceof the Js exceeded the performance of the Psfor the achievement and GEN and HSPERmeasures, but not for the standardized VERJournal of Psychological TypePage 27
Table 1. Total Group, Male and Female of Means of the First YearGeneral Studies Courses Grades (GEN), the Scholastic Aptitude Verbal (VER)and Mathematics (MATH) Scores, and High School Graduating Class Percentiles (HSPER)for the 16 MBTI SPERFTotal M F2713 1160 15532.37 2.33 2.4240.4 40.4 40.343.9 45.7 41.0.66 .59 .711STJ262 155 1072.48 2.44 2.5338.6 38.9 38.143.5 44.3 42.2.67 .61 .75ISFJ23978 1612.55 2.51 2.5739.7 38.3 40.444.846.943.7.72 .65 .76INFJ8226562.792.792.8047.045.642.748.450.1 47.6.77 .70 .80INTJ6434302.79 2.56 3.0845.7 44.1 47.548.1 49.0 47.1.73 .65 .82ISTP7852262.162.042.3838.738.239.643.245.1 39.5.61 .55 69 .66 .72INFP10142592.61 2.65 2.5845.6 45.4 45.746.8 48.2 45.9.70 .68 .72INTP9169222.332.21 2.7046.045.1 48.748.349.046.2.62 .57 .77ESTP15196552.122.092.1837.4 36.4 39.241.242.339.2.57 .53 .64ESFP12536892.07 1.942.1338.1 37.538.341.542.541.1.61 .52 .65EN FP23275 1572.28 2.34 2.2643.3 44.9 42.544.5 49.4 42.2.64 .60 .66ENTP201 117842.32 2.27 2.3943.1 42.5 44.046.1 47.1 44.9.61 .55 .68ESTJ320 161 1592.31 2.23 2.3837.3 37.6 37.042.2 43.7 40.6.64 .57 .71ESFJ36281 2812.28 2.28 2.2837.0 38.0 36.740.9 43.1 40.3.66 .56 .68ENFJ19335 1582.51 2.482.5242.842.4 42.944.5 45.5 44.3.71 .66 .73ENTJ130692.50 2.63 2.6742.5 42.2 42.945.7 46.9 44.3.66 .59 .74All61aSAT verbal and mathematics scores are reported with only the two leading digits, e.g., aVERscore of 450 is reported as 45.and MATH measures; (c) the performance ofthe Is exceeded the performance of the Es,and the performance of the Ns exceeded theperformance of the Ss, for all four measures;and (d) the T-F scale provided significant information only for males, and only for theGEN and HSPER achievement measures.One clear conclusion from these data is thatEs and Ss were apparently least prepared forPage 28Journal of Psychological Typecollege achievement, while Is and Ns wereapparently best prepared; that is, Is exceeded Es, and Ns exceeded Ss, with respect tothe means of all three of the traditional VER,MATH, and HSPER predictors of collegeachievement. Additionally, the J-P scale andSEX were more related to actual academicperformance, GEN and HSPER, than toscores obtained on the VER and MATH tests.
Table 2. Major Sources of Variability on theGEN, VER, MATH, and HSPER Meansfor the MBTI Scales and SEX.VERaMATHaHSPERaFemales (42.6)Males (45.7)Females (.71)Males (.59)VariableGENaSEXFemales (2.42)Males (2.31)J-PJs (2.45)Ps (2.26)E-IIs (2.50)Es (2.30)Is (41.5)Es (39.8)Is (45.3)Es (43.1)Is (.69)Es (.64)SoNNs (2.46)Ss (2.32)Ns (43.9)Ss (38.0)Ns (46.0)Ss (42.5)Ns (.68)Ss (.64)T-FMale F (2.38)Male T (2.27)(No differencefor Females.)Js (.68)Ps (.63)Male F (.62)Male T (.56)(No differencefor Females.)aMeans are shown in parentheses. Data have been treated as in Table 1.In fact, if the J-P scale was examined by itselfinstead of in conjunction with the otherscales, the VER mean of the Ps was higherthan the mean of the Js.Relationship Between GEN and VER, MATH,HSPER, the MBTI, and SEX. A breakdown ofthe deviations of the GEN means from theoverall GEN mean (GENDEV) for the 16 maleand female MBTI types is shown in Table 3.The 16 types are grouped by combinations ofE-I and SoN: ES, IS, EN, and IN. These groupings reflect the variation in the academicpreparation of the different MBTI groups,where the ES students were least wellprepared and the IN students were bestprepared.The unique portions (identified throughregression analyses) of the GENDEV variation that could be attributed to the VER andMATH scores (SAT), HSPER, and the MBTIcharacteristics (PER) also are shown in Table3. The SAT portion was a computed sum froma VER weight of .017 and a MATH weight of.016; the standardized weights were .192 and.210, respectively. The HSPER weight was1.268, a standardized weight of .367. Thesestandardized weights indicate that the unique contributions of MATH and VER inpredicting GEN were nearly equal, while theunique contribution of HSPER wassomewhat larger.The values for PER reflect the unique contributions due to the MBTI characteristicsthat could not be attributed to VER, MATH,and HSPER. Statistically significant contributions of the MBTI characteristics in accounting for GEN were (a) among the ES, IS,EN, and IN groups (F (3, 2697) 3.49, p . 01)and (b) between the Js and Ps for each of thefour groups: ES (t 3.10, p . OO ), IS (t 5.23p . OO ), EN (t 3.21, p . OO ) and IN(t 2.82, p . OO ). All four the J-P differences indicated that the Js achieved morethan the Ps, but the J-P difference was largerfor the IS group than for the other threegroups (t 2.11, p . 04). Unquestionably, themost consistent difference in achievementwas between the Js and Ps.Differences between the Ts and Fs alsowere included in computing the PER values.The difference between the Ts and Fs wasneither significant for the total group norsignificant for any of the ES, IS, EN, or INgroups. However, Ts tended to achieve morethan the Fs for the ES, IS, and EN groups, butless than the Fs for the IN group (t -2.23,p . 03). This difference, in conjunction withthe Keirsey and Bates assertion about thedifferential achievement of Ts and Fs in dif- Journal of Psychological Type Page 29
Table 3. Deviations of GEN from the Overall Mean (GENDEV) and the Portionsof the Deviations Attributable to VER, MATH, (ACH),HSPER and the MBTI (PER)TypeGENDEVbMale8ACHSAT HSPERPERGENDEVbFemale8ACHSAT 80068344422181819122114180809-091801ferent subject matter areas, made it advisable to retain the T-F scale when achievement in the different subject matter areaswas examined.The data from Table 3 are summarized inTable 4. Essentially, this summary confirmswhat would be expected from the Simplecomparisons of the means that were shownin Table 2.1. Females achieved more than males, andmost of this difference could be predictedfrom females achieving more in high schoolthan males; that is, differences in SAT scoresand/or MBTI characteristics were not factorsin their differential achievement.2. The largest portion of the variation in theachievement of the ES, IS, EN, and IN groupscould be attributed to corresponding differences in these groups' SAT and HSPERscores. The SoN difference was the majorMBTI characteristic associated with the SATaccounting for the differences in achievement, while the E-I difference was the majorMBTI characteristic associated with HSPERaccounting for the differences in achievement. The difference in the HSPER of the Esand Is was particularly interesting, as the IsPage 30Journal of Psychological Typealso achieved more than Es in college, evenafter their difference in the HSPER was considered. That is, whatever behaviors of the Isthat led to their superior performance in highschool also led to a superior performance incollege.3. The largest independent contribution(magnitude of an achievement difference) ofan MBTI characteristic in accounting for college achievement was due to Js achievingmore than Ps. Js also achieved more than Psin high school, but the SAT scores were nothigher for the Js than the Ps. Thus, as it wasobserved for the superior college performance of the Is, whatever behaviors of the Jsthat led to their superior high school performance also led to a superior performance incollege. However, a difference between thecontributions of the E-I and J-Pcharacteristics (other than their relativemagnitudes) is that the SAT scores of the Iswere higher than the Es, while the SATscores of the Js were not higher than the Ps.Therefore, it appears that the J-P scale is indicative of the personality characteristic thatis most uniquely associated with college instructors' evaluation of achievement.
Table 4. Summary of the SAT (VER and MATH) HSPER, and PER (MBTI)Influences on the Overall Achievement 127350005E-I/S-N:J-P, 103-04170608IN1817130009aValues have been rounded to two places and multiplied by 100.4. There were no consistent differences forthe comparison of the Ts and Fs on either theSAT or HSPER. As previously noted, the Fstended to achieve more than the Ts for theacademically best prepared IN group, whileTs tended to achieve more than Fs for theother three groups.Overall, these data indicate that combinations of the E-I and SoN scales (ES, IS, EN,and IN) were the MBTI characteristics thatwere most associated with achievement thatcould be predicted from the SAT and HSPER,while combinations of the E-I and J-P scales(EP, IP, EJ, and IJ) were the MBTIcharacteristics that were most associatedwith achievement that could not bepredicted from the SAT and HSPER. On theaverage, IJs achieved about .11 greater thanwhat would be expected from the SAT andHSPER, and the EPs achieved about .11 lessJournal of Psychological TypePage 31
than expected.The difference of .22 in the achievement ofthe IJs and EPs ( .11 versus -.11) corresponds to a difference of about 130 pOintson SAT scores (where the theoretical mean is500 with a standard deviation of 100) oneither the VER or MATH tests, or to a difference in HSPER of about 18 percentilepoints. Of course, such a difference on onemeasure and not the other two measureswould be unlikely because of the positivecorrelations among VER, MATH, and HSPER.The .22 difference in the achievement of theIJs and EPs more reasonably corresponds todifferences of about one-half of a standarddeviation on all three measures: 40 points onthe VER and MATH tests, and 10 percentilepoints on HSPER.Finding the IJ achievement to be thehighest and the EP achievement to be thelowest (after controlling for VER, MATH, andHSPER) is not surprising. Essentially, thefinding concurs with the common sense notion that students who live in a planned,systematic manner and who relate easily tothe inner world of ideas (and perhaps, areless distracted by others) achieve more thanstudents who live in a spontaneous mannerand who relate better to (and enjoy) interacting with others. However, it is enlightening that the MBTI identifies thesecharacteristics, particularly after the othermajor contributors to (or predictors of)achievement have been controlled.It might be inappropriate to extend the interpretation of the data beyond what hasalready been summarized, but there was oneinteresting trend that should be noted for theTs and Fs. The tendency of the Fs to achievemore than the Ts for the INs, as opposed toTs achieving more than Fs for the other threegroups, was due mostly to the males. Essentially, the male INTs, and particularly themale INTPs, had the SAT scores to predictabove average achievement in both highschool and college, but relative to the scoresthese males did not achieve well in either.This suggests that there may be an incongruence between the male INT personality and the formal education process, whichmay indicate that these males represent apotentially underdeveloped studentresource. The variety of subject matter areasand instructional methods involved in thegeneral studies program precludes a definition of "formal education," but the descripPage 32Journal of Psychological Typetions of the 16 types (Myers, 1980) suggestwhy the INT males might not do as well asthe INF males: INTs are skeptical and independent, and they have sharply defined interests, while the INFs, who are equallybright, are full of enthusiasm and put theirbest efforts into their work. SUCCinctlystated, both the male INTs and INFs shouldexperience little difficulty in courses; but theINTs may do very well only in areas that interest them, while the INFs may do well in agreater number of different areas.Subject Matter Areas. The analysis of thesubject areas determined if the (a) VER,MATH, and HSPER regression weights, and(b) differences attributable to the J-P and T-Fscales, SEX, and ES, IS, EN, and IN groupings that were obtained in the analysis ofGEN, could account for the relationships ofthese variables with achievement in the individual subject areas. The courses used inthe subject areas are shown in Table 5. Themean grade of the courses included in anarea was used as the indicator of achievement. While there were several differencesdue to SEX and MBTI characteristics, differences in the VER, MATH, and HSPERweights accounted for the most variabilityamong the areas.SEX and MBTI Characteristics There wereseven subject areas in which there was a difference between the achievement of malesand females. After controlling for VER,MATH, and HSPER, the males achieved morein business (BUS), biology (BIO), astronomyphysics (ASTPHY), political science (POLS),and history (HIST) courses, while femalesachieved more in the English (ENG) andphilosophy-religion (PHILREL) courses.These differences appear to conform to thegender vocational stereotypes, where malesare relatively more represented in practical,concrete and/or scientific vocations, whilefemales are more represented in aesthetictype vocations.There were four subject areas in which therelationship between achievement and theES, IS, EN, and IN groupings differed fromthe relationship that was observed for GEN.In interpreting these data, as well as assessing possible trends that included other areas,the focus was the relative achievement of theESs and the INs; these represented, respectively, students who apparently were least
well prepared for academic achievement andstudents who apparently were best prepared.The ESs did relatively better than the INs inthe (a) music, art, and theatre history (ARTS),(b) business (BUS), and (c) economics(ECON) courses, while the INs did relativelybetter in the anthropology (ANTH) courses. Apossible implication of these findings is thatESs may experience more success incourses that are more factual, practical, concrete and/or applied than in courses that areabstract and theoretical, while the reversemight be true for the INs. Support for such aninterpretation was provided by the tendencyof the ESs to do relatively better in thespeech and journalism (COM) and thepolitical science (POLS) courses, while INsdid relatively better in the astronomy-physics(ASTPHY), psychological science (PSY),biology (BIO), and natural resources (NR)courses.There were three subject areas in whichthe differences between the Js and Ps variedfrom the relationships that were observed forGEN: the classical culture (CC), history(HIST), and mathematics (MATH) courses.However, Ps achieved more than Js for onlythe (a) ESs in the mathematics courses, (b)INs in the classical culture courses, and (c)ENs and INs in the history courses. In addition to these four differences that favored thePs, there were only four of the remaining 68J-P comparisons that favored the Ps. Thus,although many of the differences were quitesmall, the finding for GEN in which Js achieved more than the Ps was very consistent forthe different subject areas.Astronomy-physics (ASTPHY) was the onlysubject area in which the relationship for theT-F scale differed from those observed forGEN: Ts achieved more than the Fs for theISs and INs. Additionally, there were no apparent trends in that data with regard to theT-F scale. Thus, in conjunction with findingonly non-significant relationships betweenthe T-F scale and GEN, it appears that the T-Fpreference is not an important function instudents' achievement-at least, not inthose survey type courses that are found inthe general studies curriculum.Course Difficulty and Correlations. The sub-ject area difficulty (deviation of the subjectarea mean from the GEN), and the VER,MATH, and HSPER correlations and standardized regression weights are shown inTable 5. The order of presentation of theareas, from top to bottom, reflects the uniqueverbal (VER) and quantitative (MATH) aptitude that might be inherent to achieving inthe areas. The uniqueness is indicated by therelative magnitudes of the standardized VERand MATH weights. In the extreme cases forPHILREL and MATHGRD, VER containsunique information about the PHILRELachievement (.23), while MATH containsunique information about achievement inmathematics courses (.43). Negative andsmall positive weights should not be interpreted as indicating either a negative relationship or a trivial, positive relationship.Clearly, the simple correlations indicatemoderate positive relationships of VER,MATH, and HSPER with achievement in allareas. The regression weights indicate aunique characteristic beyond the commonaptitude-achievement component whichunderlies the scores on all three of the VER,MATH, and HSPER measures.Some observations about the data contained in Table 5 are as follows:1. Too much reliance on the VER score-as apredictor of students' achievement mayneglect other readily available informationabout a student's academic potential. Whilethe VER simple correlations are larger thanthe MATH correlations in certain areas(PHILREL through ANT H), there is virtuallyno difference in other areas (COM throughCC), and in some areas VER is not as good apredictor as MATH (GEO through MATH). Infact, VER does not predict GEN as well asMATH (.46 versus .49). Additionally, HSPERwas a better predictor than VER in 13 of the18 subject areas that are listed.2. HSPER, which is sometimes treated assupplementary information about a student,is the most consistent predictor of thestudent's achievement. In 12 of the 18 subject areas, the HSPER correlation equalled orwas larger than both of the VER and MATHcorrelations. In 14 of the areas, the HSPERregression weight was larger than the VERand MATH weights. There also was lessvariation among the HSPER weights thanamong either the VER or MATH weights.Thus, independent of the common aptitudeachievement component underlying the VER,MATH, and HSPER scores and the uniqueVER and MATH components, HSPER provides additional information about theachievement of students. A cognitiveJournal of Psychological TypePage 33
Table 5. Subject Matter Area Difficulties, Correlations,Regression Weights, and Coursesa .VERDeviationsof 01940aValues have been rounded to two decimal places and multiplied by 100.bMultiple correlation coefficients.cThese values were computed without consideration of SEX and the MBTI.psychologist might interpret HSPER as being an indicator of motivation, of whichachievement has been and will be an outcome. A behavioral psychologist might interpret the result for HSPER as meaning thatthe best predictor of future behavior is thepast behavior. Certainly, a degree ofbackground knowledge in an area is required,but HSPER generally adds to that measure ofknowledge in predicting subsequentachievement.3. There were no consistent trends in thedata regarding subject area difficulties, but itis quite -clear that there was considerablevariation in the difficulty of the subject areas.However, an interesting question is why thePage 34Journal of Psychological Typethree areas associated with the most uniqueMATH aptitude (BUS, ECON, and MATHGRD)were also the three most difficult areas. Conversely, three of the four areas associatedwith the most unique VER aptitude(PHILREL, HSC, and ARTS) were among theleast difficult areas.Ideally, data such as presented in thisreport might be used to advise studentsregarding individual courses and majors.However, while it is important for individualsworking with students to be aware of thereported trends, there is sufficient "noise" inthe data to advise one to use the datajudiciously. Additionally, certain results arenearly paradoxical. For example, ESs are less
well prepared academically, but relative toother courses they do well in businesscourses, which happen to be among themost difficult courses-that is, they may dorelatively well but still obtain a low grade.One source of the "noise" is that differences in factors such as class size, instructional methods, and instructor gradingsurely influenced the results. A secondsource is that there was considerablevariability in the results for sections of thesame course-for example, averagegrades-as well as among courses that weregrouped into subject areas. Thirdly, resultsfor subject areas might be different incourses for majors than they were in thesurvey courses. But, even in light of this"noise," there were conceptually meaningfultrends that have practical implications. Forexample we would not advise a low-VER, ESP (Extraverted, Sensing, Perceiving) studentto take both PSY and ANTH during the samequarter. At the other extreme, we would notoverload even the best academicallyprepared student-for example, enrolling ahigh-MATH INJ (Introverted, Intuitive, Judging) student in the three most difficultcourses, MATH, ECON, and BUS.DiscussionSome cautions must be expres
The Myers-Briggs Type Indicator and First-Year College Achievement: A Look Beyond Aptitude Test Results K. Terry Schurr Virgil E. Ruble Ball State University A thorough study of an entire entering col/ege class shows that Is and Ns tend to have both higher