Transcription
1URBAN EDUCATIONEDUCATION INSTITUTEINSTITUTEURBANHELPING YOUTH REALIZE THEIR COLLEGE DREAMS:AN IMPACT STUDY OF THE SAN ANTONIO AREA FOUNDATION’SSCHOLARSHIP PROGRAMBy Dr. Michael U. Villarreal and Dr. Han Bum LeeNovemberApril 2021 2020
2ABOUT THEURBAN EDUCATION INSTITUTEOUR MISSIONThe Urban Education Institute at The University of Texas at San Antonio producesimprovement-focused, collaborative research to raise educational attainment, advanceeconomic mobility, and help people achieve their potential in the Greater San Antonioregion.The Institute pursues its mission by (1) producing rigorous and actionable analysis thatsupports education policymaking, program implementation, and philanthropic giving;(2) convening community leaders to address entrenched challenges that harm educationand human development; and (3) training the next generation of social scientists andeducators to address education challenges through observation, analysis, and discovery.
3TABLE OF CONTENTSEXECUTIVE SUMMARY7KEY FINDINGS9RECOMMENDATIONS10POLICY RECOMMENDATIONS12INTRODUCTION13SAAF SCHOLARSHIP PROGRAM14EXISTING LITERATURE16METHODOLOGY19STUDY SAMPLE25RESULTS29REFERENCES46APPENDIX A48APPENDIX B50APPENDIX C52
4LIST OF EXHIBITSTABLE 1Descriptive Statistics Of Awardees’ Characteristics And Postsecondary Outcomes27FIGURE 1Distribution of Scholarship Recipients By High School That Had 5 or More Awardees28FIGURE 2Average Percent Of Students Who Enrolled In A Four-Year College Instead Of A Two-30year College By Treatment StatusFIGURE 3Scholarship Effect, Expressed As A Growth Rate, On Four-Year College Enrollment31Instead Of A Two-Year College Enrollment By Student SubgroupsFIGURE 4Average Percent of Four-Year College Enrollees Who Earned A Bachelor’s Degree32Within Four Years By Treatment StatusFIGURE 5Scholarship Effect, Expressed As A Growth Rate, On Bachelor’s Degree Attainment33Within Four Years Of Four-Year College Enrollment By Student SubgroupsFIGURE 6Average Percent Of Four-Year College Enrollees Who Earned A Bachelor’s Degree34Within Five Years By Treatment StatusFIGURE 7Scholarship Effect, Expressed As A Growth Rate, On Bachelor’s Degree Attainment35Within Five Years Of Four-Year College Enrollment By Student SubgroupsFIGURE 8Average Percent Of Two-Year College Enrollees Who Earned An Associate Degree36Within Two Years By Treatment StatusFIGURE 9Average Percent Of Two-Year College Enrollees Who Earned An Associate Degree38Within Three Years By Treatment StatusFIGURE 10Average Student Debt Acquired In First Four Years Of College By Four-Year CollegeStudents By Treatment Status40
5FIGURE 11Scholarship Effect, Expressed As A Growth Rate, On Average Student Debt Acquired In41First Four Years Of College By Four-Year College Student SubgroupsFIGURE 12Average Number Of Quarters Worked By Four-Year College Students During The First42Four Years Of College By Treatment StatusFIGURE 13Average Total Income Earned By Four-Year College Students During The First Four44Years Of College By Treatment StatusTABLE 2Description Of Awardees By Scholarship Program48TABLE 3Estimated Average Treatment Effect Of Receiving Scholarship On The Treated By52Student OutcomeTABLE 4Descriptive Statistics Of Foundation Scholarship Recipients And Comparison53Group Before Matching Process Is Conducted For The Analysis Of Four-Year CollegeEnrollmentTABLE 5Quality Indicators Of PSM For The Impact Analysis Of Four-Year College Enrollment54TABLE 6Descriptive Statistics Of Foundation Scholarship Recipients And Comparison55Group Before Matching Process Is Conducted For The Analysis Of Bachelor’s DegreeCompletion Within Four Years By Four-Year College EnrolleesTABLE 7Quality Indicators Of PSM For The Analysis Of Bachelor’s Degree Completion Within56Four Years By Four-Year College EnrolleesTABLE 8Descriptive Statistics Of Foundation Scholarship Recipients And ComparisonGroup Before Matching Process Is Conducted For The Analysis Of Bachelor’s DegreeCompletion Within Five Years By Four-Year College Enrollees57
6TABLE 9TABLE 10Quality Indicators Of PSM For The Analysis Of Bachelor’s Degree Completion WithinFive Years By Four-Year College EnrolleesDescriptive Statistics Of Foundation Scholarship Recipients And ComparisonGroup Before Matching Process Is Conducted For The Analysis Of Associate Degree5859Completion Within Two Years By Two-Year College EnrolleesTABLE 11TABLE 12Quality Indicators Of PSM For The Analysis Of Associate Degree Completion WithinTwo Years By Two-Year College EnrolleesDescriptive Statistics Of Foundation Scholarship Recipients And ComparisonGroup Before Matching Process Is Conducted For The Analysis Of Associate Degree6061Completion Within Three Years By Two-Year College EnrolleesTABLE 13TABLE 14Quality Indicators Of PSM For The Analysis Of Associate Degree Completion WithinThree Years By Two-Year College EnrolleesDescriptive Statistics Of Foundation Scholarship Recipients And Comparison GroupBefore Matching Process Is Conducted For The Analysis Of Student Debt Acquired6263During First Four Years Of College By Four-Year College EnrolleesTABLE 15Quality Indicators Of PSM For The Analysis Of Student Debt Acquired During FirstFour Years Of College By Four-Year College Enrollees64
7EXECUTIVE SUMMARYThe San Antonio Area Foundation is the city’s community-givingheadquarters. The non-profit was established almost 60 years ago toconnect donors to causes they care about. In addition to distributinggrants from permanent charitable endowments to qualifying groups,the Area Foundation also distributes higher education scholarships.Since its first scholarship award in 1969, the organization has given over 37 million to college-going students from more than 100 scholarshipfunds to help them achieve their educational dreams.The Area Foundation engaged the Urban Education Institute (UEI)at The University of Texas at San Antonio (UTSA) to evaluate theeffectiveness of its higher education scholarship program. A primaryobjective was to measure the effect the program had on collegeenrollment and degree completion. Another purpose was to gauge itspotential impact on lowering student debt and reducing the need towork while in college – two barriers to success commonly experiencedby students pursuing higher education.The UEI found meaningful and statistically significant evidencethat the Area Foundation’s scholarship program helped studentsachieve college success. In this study, researchers used a longitudinal,explanatory, nonexperimental research design that compared
8693 scholarship awardees to their high school peers with similardemographic, socioeconomic characteristics, and prior educationalachievement experiences.Researchers found that those receiving an Area Foundation scholarshipwere more likely to enroll in a four-year college over a two-year college.The award increased the probability of a student enrolling in a fouryear college over a two-year college by 11.8 percentage points.A Foundation scholarship also helped students graduate from fouryear colleges on time at higher rates than their peers, according tothe study. The award improved the probability of a student earning abachelor’s degree in four years for students who entered a four-yearcollege by 19.5 percentage points.Furthermore, receiving an Area Foundation scholarship decreasedloan debt by an average of 4,508 for students who attended four yearsof a four-year college.While positive effects were found for those who enrolled in a fouryear college, which accounted for 86% of scholarship recipients,no statistically significant effects were found for two-year collegestudents.Finally, receiving an Area Foundation scholarship did not change thetotal wages students earned while in college, nor did it impact theirprobability of working during that time.
99KEY FINDINGSStudents receiving an Area Foundation scholarship were more likelyto enroll in a four-year college over a two-year college. Receiving anaward increased the probability of enrolling in a four-year college overtwo-year college by 11.8 percentage points.An Area Foundation scholarship increased the likelihood of studentsearning bachelor’s degrees within four years. Receiving a scholarshipincreased the probability of earning a bachelor’s degree in four yearsby 19.5 percentage points.Receiving a scholarship did not change the probability of earning anassociate degree within two or three years of college entry. Four-year college students with an Area Foundation scholarshipexperienced decreased college loan debt by 4,508 on average after fouryears of college.Receiving a scholarship did not change the total wages students earnedwhile in college, nor did it impact their probability of working duringthat time.
1010RECOMMENDATIONSThe Area Foundation should continue growing its scholarship program basedon its history of effectiveness. However, to strengthen its impact, it shouldmove funding where it is making the greatest difference. Based on the findingsof this study, this would mean prioritizing four-year college scholarships overtwo-year college scholarships and prioritizing students with more financialneed over those with less financial need.While two-year college students are more likely to be economicallydisadvantaged than four-year college students, their needs are also morelikely to exceed the cost of college tuition and include child care, housing,food security, and other basic needs (Goldrick-Rab, S. (2018). Consequently, ifthe Area Foundation is intent on helping two-year college students completecollege, an intervention focused on the unique needs of this population willlikely prove more effective.
11The Area Foundation should also review how its scholarship dollars are tied toacademic readiness and progress standards. For example, consideration shouldbe given to differentiating initial award sizes based on the completion of earlycollege coursework (i.e., dual credit or Advanced Placement or InternationalBaccalaureate course credit) in high school. If this strategy is taken, studentsshould be informed no later than ninth grade so they will have time to respondto the incentive. There also may be opportunities to introduce financialincentives to encourage awardees to enroll in and complete a full load of collegecourses each semester or participate in a summer internship aligned withtheir professional goals. Existing research supports these recommendationsas long as the administrative costs of complying to the standards remain low(Dynarski and Scott-Clayton, 2013).The Area Foundation should also consider ways to enhance the psychologicalbenefits of receiving a scholarship. Existing research has found that studentswho receive public recognition as scholars experience a psychological benefit(e.g., improved self-confidence and self-efficacy, or improved self-identify as acollege student) that increases their likelihood of college success (Thistlewaiteand Campbell, 1960). For example, if not done already, the Area Foundationcould publicly recognize awardees in the newspaper, at San Antonio Spursgames, or at other public events.Finally, more investigation needs to be done into why all eligible students donot take advantage of the Area Foundation’s scholarship program. Based on thefindings of this study, high schools in Bexar County are not equally representedamong scholarship awardees. More research should be done into the reasonsbehind this in order to expand access and ensure equity.
1212POLICY RECOMMENDATIONSPrioritize four-year college scholarships over two-year collegescholarships. Prioritize students with financial need.Tie academic readiness and progress standards to scholarship dollarswhere none exist.Enhance the public recognition of receiving an Area Foundationscholarship.Investigate why eligible students do not take advantage of thescholarship program.
13INTRODUCTIONIn November of 2018, the San Antonio Area Foundation hired theUrban Education Institute (UEI) at The University of Texas atSan Antonio to perform an impact study of its higher educationscholarship program. The Area Foundation’s primary concernwas on evaluating the effects its scholarship program had onimproving student awardees’ college persistence and degreecompletion. The organization was also interested in learning abouttheir scholarships’ potential impact on lowering college debt andreducing students’ need to work while in college.To complete this evaluation, the UEI worked with the AreaFoundation to gather its data on scholarship recipients. Initially,the UEI attempted unsuccessfully to collect this information fromcolleges and universities of scholarship recipients. Ultimately,Area Foundation staffers gathered enough personally identifiableinformation on scholarship recipients so that the UEI was ableto link 86% of awardees to their secondary and postsecondaryeducation records. But for the effort made by the staff at the AreaFoundation, this study would not have been possible.
1414SAN ANTONIO AREA FOUNDATIONSCHOLARSHIP PROGRAMThe Area Foundation has been facilitating the creation and administrationof scholarship funds since 1969. According to its website, the organizationhas more than 100 scholarship funds available for graduating high schoolstudents and current college students. The UEI study sample analyzed 83constituent scholarship funds, serving approximately 1,000 students. Thefunds that supported the largest share of recipients included the WhataburgerFamily Foundation Scholarship Fund (17.8%), the Kym’s Kids Scholarship Fund(15.46%), the Anna, Pierre, and Ephraim Block Scholarship Fund (8.19%), theHarvey E. Najim Family Foundation Scholarship Fund (5.83%), and the PatriciaL. Hartman & Lois C. Hartman Scholarship Fund (5.02%).The scholarship fund programs varied in their program design, withdifferences in factors such as eligibility standards and levels of financialsupport. The size of initial Area Foundation scholarships varied greatly witha median, mean, and standard deviation (SD) of 6,000, 7,113 and 5,839,respectively.
15In Appendix A, researchers report the academic, demographic, andsocioeconomic background of scholarship recipients by scholarship programthat provided awards to at least 20 students in the study sample. Also presentedare the aggregated descriptive statistics for all other scholarship programswith less than 20 awardees.
1616EXISTING LITERATUREThe Area Foundation has chosen to focus on improving educational attainmentrates in the Greater San Antonio community by facilitating the creation andadministration of scholarship funds. This strategy is supported by a large bodyof existing research.Existing empirical research has found that grant aid improves collegedegree completion rates. With adequate financing, students are less likely tojuggle work and school and more likely to engage in their coursework andextracurricular activities. Grant aid has also been found to improve longerterm outcomes such as graduate education, reduced debt, homeownership,and future earnings (Bettinger, 2004; Bettinger et al., 2016; Curs & Harper, 2012;DesJardins, McCall, Ott, & Kim, 2010; DesJardins & McCall, 2010; Dynarski, 2002;Deming & Dynarski, 2009).In 2018, researchers performed a meta-analysis of studies that examinedthe effects of scholarship aid on college students’ persistence and degree
17completion. Based on the 43 studies included in this meta-analysis, researchersfound that receipt of student financial aid (average grant size was 2,697)increased persistence by 2 percentage points and degree completion by 3percentage points. Findings also showed that an additional 1,000 in grant aidimproved persistence by 1.5 percentage points and four-year degree completionby 2 percentage points (Nguyen et al., 2019). Based on these figures, the averageArea Foundation scholarship is expected to improve on-time bachelor’s degreecompletion by 11.8 percentage points.
18It is important to note that these effect sizes are average effect sizes, which varyby program design and the characteristics of award recipients. Programs withcomplicated eligibility standards and delivery mechanisms have been foundto produce below-average effect sizes. Those tied to academic achievement,as opposed to having no strings attached, have been found to produce aboveaverage effect sizes (Dynarski and Scott-Clayton, 2013). Finally, grant aid givento students from economically disadvantaged backgrounds was found toimprove persistence and degree completion more than grant aid provided tostudents from more privileged backgrounds (Anderson & Goldrick-Rab, 2018;Angrist et al., 2020; Denning, 2019; Sigal, 2011; Williams, 2019).Given this background knowledge, UEI researchers set out to determine ifthese effects also held true for the Area Foundation’s scholarship program.Primary research questions included the following:1. Did receiving an Area Foundation scholarship improve the likelihood offour-year college enrollment over two-year college enrollment?2. Did receiving a scholarship increase the probability of college degreecompletion?3. Did receiving a scholarship decrease student debt?4. Did receiving a scholarship decrease the amount of time employed whilein college?For each of these questions, researchers further examined if receiving an AreaFoundation scholarship benefited some student groups more than others.
19METHODOLOGYStudents voluntarily apply for scholarships through the Area Foundation. Asa result, it is reasonable to assume that scholarship recipients differ from nonrecipients in non-trivial ways. And some of these differences likely contributeto postsecondary educational achievement. For example, students who receivedscholarships likely had more access to information about college scholarships andother college knowledge. And this plausible college information advantage likelyalso meant they were more prepared for college in other important ways. Thesesystematic differences between students who select to apply for a scholarshipand those who do not can bias estimates of effect sizes (referred to as selectionbias) and lead to erroneous conclusions.To mitigate selection bias and construct a valid comparison group for eachstudent outcome examined, researchers employed a longitudinal, explanatory,nonexperimental research design using panel data and propensity scorematching (PSM). PSM is a quantitative methodology that meets the standards
20of causal inference prescribed by the Institute of Education Sciences of the U.S.Department of Education in its What Works Clearinghouse Standards HandbookVersion 4. This approach involved using a rich set of control variables to modelthe probability of receiving a scholarship as a function of student characteristics.(See Table 1 for a list of control variables used in addition to a random effectsvariable for high school and fixed-effects variable for cohort.) Researchers thenused this model to calculate each student’s expected probability of receivingan Area Foundation scholarship (referred to as a propensity score). They thenmatched scholarship recipients (also referred to as a quasi-treatment group)to non-recipients (also referred to as a quasi-control group) based on theirpropensity scores. If scholarship recipients could not be matched to nonrecipients with similar propensity scores, they were removed from the studypopulation (Rosenbaum & Rubin, 1983).There are different methods for matching a quasi-treatment group member toone or more quasi-control group members. Researchers tested four differentmatching procedures and selected the one that best fit the data. The selectedmethod involved matching each quasi-treatment group member to a weightedaverage of the five non-recipients with the nearest propensity scores.COMPARISON GROUPS. For each outcome evaluated, non-recipients were matchedto recipients to form a quasi-control group or, simply, a comparison group. Inaddition to having similar propensity scores, comparison groups were limited tostudents who attended the same high school as each recipient during the year ofscholarship receipt.
21STUDENT OUTCOMES. Researchers compared“Your generosityand support isa tremendousblessing inpropelling mysuccess.”–Diana H.the average outcome of matched recipientsand comparison groups members to identifythe average effect of receiving a scholarship.Researchers produced average treatmenteffects on the treated (i.e., average treatmenteffect when treatment is taken up) for thefollowing student outcomes: Four-year college enrollment instead of two-year college enrollment; Bachelor’s degree attainment within four years by students who enrolled ina four-year college following high school; Bachelor’s degree attainment within five years by students who enrolled ina four-year college following high school; Associate degree attainment within two years by students who enrolled in atwo-year college following high school; Associate degree attainment within three years by students who enrolled ina two-year college following high school; and, Student loan debt acquired in first four years of college of four-year collegestudents who were enrolled for four consecutive years.In estimating average treatment effect sizes, researchers included controlvariables to improve the precision of estimates.HYPOTHESES. Researchers translated each of the study’s research questions intoa testable hypothesis. Each of the following hypotheses was paired with a nullhypothesis that claimed no program effect and was rejected with an alpha levelof 0.05:
22H1: The percent of students enrolling in a four-year college rather than a twoyear college was greater for scholarship recipients than a comparison groupof similar students from the same high schools as scholarship recipients.H2: The percent of students who enrolled in a four-year college following highschool and earned a bachelor’s degree within four years was greater forscholarship recipients than a comparison group of similar students fromthe same high schools as scholarship recipients.H3: The percent of students who enrolled in a four-year college following highschool and earned a bachelor’s degree within five years was greater forscholarship recipients than a comparison group of similar students fromthe same high schools as scholarship recipients.H4: The percent of students who enrolled in a two-year college following highschool and earned an associate degree within two years was greater forscholarship recipients than a comparison group of similar students fromthe same high schools as scholarship recipients.H5: The percent of students who enrolled in a two-year college following highschool and earned an associate degree within three years was greater forscholarship recipients than a comparison group of similar students fromthe same high schools as scholarship recipients.H6: The average amount of student debt acquired during the first four yearsof college by four-year college students who persisted for four consecutiveyears was less for scholarship recipients than a comparison group of similarstudents from the same high schools as scholarship recipients.H7: The average number of quarters employed during the first four years ofcollege by four-year college students who persisted for four consecutiveyears was less for scholarship recipients than a comparison group of similar
23students from the same high schools as scholarship recipients.H8: The average total wages earned during the first four years of college byfour-year college students who persisted for four consecutive years was lessfor scholarship recipients than a comparison group of similar students fromthe same high schools as scholarship recipients.ROBUSTNESS CHECK. Researchers usedmultiple tests to determine the“Thank you for helpingme fulfill my dreams!”robustness of their findings. First,–Rayne R.was constructed to determine ifan alternative comparison groupresults were sensitive to how theydefined their comparison group.This alternative comparison groupcontained students who attendedhigh schools in the same county, instead of the same high school, of each awardeeduring the year the recipient received a scholarship. The direction, magnitude,and level of statistical significance of the study’s original findings were notaltered by the use of this alternative comparison group.Second, researchers performed multiple tests to determine the quality ofmatches between awardees and comparison group members after matching.These tests included observing a change in pseudo R2, mean bias, and medianbias, the likelihood ratio test and Ruben’s B test statistic to determine iftreatment status was unrelated to a function of control variables after matching.
24Only Hypothesis 5 (scholarship effect on associate degree completion withinthree years) produced test results that indicate a low-quality match. For thishypothesis, Rubin’s B test statistics fell slightly out of the acceptable range aftermatching, indicating that associated results should be interpreted with caution.All other hypotheses were tested with quality matches, meaning the distributionof control variables between the quasi-treatment and quasi-control groups werestatistically equivalent.STUDY LIMITATIONS. Findings produced by nonexperimental research designs suchas the one used in this study are less definitive than random control trials. Inparticular, unobserved data limits all studies that work with observational data.For example, this study does not include a direct measure of each student’sgrit—the perseverance and passion for long-term goals—in estimating effects(Duckworth, 2007). If treatment group members disproportionately possessgrit, and if variables included are poor proxies for grit, then grit may be aconfounding variable. If this is the case, then not controlling for grit will causeprogram effects to be overstated. Of course, there may also be other lurkingfactors that bias effect sizes downward. Because these variables are unobserved,their confounding effects cannot be dismissed, only mitigated through researchdesign, methodological techniques, and a proper grounding in existing theory.For these reasons, researchers characterize the findings of this study aspredictive and explanatory but not causal. For a more technical presentation ofthe methodology used, see Appendix B.
25STUDY SAMPLEThe original dataset of Area Foundation scholarship awardees included 4,880observations. However, about half of these observations were duplicates, thesame student receiving more than one award at different times. It also includedobservations that could not be linked to secondary or postsecondary records dueto inadequate personal identifiable information. Another set of observationsrepresented students who received their awards in 2019 and 2020, a period toosoon to evaluate their college outcomes.Altogether, 693 unique scholarship recipients could be included in the studysample because they met the following criteria: Completed eighth-grade, state-mandated math exam; Entered a public high school in ninth grade between school years ending in2005 to 2014; Graduated high school within four years; Received a scholarship during high school senior year or early freshman
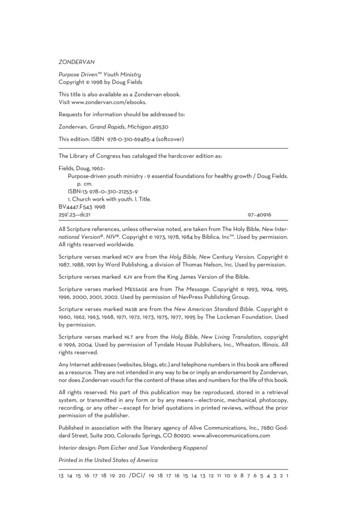
26year of college; and, Enrolled in postsecondary education (a two- or four-year Texas college)upon high school graduation.The typical awardee in our study sample was a first-generation college student,Hispanic, female, and eligible for the federal free or reduced school lunch program,as displayed in Table 4 in Appendix C. This typical student earned 4.6 AP creditsand 2.6 dual credits and achieved an eighth-grade math score higher than 65%of other Texas public school peers. In summary, the typical student came froman economically disadvantaged background but was more academically collegeready than the average high school student.Females comprised 71% of the study population. Students who identified asHispanic, White, or African American comprised 61.3%, 30.0%, and 8.7% of thestudy population. About 17.5% were identified as at risk of dropping out of highschool and 65.1% were first-generation college students.The study population had an average attendance rate of 97.3%. And 12.3% of themhad received at least one school disciplinary report.The study population by definition only included students who enrolled in a twoyear college or four-year college in the year following high school. Of awardees,86.1% enrolled in a four-year college. Of awardees who enrolled in a fouryear college, 62.8% completed a bachelor’s degree within four years and 78.7%
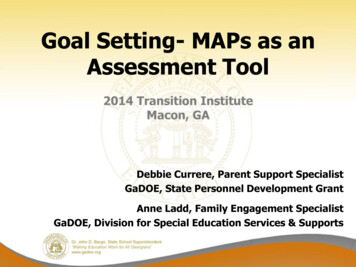
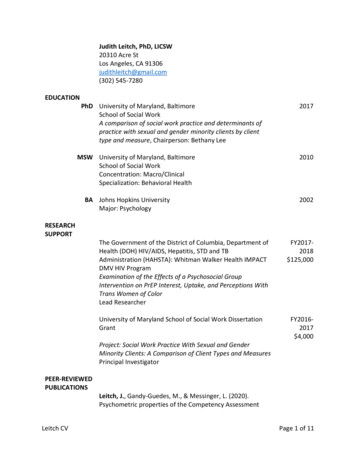
27completed within five years. Of awardees who enrolled in a two-year college,9.7% completed an associate degree within two years and 13.6% completed withinthree years. Awardees who enrolled in a four-year college and completed fourconsecutive years of college acquired 12,816 (SD 18,379) of student debt onaverage.TABLE 1: DESCRIPTIVE STATISTICS OF AWARDEES’ CHARACTERISTICS AND POSTSECONDARY OUTCOMESHIGH SCHOOLS. Awardees in our study sample graduated from 249 different highschools. As shown in Figure 1, Alamo Heights High School represented the largestshare (45 awardees), followed by Travis Early College High School (36 awardees),
28Cotulla High School (32 awardees), Lanier High School (26 awardees), RooseveltHigh School (24 awardees), Young Women’s Leadership Academy (24 awardees),KIPP University PREP High School (23 awardees), Churchill High School (20awardees), Madison High School (20 awardees), and Sam Houston High School (19awardees). Due to student privacy requirements under the Family EducationalRights and Privacy Act (FERPA), 205 high schools could not be included in Figure1 because they represented less than 5 students each.FIGURE 1: DISTRIBUTION OF SCHOLARSHIP RECIPIENTS BY HIGH SCHOOLTHAT HAD 5 OR MORE AWARDEES
29RESULTSDID RECEIVING AN AREA FOUNDATION SCHOLARSHIP INCREASE THE LIKE
earning bachelor’s degrees within four years. Receiving a scholarship increased the probability of earning a bachelor’s degree in four years by 19.5 percentage points. Receiving a scholarship did not chang