Transcription
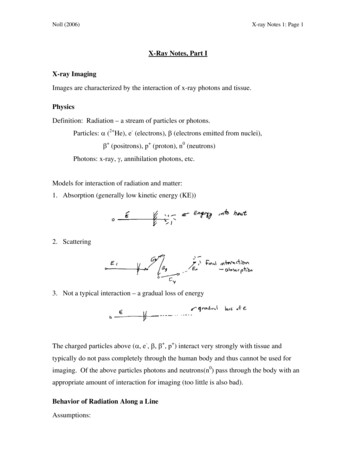
Energy-Dispersive X-ray Spectrometry - Oxford InstrumentsAZtec Software Operating InstructionsFigure 1: Oxford Instruments X-Max EDS Detector1
Contents1 Introduction32 Sample Considerations33 Analytical Considerations3.1 Accelerating Voltage . .3.2 Beam Current . . . . . .3.3 Ratemeter . . . . . . . .3.4 Process Time . . . . . .3.5 Peak Artifacts . . . . . .3334444 Analytical Modes4.1 Analyzer . . . .4.2 Point & ID . .4.3 Map . . . . . .4.4 Line Scan . . .4.5 Optimize . . .555666.5 Image Collection66 Operation of The TEM X-Max 80 TLE Detector72
1IntroductionEnergy Dispersive X-ray Spectroscopy (EDS) is a very useful analytical instrument for rapidly determining SEM sample chemistry (elements B to U), common on most scanning electron microscopes.EDS can be used for qualitative analyses of samples and, with a few caveats, for the quantitativeanalysis of sample chemistry.This guide is intended to enable the SEM/EDS user to generate, collect, and interpret spectrausing the Oxford Instruments AZtec software installed on the Hitachi 3400N and FEI Teneo scanningelectron microscopes. The software performs almost identically between instruments, any exceptionswill be highlighted. The X-Max EDS detector on the Hitachi 3400N has a 50mm2 silicon drift detector,The X-Max on the FEI Teneo has an 80mm2 detector.For more detailed information regarding software operation consult the AZtec User Manual PDFlocated on the Windows desktop or the AZtec help function.2Sample Considerations Samples for EDS analysis should be conductive and grounded to the sample stage. Nonconductive samples can be analyzed in low vacuum mode. The pressure limiting aperture shouldbe inserted in the Teneo (ask the lab manager for assistance). Be aware that beam skirting inlow vacuum operation may mean x-rays are being generated and collected from outside the fieldof view. Samples should thermally stable under the beam. Note that in order to get collect enough x-raysto analyze the samples we usually increase the beam current. Samples should be mechanically stable, i.e. attached well to the SEM stage to prevent samplevibration. No loose powders shall be placed in the FESEM, material can get into the lenses anddamage the microscope. Wet samples cannot be imaged/analyzed in the SEMs.33.1Analytical ConsiderationsAccelerating VoltageThe EDS detectors collects characteristic x-rays generated through the interaction of primary beamelectrons with shell electrons. These x-rays have energies characteristic to the given element under thebeam. The primary electron beam must have enough energy to excite the x-rays of interest. The ruleof thumb is to use a beam energy (accelerating voltage) 1.4 times the energy of the x-ray of interest.For example in order to generate Fe Kα (6.405eV) x-rays we would need a beam energy greater thanabout 9kV.3.2Beam CurrentHigh resolution images are often collected at very low beam currents. Under these conditions very fewx-rays are generated therefore it is normal practice to increase the beam current to get an acceptablex-ray count. Using the Teneo you might use 6.4ηA and up, on the Hitachi increase the beam currentslider up to 70 (arbitrary units) or more. Note that the analytical spatial resolution of the analysis isalmost always larger than the electron image resolution – this is a function of the interaction volumewithin the sample from which x-rays are generated (and escape) being larger than the volume fromwhich secondary and backscattered electrons are detected. Just because you can image an area doesnot mean you can analyze at that same spatial resolution!3
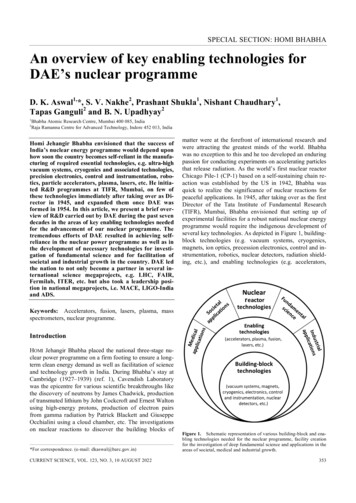
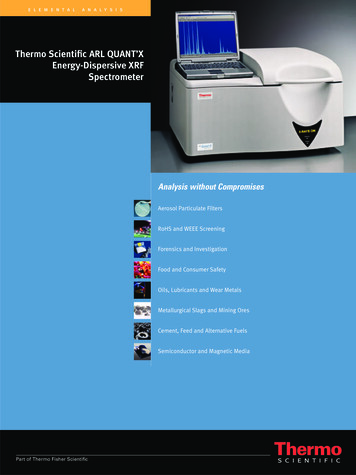
It is generally useful to collect sample images under more ideal imaging conditions (lower kV, lowerbeam current) before optimizing the beam conditions for EDS analysis.3.3RatemeterAlways check the Ratemeter in the lower right pane of the AZtec software (figure 2) to determine ifyou are getting enough x-rays for analysis.Figure 2: RatemeterThe Ratemeter shows the Input Count Rate, Output Count Rate and Dead Time. The inputcount rate is the number of x-rays detected, the output count rate shows the number of x-rays thatare processed per second and the dead time indicates the percentage of time the x-ray detector is busyand cannot process incoming x-rays. It is preferable to be able to use as many of the incoming x-raysas possible, i.e. running at a low deadtime.3.4Process TimeIn the settings of the Ratemeter panel the user can select the Process Time. The fastest process time(1) will process a larger proportion of the incoming x-rays than the slower process times. The fastestprocess times conversely have the lowest spectral resolution (peak width). If you have elements in yourspectrum with little to no peak overlap use the fastest process times in order to collect the maximumamount of x-ray data in a given time. However, if you have overlapping peaks (e.g. Mn Kβ and FeKα) you might want to try a slower process time (e.g. 4-6) which will show better peak resolution.3.5Peak ArtifactsSum peaks, also known as pulse pile-up and escape peaks are described in detail in Technical NoteTN-002: Pitfalls of Energy-Dispersive X-Ray Spectroscopy: Dead time and Peak Artifacts. TN-002and other Technical and Application Notes are available on the BSCMC website.Note: When mapping, performing line scans or quantifying x-ray data with peak overlaps you canmanually select which of an element’s peaks are used. This may be useful if there is an overlap on theKα peak you can use the Kβ or Lα peak for the same element instead.4
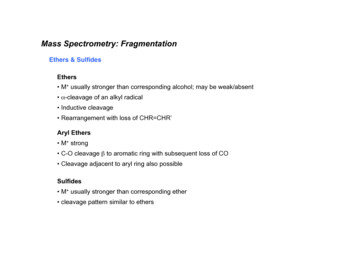
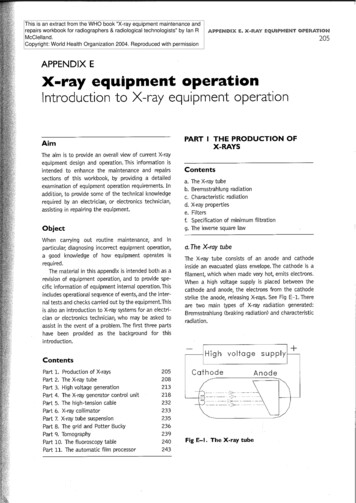
44.1Analytical ModesAnalyzerThis mode analyzes whatever is in the SEM’s field of view. This is useful as a quick check by zoomingon a particle or area of interest until it fills the frame and clicking Start.4.2Point & IDIn this analytical mode you can capture an image and then select points or areas to analyze.Figure 3: Analysis Area SelectionMultiple regions for analysis can be selected and will be queued by the software. The activeanalysis will be highlighted in yellow on the collected image (a progress bar of the spectrum collectionis shown in the data field on the right), the completed analyses are highlighted in white, and thequeued analyses in blue (figure 4).Figure 4: Analyses Progress5
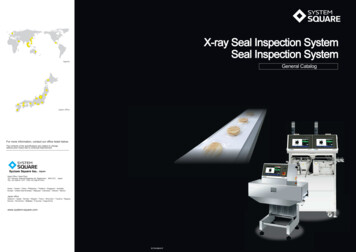
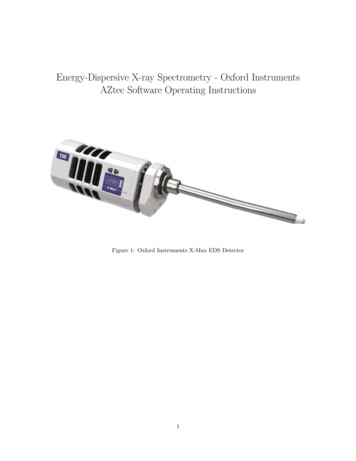
4.3MapWhen mapping the chemistry of a sample you again collect an image of the area of interest thenchoose a region or regions within that area to map. Alternatively you can map the whole region.4.4Line ScanLine scan can be used to collect EDS data along a line, or multiple lines (figure 5). This may be usefulto look at chemical differences across an interface (e.g. diffusion of elements into, or out off a region).Figure 5: Line Scan4.5OptimizeThis is used by the lab manager to check and compensate for any drift in the measured peaks. Thisshould not be adjusted by the user. If your element peaks are not aligned with the theoretical peakpositions shown in the software please inform the lab manager.5Image CollectionUsing the Teneo, the image will only be collected from the top left quadrant (quad 1) of the FESEMuser interface. In the AZtec settings you can select the pixel dimensions of the collected image andchoose the dwell time of the scan. Usually the longer the dwell time the better the image signal tonoise but only up to a point. You can also collect multiple short dwell time images and integratethem. This is useful if the area is charging slightly. During, or after, image collection the contrastand brightness of the image can be modified through the brightness/contrast window.In the scan image settings the user can select the pixel dimensions of the image and the dwell time.6
Figure 6: Scan Image Window6Operation of The TEM X-Max 80 TLE DetectorThis EDS detector has no window, so failure to follow these instructions will result in condensationof moisture and potential damage to the detector. Before sample loading: Make sure the detector is warm or in “Standby mode” – red light on thedetector Load sample on to TEM, find the area of interest X-tilt the sample by 10 degrees towards the detector If alteast 15 minutes has elapsed since sample loading, click on the detector control and set itto “operate” – this will begin cooling of the detector – notice a flashing blue light Wait until the detector is cold – solid blue light Insert the detector and perform EDS analysis. Adjust the spot size and/or brightness knobs to achieve optimum dead time Do not move to the thicker parts of the specimen or move across the copper mesh when usinga TEM grid to prevent detector saturation After completing the analysis, retract the detector and set it to “standby” mode to warm thedetector to room temperature. Before removing the sample from the TEM, check again to make sure that the detector is warm– red light.Note: Detector must be warm and retracted during sample loading/unloading.7
using the Oxford Instruments AZtec software installed on the Hitachi 3400N and FEI Teneo scanning electron microscopes. The software performs almost identically between instruments, any exceptions will be highlighted. The X-Max EDS detector on the Hitachi 3400N has a 50mm2 silicon drift detector, The X-Max on the FEI Teneo has an 80mm2 detector.