Transcription
CHAPTER 17Problem Solving andData AnalysisThe Problem Solving and Data Analysis questions on the SAT MathTest assess your ability to use your understanding of math and yourskills to solve problems set in the real world. The questions ask youto create a representation of a problem, consider the units involved,pay attention to the meaning of quantities, know and use differentproperties of mathematical operations and representations, and applykey principles of statistics and probability. Special focus in thisdomain is given to mathematical models. Models are representationsof real-life contexts. They help us to explain or interpret the behaviorof certain components of a system and to predict results that are asyet unobserved or unmeasured. You may be asked to create and use amodel and to understand the distinction between the predictions of amodel and the data that has been collected.Some questions involve quantitative reasoning about ratios, rates,and proportional relationships and may require understanding andapplying unit rates. Some problems are set in academic and careersettings and draw from science, including the social sciences.Some questions present information about the relationship betweentwo variables in a graph, scatterplot, table, or another form and ask youto analyze and draw conclusions about the given information. Thesequestions assess your understanding of the key properties of, and thedifferences between, linear, quadratic, and exponential relationshipsand how these properties apply to the corresponding real-life contexts.Problem Solving and Data Analysis also includes questions that assessyour understanding of essential concepts in statistics and probability.You may be asked to analyze univariate data (data involving onevariable) presented in dot plots, histograms, box plots, and frequencytables, or bivariate data (data involving two variables) presented inscatterplots, line graphs, and two-way tables. This includes computing,comparing, and interpreting measures of center, interpreting measuresof spread, describing overall patterns, and recognizing the effects ofoutliers on measures of center and spread. These questions may testyour understanding of the conceptual meaning of standard deviation(although you will not be asked to calculate a standard deviation).209
PART 3 MathOther questions may ask you to estimate the probability of an event,employing different approaches, rules, or probability models. Specialattention is given to the notion of conditional probability, which istested using two-way tables and in other ways.Some questions will present you with a description of a study and askyou to decide what conclusion is most appropriate based on the designof the study. Some questions ask about using data from a sample todraw conclusions about an entire population. These questions mightalso assess conceptual understanding of the margin of error (althoughyou won’t be asked to calculate a margin of error) when a populationmean or proportion is estimated from sample data. Other questionsask about making conclusions about cause-and-effect relationshipsbetween two variables.REMEMBERProblem Solving and Data Analysisquestions comprise 17 of the58 questions (29%) on the Math Test.Problem Solving and Data Analysis questions include both multiplechoice questions and student-produced response questions. The use ofa calculator is allowed for all questions in this domain.Problem Solving and Data Analysis is one of the three SAT Math Testsubscores, reported on a scale of 1 to 15.Let’s explore the content and skills assessed by Problem Solving andData Analysis questions.Ratio, Proportion, Units, and PercentageRatio and proportion is one of the major ideas in mathematics.Introduced well before high school, ratio and proportion is a themethroughout mathematics, in applications, in careers, in collegemathematics courses, and beyond.Example 1On Thursday, 240 adults and children attended a show. The ratio of adults tochildren was 5 to 1. How many children attended the show?A) 40B)48C) 192D) 200PRACTICE ATsatpractice.orgA ratio represents a relationshipbetween quantities, not the actualquantities themselves. Fractionsare an especially effective way torepresent and work with ratios.210Because the ratio of adults to children was 5 to 1, there were 5 adultsfor every 1 child. Thus, of every 6 people who attended the show,55 were adults and 1 was a child. In fractions, of the 240 who attended611were adults and were children. Therefore, 240 40 children66attended the show, which is choice A.3Ratios on the SAT may be expressed in the form 3 to 1, 3:1, 1 , orsimply 3.
Chapter 17 Problem Solving and Data AnalysisExample 2On an architect’s drawing of the floor plan for a house, 1 inch represents3 feet. If a room is represented on the floor plan by a rectangle that has sidesof lengths 3.5 inches and 5 inches, what is the actual floor area of the room, insquare feet?A) 17.5B)51.0C) 52.5D) 157.5Because 1 inch represents 3 feet, the actual dimensions of the room are3 3.5 10.5 feet and 3 5 15 feet. Therefore, the floor area of theroom is 10.5 15 157.5 square feet, which is choice D.Another classic example of ratio is the length of a shadow. At a givenlocation and time of day, it might be true that a fence post that hasa height of 4 feet casts a shadow that is 6 feet long. This ratio of thelength of the shadow to the height of the object, 6 to 4 or 3 to 2, remainsthe same for any object at the same location and time. This could beconsidered a unit rate: the ratio of the length of the shadow to the33height of the object would be equivalent to to 1 or the unit rate feet22change in length of shadow for every 1 foot change in height of theobject. So, for example, a tree that is 12 feet tall would cast a shadow3that is 12 18 feet long. In this situation, in which one variable2quantity is always a fixed constant times another variable quantity, thetwo quantities are said to be directly proportional.Variables x and y are said to be directly proportional if y kx, where k is anonzero constant. The constant k is called the constant of proportionality.In the preceding example, you would say the length of an object’sshadow is directly proportional to the height of the object, with3constant of proportionality . So if you let L be the length of the23shadow and H be the height of the object, then L H.2Notice that both L and H are lengths, so the constant ofL 3proportionality, , has no units. In contrast, let’s considerH 2Example 2 again. On the scale drawing, 1 inch represents 3 feet. Thelength of an actual measurement is directly proportional to its lengthon the scale drawing. But to find the constant of proportionality, you36 inches3 feetneed to keep track of units: 36. Hence, if S is a1 inch1 inchlength on the scale drawing that corresponds to an actual length of R,then R 36S, where R and S have the same units.Many of the questions on the SAT Math Test require you to payattention to units. Some questions in Problem Solving and DataAnalysis require you to convert units either between the Englishsystem and the metric system or within those systems.211
PART 3 MathExample 3Scientists estimate that the Pacific Plate, one of Earth’s tectonic plates, hasmoved about 1,060 kilometers in the past 10.3 million years. About howfar, in miles, has the Pacific Plate moved during this same time period?(Use 1 mile 1.6 kilometers.)A) 165B)398C)663D) 1,696PRACTICE ATsatpractice.orgPay close attention to units,and convert units if required bythe question. Writing out theunit conversion as a series ofmultiplication steps, as seenhere, will help ensure accuracy.Intermediate units should cancel(as do the kilometers in Example 3),leaving you with the desired unit.REMEMBER13 of the 58 questions on the MathTest, or 22%, are student-producedresponse questions for which you’llgrid your answers in the spacesprovided on the answer sheet.Because 1 mile 1.6 kilometers, the distance is 1,060 kilometers 1 mile — 662.5 miles, which is about 663 miles. Therefore, the1.6 kilometerscorrect answer is choice C.Questions may require you to move between unit rates and totalamounts.Example 4County Y consists of two districts. One district has an area of 30 square milesand a population density of 370 people per square mile, and the other districthas an area of 50 square miles and a population density of 290 people persquare mile. What is the population density, in people per square mile, for allof County Y?(Note that this example is a student-produced response question andhas no choices. On the SAT, you will grid your answer in the spacesprovided on the answer sheet.)The first district has an area of 30 square miles and a populationdensity of 370 people per square mile, so its total population is370 people30 square miles — 11,100 people. The other district hassquare milean area of 50 square miles and a population density of 290 people per290 peoplesquare mile, so its total population is 50 square miles — square mile14,500 people. Thus, County Y has total population 11,100 14,500 25,600 people and total area 30 50 80 square miles. Therefore, thepopulation density of County Y is 212
Chapter 17 Problem Solving and Data AnalysisProblem Solving and Data Analysis also includes questions involvingpercentages, which are a type of proportion. These questions mayinvolve the concepts of percentage increase and percentage decrease.Example 5A furniture store buys its furniture from a wholesaler. For a particular style oftable, the store usually sells a table for 75% more than the cost of the table fromthe wholesaler. During a sale, the store sells the table for 15% more than thecost from the wholesaler. If the sale price of the table is 299, what is the usualprice for the table?A) 359PRACTICE ATsatpractice.orgPercent is a type of proportionthat means “per 100”; 20%, forinstance, means 20 out of (or per)100. Percent increase or decrease iscalculated by finding the differencebetween two quantities, thendividing the difference by the originalquantity and multiplying the resultby 100.B) 455C) 479D) 524The sale price of the table was 299. This is equal to the cost from thewholesaler plus 15%. Thus, 299 1.15(cost from the wholesaler), and 299the cost from the wholesaler is —1.15 260. The usual price is the costfrom the wholesaler, 260, plus 75%. Therefore, the usual price thestore charges for the table is 1.75 260 455, which is choice B.Interpreting RelationshipsPresented in Scatterplots,Graphs, Tables, and EquationsThe behavior of a variable and the relationship between two variablesin a real-world context may be explored by considering data presentedin tables and graphs.The relationship between two quantitative variables may be modeledby a function or an equation. The model may allow very accuratepredictions, as for example models used in physical sciences, or mayonly describe a general trend, with considerable variability between theactual and predicted values, as for example models used in behavioraland social sciences.REMEMBERThe ability to interpret andsynthesize data from charts, graphs,and tables is a widely applicable skillin college and in many careers andthus is tested on the SAT Math Test.Questions on the SAT Math Test assess your ability to understandand analyze relationships between two variables, the properties of thefunctions used to model these relationships, and the conditions underwhich a model is considered to be an appropriate representation of thedata. Problem Solving and Data Analysis questions focus on linear,quadratic, and exponential relationships.213
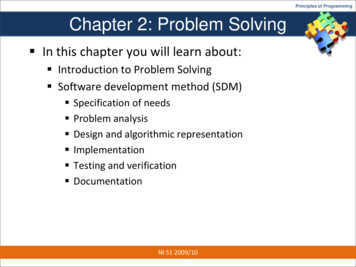
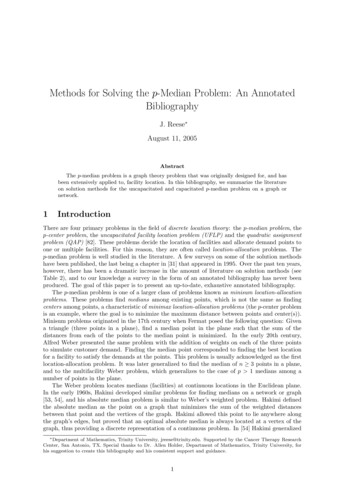
PART 3 MathNumber of pints soldExample 6PRACTICE ATsatpractice.orgA line of best fit is a straight linethat best represents the associationshown on a scatterplot. It’s oftenwritten in y a bx form.190180170160150y 233 – 32x1401301201101009080700 0 0 0 0 0 0 01.5 2.0 2.5 3.0 3.5 4.0 4.5 5.0Price per pint (dollars)A grocery store sells pints of raspberries and sets the price per pint each week.The scatterplot above shows the price and the number of pints of raspberriessold for 19 weeks, along with a line of best fit for the data and an equation forthe line of best fit.There are several different questions that could be asked about thiscontext.A. According to the line of best fit, how many pints of raspberrieswould the grocery store be predicted to sell in a week when the price ofraspberries is 4.50 per pint?Because the line of best fit has equation y 233 32x, where x is theprice, in dollars, for a pint of raspberries and y is the predicted numberof pints of raspberries sold, the number of pints the store would bepredicted to sell in a week where the price of raspberries is 4.50 per pintis 233 32(4.50) 89 pints.B. For how many of the 19 weeks shown was the number of pints ofraspberries sold greater than the number predicted by the line of best fit?For a given week, the number of pints of raspberries sold is greaterthan the number predicted by the line of best fit if and only if the pointrepresenting that week lies above the line of best fit. For example, atthe price of 5 per pint, the number sold in two different weeks wasapproximately 80 and 90, which is more than the 73 predicted by the lineof best fit. Of the 19 points, 8 lie above the line of best fit, so there were8 weeks in which the number of pints sold was greater than what waspredicted by the line of best fit.C. What is the best interpretation of the slope of the line of best fit inthis context?214
Chapter 17 Problem Solving and Data AnalysisOn the SAT, this question would be followed by multiple-choice answeroptions. The slope of the line of best fit is 32. This means that the correctanswer would state that for each dollar that the price of a pint of raspberriesincreases, the store is predicted to sell 32 fewer pints of raspberries.D. What is the best interpretation of the y-intercept of the line of best fitin this context?On the SAT, this question would be followed by multiple-choiceanswer options.In this context, the y-intercept does not represent a likely scenario, soit cannot be accurately interpreted in this context. According to themodel, the y-intercept means that if the store sold raspberries for 0 perpint—that is, if the store gave raspberries away—233 people would beexpected to accept the free raspberries. However, it is not realistic that thestore would give away raspberries, and if they did, it is likely that far morepeople would accept the free raspberries. Also notice that in this case, theleft-most line on the graph is not the y-axis. The lower-left corner showsthe x- and y-coordinates of (1.5, 70), not (0, 0).The fact that the y-intercept indicates that 233 people would acceptfree raspberries is one limitation of the model. Another limitation isthat for a price of 7.50 per pint or above, the model predicts that anegative number of people would buy raspberries, which is impossible.In general, you should be cautious about applying a model for valuesoutside of the given data. In this example, you should only be confidentin the prediction of sales for prices between 2 and 5.Giving a line of best fit, as in this example, assumes that therelationship between the variables is best modeled by a linear function,but that is not always true. On the SAT, you may see data that are bestmodeled by a linear, quadratic, or exponential model.Example 7Time (hours)Number of bacteria01,00014,000216,000364,000The table above gives the initial number (at time t 0) of bacteria placed ina growth medium and the number of bacteria in the growth medium eachhour for 3 hours. Which of the following functions best models the number ofbacteria, N(t), after t hours?A) N(t) 4,000tB) N(t) 1,000 3,000t tC) N(t) 1,000(4 )tD) N(t) 1,000(4 )215
PART 3 MathPRACTICE ATsatpractice.orgTo determine if a relationship islinear or exponential, examine thechange in the quantity betweensuccessive time periods. If thedifference in the quantity isconstant, the relationship is linear.If the ratio in the quantity is constant(for instance, 4 times greater thanthe preceding time period), therelationship is exponential.The given choices are linear and exponential models. If a quantityis increasing linearly with time, then the difference in the quantitybetween successive time periods is constant. If a quantity is increasingexponentially with time, then the ratio in the quantity betweensuccessive time periods is constant. According to the table, after eachhour, the number of bacteria in the culture is 4 times as great as it4,000 —16,000 —64,000 4. That is, for each was the preceding hour: — 1,0004,000 16,000increase of 1 in t, the value of N(t) is multiplied by 4. At t 0, whichcorresponds to the time when the culture was placed in the medium,there were 1,000 bacteria. This is modeled by the exponential functiontN(t ) 1,000(4 ), which has the value 1,000 at t 0 and increases bya factor of 4 for each increase of 1 in the value of t. Choice D is thecorrect answer.The SAT Math Test may include questions that require you to knowthe difference between linear and exponential growth.Example 8Every month Jamal adds two new books to his library. Which of the followingtypes of functions best models the number of books in Jamal’s library as afunction of time?A) Increasing linearB) Decreasing linearC) Increasing exponentialD) Decreasing exponentialOver equal intervals, linear functions increase or decrease by aconstant amount, while exponential functions increase or decreaseby a constant factor. Since the number of books is increasing by aconstant amount (2 books) over equal intervals (each month), thefunction is linear. Also, since the number of books is increasing astime increases, the function is increasing, and therefore choice Ais correct.216
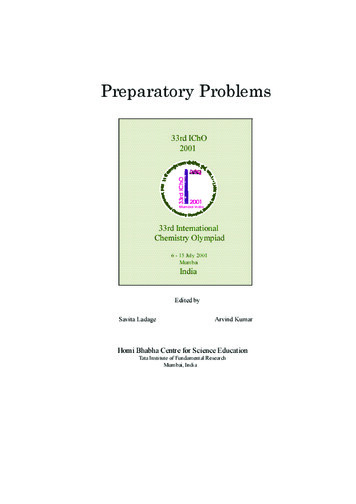
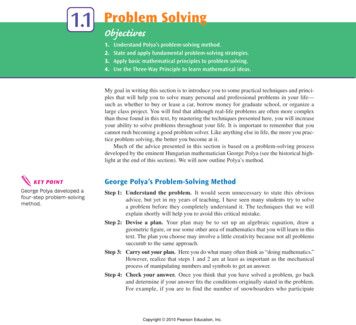
Chapter 17 Problem Solving and Data AnalysisSpeed (miles per hour)Example 9987654321001020 30 40 50Time (minutes)60One evening, Maria walks, jogs, and runs for a total of 60 minutes. The graphabove shows Maria’s speed during the 60 minutes. Which segment of the graphrepresents the times when Maria’s speed is the greatest?A) The segment from (17, 6) to (19, 8)B) The segment from (19, 8) to (34, 8)C) The segment from (34, 8) to (35, 6)D) The segment from (35, 6) to (54, 6)The correct answer is choice B. Because the vertical coordinate representsMaria’s speed, the part of the graph with the greatest vertical coordinaterepresents the times when Maria’s speed is the greatest. This is thehighest part of the graph, the segment from (19, 8) to (34, 8), when Mariaruns at 8 miles per hour (mph). Choice A represents the time duringwhich Maria’s speed is increasing from 6 to 8 mph; choice C representsthe time during which Maria’s speed is decreasing from 8 to 6 mph; andchoice D represents the longest period of Maria moving at the same speed(6 mph), not the times when Maria’s speed is the greatest.217
PART 3 MathMore Data and StatisticsSome questions on the SAT Math Test will assess your abilityto understand and analyze data presented in a table, bar graph,histogram, dot plot, box plot, line graph, or other display.Example 10A store is deciding whether to install a new security system to preventshoplifting. Based on store records, the security manager of the store estimatesthat 10,000 customers enter the store each week, 24 of whom will attemptto shoplift. Based on data provided from other users of the security system,the manager estimates the results of the new security system in detectingshoplifters would be as shown in the table below.AlarmsoundsAlarm doesnot soundTotalCustomer attempts toshoplift21324Customer does not attemptto shoplift359,9419,976Total569,94410,000According to the manager’s estimates, if the alarm sounds for a customer, whatis the probability that the customer did not attempt to shoplift?A) 0.0003B) 0.0035C) 0.0056D) 0.625According to the manager’s estimates, the alarm will sound for56 customers. Of these 56 customers, 35 did not attempt to shoplift.Therefore, if the alarm sounds, the probability that the customer did not35 5attempt to shoplift is — — 0.625. The correct answer is choice D.56 8Example 10 is an example of a conditional probability, the probabilityof an event given that another event is known to have occurred. Thequestion asks for the probability that a customer did not attempt toshoplift given that the alarm sounded.REMEMBERMean and median are measuresof center for a data set, whilerange and standard deviation aremeasures of spread.218You may be asked to answer questions that involve a measure of centerfor a data set: the mean or the median. A question may ask you to drawconclusions about one or more of these measures of center even if theexact values cannot be calculated. To recall briefly:The mean of a set of numerical values is the sum of all the valuesdivided by the number of values in the set.
Chapter 17 Problem Solving and Data AnalysisThe median of a set of numerical values is the middle value whenthe values are listed in increasing (or decreasing) order. If the set hasan even number of values, then the median is the average of the twomiddle values.Number of workersExample 111816141210864201020 30 40 50 60 70Time worked (in hours)The histogram shown summarizes the distribution of time worked last week,in hours, by the 40 employees of a landscaping company. In the histogram,the first bar represents all workers who worked at least 10 hours but less than20 hours; the second represents all workers who worked at least 20 hours butless than 30 hours; and so on. Which of the following could be the median andmean amount of time worked, in hours, for the 40 employees?A) Median 22, Mean 23REMEMBERThe distribution of a variableprovides all the possible values of thevariable and how often they occur.B) Median 24, Mean 22C) Median 26, Mean 32D) Median 32, Mean 30(Note: On the SAT, all histograms have the same type of boundary condition. That is,the values represented by a bar include the left endpoint but do not include the rightendpoint.)If the number of hours the 40 employees worked is listed inincreasing order, the median will be the average of the 20th andthe 21st numbers on the list. The first 6 numbers on the list willbe workers represented by the first bar; hence, each of the first6 numbers will be at least 10 but less than 20. The next 17 numbers,that is, the 7th through the 23rd numbers on the list, will be workersrepresented by the second bar; hence, each of the next 17 numberswill be at least 20 but less than 30. Thus, the 20th and the 21stnumbers on the list will be at least 20 but less than 30. Therefore,any of the median values in choices A, B, or C are possible, but themedian value in choice D is not.219
PART 3 MathNow let’s find the possible values of the mean. Each of the 6 employeesrepresented by the first bar worked at least 10 hours but less than20 hours. Thus, the total number of hours worked by these 6 employeesis at least 60. Similarly, the total number of hours worked by the17 employees represented by the second bar is at least 340; the totalnumber of hours worked by the 9 employees represented by the thirdbar is at least 270; the total number of hours worked by the 5 employeesrepresented by the fourth bar is at least 200; the total number of hoursworked by the 1 employee represented by the fifth bar is at least 50;and the total number of hours worked by the 2 employees representedby the sixth bar is at least 120. Adding all these hours shows thatthe total number of hours worked by all 40 employees is at least60 340 270 200 50 120 1,040. Therefore, the mean number of1,040hours worked by all 40 employees is at least — 26. Therefore, only40the values of the mean given in choices C and D are possible. Becauseonly choice C has possible values for both the median and the mean, itis the correct answer.A data set may have a few values that are much larger or smaller thanthe rest of the values in the set. These values are called outliers. Anoutlier may represent an important piece of data. For example, if adata set consists of rates of a certain illness in various cities, a datapoint with a very high value could indicate a serious health issue to beinvestigated.In general, outliers affect the mean more than the median.Therefore, out liers that are larger than the rest of the points inthe data set tend to make the mean greater than the median, andoutliers that are smaller than the rest of the points in the data settend to make the mean less than the median. In Example 11, themean was larger than the median due to the unusually large amountof time worked by a few employees.REMEMBERYou won’t be asked to calculate thestandard deviation of a set of dataon the SAT Math Test, but you willbe expected to demonstrate anunderstanding of what standarddeviation measures.220The mean and the median are different ways to describe the centerof a data set. Another key characteristic of a data set is the amountof variability, or spread, in the data. One measure of spread is therange, which is equal to the maximum value minus the minimumvalue. Another measure of spread is the standard deviation, which is ameasure of how far away the points in the data set are from the meanvalue. On the SAT Math Test, you will not be asked to compute thestandard deviation of a data set, but you do need to understand that alarger standard deviation corresponds to a data set whose values aremore spread out from the mean value.
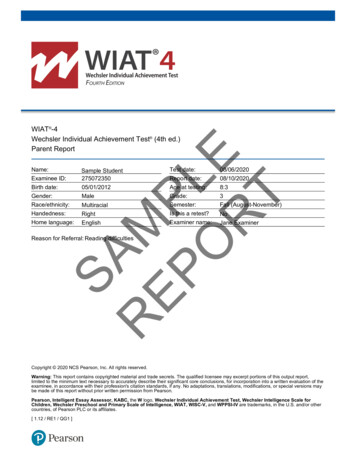
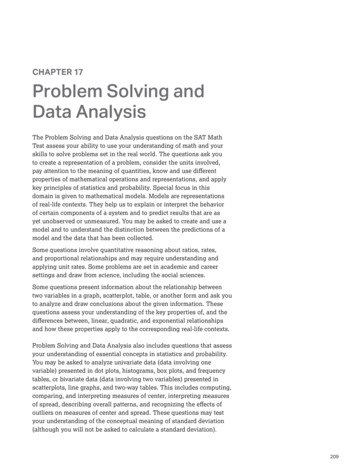
Chapter 17 Problem Solving and Data AnalysisExample 12Class AClass B01234Quiz score501234Quiz score5The dot plots show the distributions of scores on a current events quiz fortwo classes of 24 students each. Which of the following statements about thestandard deviations of the two distributions is true?A) The standard deviation of quiz scores in Class A is less than that of quizscores in Class B.B) The standard deviation of quiz scores in Class A is greater than that of quizscores in Class B.C) The standard deviation of quiz scores in Class A is equal to that of quizscores in Class B.D) There is not enough information to compare the standard deviations.In Class A, the mean score is between 3 and 4. The large majority ofscores are 3 and 4, with only a few scores of 0, 1, 2, and 5. In Class B,the mean score is 2.5, and scores are evenly distributed across allpossible scores, with many scores not close to the mean score.Because the scores in Class A are more closely clustered aroundthe mean, the standard deviation of the scores in Class A is smaller.The correct answer is choice A.A population parameter is a numerical value that describes acharacteristic of a population. For example, the percentage ofregistered voters who would vote for a certain candidate is a parameterdescribing the population of registered voters in an election. In anotherexample, the average income of a household in a city is a parameterdescribing the population of households in that city. We often donot know the value of the population parameter; thus, an essentialpurpose of statistics is to estimate a population parameter based ona sample from the population. A common example is election polling,where researchers will interview a random sample of registered votersto estimate the proportion of all registered voters who plan to votefor a certain candidate. The precision of the estimate depends on thevariability of the sample data and the sample size. For instance, ifhousehold incomes in a city vary widely or the sample is small, theestimate that comes from a sample may differ considerably from theactual value for the population parameter.PRACTICE ATsatpractice.orgWhen asked to compare thestandard deviations of twodata sets, first locate the meanapproximately. Then, ask yourselfwhich data set has values that aremore closely clustered around themean. That data set will have thesmaller standard deviation.221
PART 3 MathFor example, a researcher wants to estimate the mean number ofhours each week that the 1,200 students at a high school spendon the internet. Interviewing all 1,200 students would be timeconsuming, and it would be more efficient to survey a randomsample of the students. Suppose the researcher has time to interview80 students. Which 80 students? In order to have a sample that isrepresentative of the population, students who will participate in thestudy should be selected at random. That is, each student must havethe same chance to be selected. Random selection is essential inprotecting against bias and increases the reliability of any estimatescalculated. The researcher can select students at random in severaldifferent ways; for instance, write each student’s name on a slip ofpaper, put all the slips in a bowl, mix up the slips, and then draw80 names from the bowl. In practice, a computer is often used toselect participants at random.If you do not select a random sample, the sampling method usedmay introduce bias. For example, if you found 80 students from thoseattending a game of the school’s football team, those people wouldbe more likely to be interested in sports, and in turn, an interest insports might be related to the average amount of time the studentsspend on the internet. The result would be that the average time those80 students spend on the internet might not be an accurate estimateof the average amount of time all students at the school spend onthe internet.Suppose you select 80 students at random from the 1,200 studentsat the high school. You ask them how much time they spend on theinternet each week, and you calculate that the mean time is 14 hours.You also find that 6 of the 80 students spend less than 2 hours eachweek on the internet. Based on these results, what conclusions shouldbe made about the e
Problem Solving and Data Analysis The Problem Solving and Data Analysis questions on the SAT Math Test assess your ability to use your understanding of math and your skills to solve problems set in the real world. The questions ask you to create a representation of a