Transcription
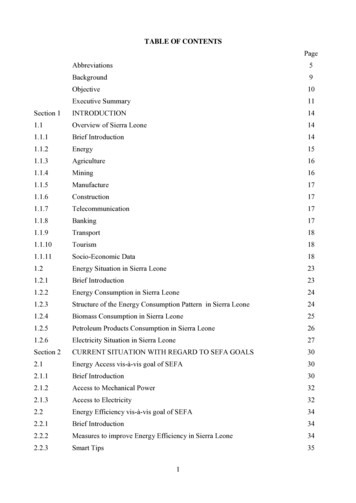
TABLE OF ecutive Summary11Section 1INTRODUCTION141.1Overview of Sierra Leone141.1.1Brief .1.10Tourism181.1.11Socio-Economic Data181.2Energy Situation in Sierra Leone231.2.1Brief Introduction231.2.2Energy Consumption in Sierra Leone241.2.3Structure of the Energy Consumption Pattern in Sierra Leone241.2.4Biomass Consumption in Sierra Leone251.2.5Petroleum Products Consumption in Sierra Leone261.2.6Electricity Situation in Sierra Leone27Section 2CURRENT SITUATION WITH REGARD TO SEFA GOALS302.1Energy Access vis-à-vis goal of SEFA302.1.1Brief Introduction302.1.2Access to Mechanical Power322.1.3Access to Electricity322.2Energy Efficiency vis-à-vis goal of SEFA342.2.1Brief Introduction342.2.2Measures to improve Energy Efficiency in Sierra Leone342.2.3Smart Tips351
NATIONAL ENERGY PROFILE OF SIERRA LEONE [JUNE, 2012]2.3Renewable Energy vis-à-vis goal of SEFA362.3.1Brief Introduction362.3.2Biomass362.3.3Ethanol Production372.3.4Palm Oil Products382.3.5Agricultural Residues382.3.6Hydropower402.3.7Solar Energy422.3.8Wind Energy452.4SEFA Goals462.4.1Strategy for Providing SEFA462.4.2Projection of Planned Targets58Section 3CHALLENGES AND OPPORTUNITIES FOR ACHIEVING SEFAGOALS653.1Institutional and Policy Framework653.1.1Brief Introduction653.1.2Strategic Reform Process693.1.3Rates of Petroleum Products and Electricity Supply703.2Programmes and Financing743.2.1Brief Introduction743.2.2On-going Energy Programmes Funded by GoSL763.2.3On-going Energy Programmes Funded by GoSL and Development Partners773.2.4Requirement for achieving the SEFA goals783.3Private Investment and the Enabling Environment863.4Gaps and mmendations883.5Energy Roundtable Initiatives by Government and Stakeholders893.5.1Energy Roundtable Recommendations90LIST OF TABLESTablePage1aKey Socio-Economic Indicators191bKey Historic Data on Socio-Economic Indicators192GDP% Share by Sector202
NATIONAL ENERGY PROFILE OF SIERRA LEONE [JUNE, 2012]3Budget Expenditure for 2009204Budget Expenditure for 2010215Summary of Domestic Development Expenditure for 2010216Summary of Domestic Development Expenditure for 2011227Transfers and Subsidies for 2011228Trend of Energy Consumption in Sierra Leone (2006 – 2011)249Structure of the Energy Consumption Pattern in Sierra Leone in 20112510Trend of Biomass Consumption in Sierra Leone (2006 – 2011)2511Petroleum Products Imported in Sierra Leone (2000 – 2011)2612Trend of Petroleum Products Consumption in Sierra Leone (2006 – 2011)2713Trend of Electricity (grid connected) Consumption (2006 – 2011)2914Installed Power Capacity in Sierra Leone as of May, 20122915Trend of Access to Electricity in Sierra Leone (2006 – 2011)3316Production of key Crops3917Synopsis of Potential Hydro sites in Sierra Leone since 19964118Activity Plan for Providing SEFA4719Detailed Activity Plan for the Short Term (2012 – 2015)5320Detailed Activity Plan for the Medium Term (2015 – 2020)5421Detailed Activity Plan for the Long Term (2020 – 2030)5622Summary of Planned Targets based on available Funds5823Projection of Electricity (grid connection) Install Capacity (2012 – 2030)5824Short Term Thermal and Renewable Power Sources (2012 – 2015)5925Medium Term Thermal and Renewable Power Sources (2015 – 2020)6126Long Term Thermal and Renewable Power Sources (2020 – 2030)6327Petroleum Products Pump Prices (2000 – 2011)7028Pricing Formula Revised using Platt’s Average 13 – 14 February, 20127129Pricing Formula Revised using Platt’s Average 5 – 16 March, 20127230Electricity Tariff (1996 – 2008)7331On-going Energy Programmes Funded by Government7632On-going Energy Programmes Initiated by Government and DevelopmentPartners7733Proposed SEFA Investment Requirement for Sierra Leone (2012 – 2030)7834Proposed Distribution of estimated Investment for Sierra Leone (2012 – 2030)7835Proposed detailed Investment Priorities in the Short, Medium and Long Terms793
NATIONAL ENERGY PROFILE OF SIERRA LEONE [JUNE, 2012]LIST OF FIGURESFigurePage1Map of Sierra Leone82Electricity Consumption Pattern by Sector (2000 – 2007)333Map of Sierra Leone showing Radiation Intensity424Two (2) Major Acts of the Energy Sector765Three (3) New Government Agencies for the Energy Sector68REFERECES92LIST OF CONTACTS PERSONS95ANNEXES1Report on the Sustainable Energy for ALL (SEFA) mission to SierraLeone 7th and 8th June 20124Page98
NATIONAL ENERGY PROFILE OF SIERRA LEONE [JUNE, 2012]ABBREVIATIONSAfDBAfrican Development BankBEFSBioenergy and food security projectBKPSBo-Kenema Power ServicesBHPBumbuna Hydro PowerBSLBank of Sierra LeoneCFLCompact Fluorescent LampCLSGCote’ D’voire, Liberia, Sierra Leone, GuineaCOP 152009 United Nations Climate Change ConferenceDiscoDistribution CompanyECOWASEconomic Community of West African StatesEEEnergy EfficiencyEFAEnvironmental Foundation for AfricaEFOEnergy for OpportunityEIBEuropean Investment BankEPPEmployment Promotion ProgrammeEPPEmergency Power ProjectEUEuropean UnionFDIForeign Direct InvestmentsFDPFarmer Development ProgrammeFAOFood and Agriculture OrganizationFFLSFarmer Field and Life SchoolGDPGross Domestic ProductGencoGeneration CompanyGIZGerman Technical CooperationGoSLGovernment of Sierra LeoneGTGGlobal Trading GroupGTIGovernment Technical InstituteGWhGegaWatt hourHOTHeads of TermsIELIncome Electrix LimitedIITInternational Institute of Tropical AgricultureIMFInternational Monetary FundIPPIndependent Power Producers5
NATIONAL ENERGY PROFILE OF SIERRA LEONE [JUNE, 2012]JICAJapanese International Corporation AgencyJRSJoint Research CentreKfWKreditanstalt fur WiederaufbauKvKilovoltFYFiscal YearLDCLeast Developed CountryLEDLight Emitting DiodesLPGLiquefied Petroleum GasMAFFSMinistry of Agriculture Forestry and Food SecurityMDGMillennium Development GoalsMEWRMinistry of Energy and Water ResourcesMoFEDMinistry of Finance and Economic DevelopmentMFOMarine Fuel OilMFPMultifunctional PlatformsMTMetric TonnesMTAMinistry of Transport and AvaitionMTIMinistry of Trade and IndustryMWMegaWattNAPANational Adaptation Programme of ActionNGONon-Government OrganizationNPANational Power AuthorityNRANational Revenue AuthorityO&MOperation and ManagementPRSPPoverty Reduction Strategy PaperPPPPublic-Private-PartnershipsPVPhoto VoltaicRET’sRenewable Energy TechnologiesSEFASustainable Energy for AllSEEA-WASupporting Energy Efficiency for Access in West AfricaSFYDPSafer Future Youth Development ProjectSLSierra LeoneSLIEPASierra Leone Investment and Export Promotion AgencySMESmall and Medium EnterprisesSPUStrategic Planning UnitSSLStatistic Sierra LeoneT&DTransmission and DistributionTOETonnes of Oil EquivalentUNUnited Nation6
NATIONAL ENERGY PROFILE OF SIERRA LEONE [JUNE, 2012]UNCTADUnited Nations Conference on Trade and DevelopmentUNDPUnited Nation Development ProgrammesUNIDOUnited Nations Industrial Development OrganizationUSUnited StatesUSDUnited States DollarWAPPWest Africa Power PoolWBWorld Bank7
NATIONAL ENERGY PROFILE OF SIERRA LEONE [JUNE, 2012]Figure 1: MAP OF SIERRA LEONESource: MEWR8
NATIONAL ENERGY PROFILE OF SIERRA LEONE [JUNE, 2012]BACKGROUNDRecognizing the importance and urgency of energy challenges, the United Nations GeneralAssembly last year declared 2012 the International Year of Sustainable Energy for All (SEFA).SEFA seeks to achieve three key objectives by 2030: (i) encourage universal access to modernenergy services, (ii) double the global rate of improvement in energy efficiency, and (iii) double theshare of renewable energy in the global energy mix. Sierra Leone is being considered to becomeone of the pilot countries of the SEFA initiative.In Sierra Leone, UNDP and UNIDO are co-leading the support to the implementation of the SEFAinitiative. As part of the process for the selection of potential first-movers, a mission was receivedin early June 2012 from the EU and UNDP to assess Government readiness and commitment to theinitiative.The provision of energy is vital for the realization of sustainable economic growth and humandevelopment. However, figures on energy consumption, production and challenges to access andproduction are rather outdated in Sierra Leone and do not reflect the present state of energy in thecountry. A first step to getting a good updated overview of the sector is the development of acomprehensive energy profile that describes energy consumption and production, trends andchallenges in meeting the energy needs of the country. Such a profile would form the basis forGovernment action and investment in this sector.Energy access is a high priority in the government’s Agenda for Change and the SEFA initiative is,therefore, timely for Sierra Leone. It is important to have a document reflecting the state of play inthe energy sector. An energy profile would serve to build readiness for the assessment mission, nextsteps recommended by the mission and a road map for strategic energy development in SierraLeone.This report provides an overview of the current national energy profile of Sierra Leone using theSEFA template. The data and information were collected through reports, meetings, and interviewswith authorities and relevant actors. Information collected from these sources has beencomplemented by desk research.9
NATIONAL ENERGY PROFILE OF SIERRA LEONE [JUNE, 2012]OBJECTIVEThe purpose of the Rapid Assessment and Gap Analysis is to provide:A brief look at the energy situation in Sierra Leone within the context of its economic andsocial development and poverty eradicationA good review of where Sierra Leone currently stands in terms of the three SEFA goalsA good estimate of the main challenges and opportunities vis-à-vis the three SEFA goalsand an assessment of where the major investments, policies and enabling environments willbe required, andA sound basis and background for an Action Plan that may follow as part of the SEFAactivities in Sierra Leone10
NATIONAL ENERGY PROFILE OF SIERRA LEONE [JUNE, 2012]EXECUTIVE SUMMARYSierra Leone is situated in Western Africa with a total land area of approximately 72,325 sq. km.According to Statistics Sierra Leone (2012), the population is estimated at 6.0 million in 2011 witha growth rate of 3.3%. The capital city of Freetown is located in the western area of the country andis home to approximately 1.25 million people ( 21% of the total population). Sierra Leone has atropical climate with hot and humid weather in the rainy season, which usually spans from June toNovember and a dry season, which typically spans from December to May. The country has anambient temperature range of 27 C - 35 C and relative humidity varying from an average of 80% inthe rainy season to about 50% in the dry season. The country has substantial deposits of mineralresources such as diamonds, rutile, titanium, bauxite, iron ore, gold, and chromium.Sierra Leone is considered by the UN classification as a Least Developed Country (LDC) withsignificant inequality in income distribution among its people. While it has substantial mineral,agricultural, and fishery resources, its economic and social infrastructure are not well developed,which hampers its economic development.Energy consumption in Sierra Leone is dominated by biomass, which accounts for over 80% ofenergy used. The largest source of biomass energy is wood fuel followed by charcoal. ImportedPetroleum Products are the next largest source of power at approximately 13%. Grid-generatedelectricity accounts for the remainder of the power supplied to the country’s citizens. Wood fuel isthe traditional form of energy and is used almost exclusively by households for cooking and craftactivities. Petroleum, on the other hand, is the most important source of energy for the modernproductive Energy Sector (including transportation and private electricity generation). Recently,foreign exchange difficulties have restrained Petroleum imports, which are currently subsidized byGovernment.Currently, the Electricity sub-sector in Sierra Leone faces challenges with less than 10% access.Efficiency and access are constrained by high technical losses on the T&D Network, which arefurther compounded by low voltage quality due to overburdening of infrastructure by illicit users.The stock of energy efficient appliances and equipment also remains low. Further, the developmentand use of Renewable Energy from Hydro, Solar, Biomass and other facilities has been a slowprocess.11
NATIONAL ENERGY PROFILE OF SIERRA LEONE [JUNE, 2012]Nevertheless, Sierra Leone has great potential in energy resources and opportunities for theproductive use of energy and development of energy facilities. Some of these opportunities include:the presence of strong political will, a stable political and security situation, a tropical climateconducive for solar, high levels of rainfall for hydro, the development of the West Africa PowerPool (WAPP), a large landscape of green vegetation for biomass, good working relationshipsbetween government and development partners and a good environment of doing business. SierraLeone requires huge investment support in the energy sector to meet the SEFA goals by 2030.Successful execution relative to the goals would mean increasing access to electricity to about100%, increasing energy efficiency to a level of 12-15% and increasing renewable energy level toabout 7,000 ktoe. Importantly, these stated objectives of the Government of Sierra Leone (GoSL)align completely with the goals of the Sustainable Energy for All (SEFA) Initiative.The level of energy consumption in the country has grown substantially between 2006 and 2011from 1,349 ktoe to 1,465 ktoe respectively. Nevertheless, there remains a huge gap of suppresseddemand for energy especially in the electricity sub-sector. Economic expansion in mining,agriculture and industry is also accelerating demand.To reach the SEFA goals and improve the country’s energy sector by 2030, it is estimated thatSierra Leone will require investment and/or financial support of approximately 7.8 billion over 18years.Currently, there are four ministries with an interest in implementing and supporting GovernmentEnergy Programmes including the Ministry of Energy and Water Resources (primary stakeholder),Ministry of Agriculture Forestry and Food Security, Ministry of Lands and Environment andMinistry of Trade and Industry. To ensure optimal coordination, the Ministry of Energy and WaterResources (with oversight responsibility) will lead the effort to ensure that the SEFA initiatives areimplemented in Sierra Leone.Improving the country’s energy sector is one of the Government’s foremost objectives. This criticalpriority was articulated in the Government’s Agenda for Change, which was unveiled in 2007.Beyond political support, the Government intends to devote financial resources to improving thesector because of the clear positive impacts on social and economic development. The Governmentis committed to working with the private sector, International Energy Development Programmesand the donor community to achieve these essential improvements.12
NATIONAL ENERGY PROFILE OF SIERRA LEONE [JUNE, 2012]As the Government effects the progression for the Agenda for Change to the transformative agendafor prosperity, the well-timed SEFA initiative provides a strong opportunity to accelerate thenational development agenda. As such, the Government embraces the goals of the SEFA initiativeand will do everything in its power to achieve critical targets by 2030. Of course, the ability of theGovernment to meet these targets will depend on funding as well as the growth of population, GDP,and access to essential technologies.13
NATIONAL ENERGY PROFILE OF SIERRA LEONE [JUNE, 2012]Section I: Introduction1.1 OVERVIEW OF SIERRA LEONE1.1.1 BRIEF INTRODUCTIONSierra Leone is situated in Western Africa with a total land area of approximately 72,325 sq. km.According to Statistics Sierra Leone (2012), the population is estimated at 6.0 million in 2011 witha growth rate of 3.3%. The capital city of Freetown is located in the western area of the country andis home to approximately 1.25 million people ( 21% of the total population). Sierra Leone has atropical climate with hot and humid weather in the rainy season, which usually spans from June toNovember and a dry season, which typically spans from December to May. The country has anambient temperature range of 27 C - 35 C and relative humidity varying from an average of 80% inthe rainy season to about 50% in the dry season. The country has substantial deposits of mineralresources such as diamonds, rutile, titanium, bauxite, iron ore, gold, and chromium.According to Statistics Sierra Leone (2004), the average population density is about 75 inhabitantsper square kilometres. Life expectancy at birth is 41.1 years and the fertility rate (i.e. births perwoman) is 6.5. The infant mortality rate is 165.4 out of 1,000 live births.Sierra Leone is considered by the UN classification as a Least Developed Country (LDC) withsignificant inequality in income distribution among its people. While it has substantial mineral,agricultural, and fishery resources, its economic and social infrastructure are not well developed,which hampers its economic development.The Gross Domestic Product (GDP) per capita of Sierra Leone was estimated to be around 482 US in 2011. The country has achieved relative stability in the post-conflict years and economicprospects appear to be improving. Still, the country faces a number of development challenges as itrecovers from the consequences of the armed conflict that devastated its economy andinfrastructure. A large fraction of government revenues still comes from development aid.The economy continued the strong recovery in 2011 with expansion in the agricultural and servicessectors supported by increased availability of electricity and the scaling up of infrastructureinvestments. The economy is estimated to have grown by 6 percent in 2011 from 5 percent in 2010.Domestic revenue increased during the past year, mainly as a result of tax collection efforts andone-off payments of signature bonuses from petroleum exploration activities. Inflationary pressureswere high during the first half of the year on account of the continued increase in the internationalprices of food and fuel and the consequent pass through into domestic prices. However, inflationarypressures eased in the second half of the year as international prices of commodities stabilized asmonetary and fiscal policies were tightened.14
NATIONAL ENERGY PROFILE OF SIERRA LEONE [JUNE, 2012]A number of Petroleum Exploration offshore oil discoveries were announced in 2009 and 2010. TheGovernment and Parliament have developed the Petroleum Policy for Sierra Leone in July, 2010and the Petroleum (Exploration and Production) Act 2011. The development of these reserves,which could be significant, is drawing serious attention from the Government of Sierra Leone.Furthermore, Sierra Leone has a significant infrastructure deficit in many sectors such as electricity,roads, water supply, ports and communications. In some sectors, such as telecommunications andport operations there has been an increase in private investment.More recently, some private investment has also targeted the energy sector (e.g. power plants andethanol production).1.1.2 ENERGYA key priority of government in 2009 was to strengthen the energy sector with the aim ofstimulating economic activities. To achieve this goal, the Government switched the budget of theMinistry of Energy and Water Resources from recurrent to domestic development expenditures inFY2009. Total revised budget for non-salary/non-interest recurrent expenditures allocated to theMinistry of Energy and Water Resources amounted to Le72.6 billion in FY2009.Government flexed the budget of the Ministry of Energy and Water Resources, specifically for theEmergency Power Project (EPP), when it was noted that the completion of the Bumbuna HydroElectric Project would be delayed from a couple of months in FY2009. As a result, the budgetexecution rate of the Ministry of Energy and Water Resources was close to the revised target with adeviation of only 5.6% below the revised budget in 2009. The total non-salary/non-interestrecurrent expenditures in the Ministry of Energy and Water Resources amounted to Le68.5 billionin FY2009 compared to the revised budget of Le72.6 billion. The EPP was to be discontinuedaround Q3, 2009 after the completion of the Bumbuna Hydro-electric project in FY2009. Butgovernment decided to extend the EPP programme to the end of FY2009 as a backstopping measurewhen it became apparent that the full commissioning of the Bumbuna Hydro Electric Project wouldbe delayed.Electricity grid generation increased by 3.1 percent to 175.7 GWh in 2011 compared to 170.5 GWhin 2010. Industrial consumption of electricity increased to 30.6 GWh from 24.9 GWh in theprevious year, an increase of about 23.1 percent. Line losses remained high estimated at about 40percent of units generated.The European Investment Bank (EIB) has disclosed plans to collaborate with other donor partnersnamely: the World Bank, African Development Bank (AfDB) and Kreditanstalt fur Wiederaufbau(KfW) in the area of Sierra Leone’s energy sector, through the West Africa Power Pool (WAPP)15
NATIONAL ENERGY PROFILE OF SIERRA LEONE [JUNE, 2012]Project. The EIB also intends to fund the feasibility studies of the electricity interconnection underthe WAPP, which will usher in a strategic power market for the region when completed.1.1.3 AGRICULTUREAgriculture and fishing are vital components of the Sierra Leonean economy. Agriculture is stillvery traditional and conducted in small-scale farms. The most important crops are rice, cassava,sweet potato and sugar cane. Other food crops grown in the country include maize, sorghum, fundi(cereal), and groundnuts. Cocoa and coffee, oil palm and kola nuts are grown largely for exports.1The fisheries sector has industrial and artisanal components. The industrial component is mainlydevoted to exports, employs substantially less workers than the artisanal one, but produces a highertonnage. The artisanal component, while engaging more workers, has a smaller output destinedmainly for domestic consumption.Data on coffee output were available for only four months of 2011. Production of cocoa hasincreased by 16.6 percent to 18,784 metric tons from 16,112 metric tons for 2010.Anecdotal evidence indicates an increase in domestic production of basic food crops including rice,cassava and sweet potato mainly as result of the increase in the supply of essential inputs such astractors, seeds, fertilizers, power tillers, combined harvesters, to farmers by Government andDevelopment Partners through the Small Holder Commercialisation Programmes and the RuralPrivate Sector Development Project.1.1.4 MININGThe mining sector is also in the process of recovery. The diamond industry is being reorganized,and Sierra Leone has signed up to the Kimberley process, which is a joint initiative involvinggovernments, the international diamond industry and NGOs to stem the flow of conflict diamonds.There is still smuggling, but government revenue from diamonds has increased in the recent past.Bauxite, Rutile and Iron Ore Mining have also restarted operations.Output of minerals remained subdued during the year 2011. With the exception of bauxite, theoutput of all other minerals declined during 2011. Production of bauxite increased by 35.2 percentwhile output of diamond fell by 19.6 percent, rutile by a marginal 0.3 percent, ilmenite by 12.57percent and gold by 35.4 percent. Iron ore production began in the last quarter of the year with anoutput of 137,910 metric tons by African Minerals Limited. London Mining Limited is in theprocess of making its first shipment.1National Investment Brief. SIERRA LEONE. High-Level Conference on: Water for Agriculture and Energy in Africa: theChallenges of Climate Change. Sirte, Libyan Arab Jamahiriya, 15-17. December 2008.16
NATIONAL ENERGY PROFILE OF SIERRA LEONE [JUNE, 2012]1.1.5 MANUFACTUREThe manufacturing sector was buoyant in 2011. With the exception of soft drinks and paint, theoutput of all manufactured goods increased during the year. The output of beer and stout grew by17.3 percent, maltina by 59 percent, cement by 3.3 percent, confectionary by 17.7 percent,acetylene by 8.5 percent, oxygen by 6.5 percent, common soap by 19.2 percent and flour by 66.2percent. The production of soft drinks and paint declined by 4.1 percent and 12.6 percentrespectively. The relatively improved performance of the manufacturing sector reflected theincreased availability of electricity and increased domestic demand. Industrial electricityconsumption rose significantly during the year.1.1.6 CONSTRUCTIONData on building permits issued in 2011 are not yet available. Another proxy for construction datamay be cement production. This proxy suggests growth in the construction sector, with productionof cement increasing by more than 3 percent over 2010.1.1.7 TELECOMMUNICATIONAmong six licensed GSM operators, three are in active operation (Africell, Airtel and Comium).The telecom sector continued to expand in 2011. Information provided by NationalTelecommunications Commission shows that as of July 2011, the total number of mobile phonesubscriptions stood at 3,039,522 compared to 1,752,607 in 2010. The overall tele-density increasedby 73 percent. Given that some individuals hold multiple handsets, the real increase in tele-densityis estimated at 35 -36 percent. There were 18 major licensed National Public Internet ServiceProviders and 64 licensed VSAT operators. The number of private VSAT authorizations withaccess to Broadband Internet Service is estimated to be more than 5,000.1.1.8 BANKINGThe number of commercial banks operating in the country remained unchanged at 13 in 2011. Thenumber of bank branches, however, increased from 80 at end 2010 to 87 in 2011. Deposit takingand lending activities by commercial banks have expanded rapidly. Total deposits held incommercial banks increased by 24 percent in 2011. Of the total deposits, foreign currency deposits17
NATIONAL ENERGY PROFILE OF SIERRA LEONE [JUNE, 2012]have increased by 29.3 percent. Credit to the private sector by commercial banks increased by 22percent to Le 1.07 trillion at end 2011 from Le 894.3 billion at end 2010. Credit to the agriculturalsector grew by 29 percent, mining by 79 percent, construction by 44 and energy, gas and water byover 237 percent relative to end 2010.1.1.9 TRANSPORTThe number of newly-registered vehicles has increased by 49 percent to 26,498 from 17,795 in2011. Newly-registered buses above 18 passengers increased by 96 percent and lorries with sixtyres increased by 76.7 percent while lorries with more than 6 tyres increased by 124.6 percent.Newly-registered tractors and trailers increased by almost 200 percent reflecting increasedeconomic activities in the agriculture, construction and mining sectors.1.1.10 TOURISMThe total number of visitors to Sierra Leone has increased by 35.8 percent to 52,442 in 2011 from38,615 in 2010. The increase in tourist visits was due the improved political and economic climateas well as the efforts by the tourist board to market the country a safe place for visitors.1.1.11 SOCIO-ECONOMIC DATAThe key socio-economic indicators of Sierra Leone for the periods (2007 – 2011) and for the 80’s &90’s respectively are shown in Tables 1a and 1b.18
NATIONAL ENERGY PROFILE OF SIERRA LEONE [JUNE, 2012]Table 1a Key Socio-Economic IndicatorsPopulation ( ActActActPrel.Annual percentage changeIncome and ExpenditureReal GDP (at Constant Prices)8.05.43.25.3Excluding Iron Ore6.06.0GDP Deflator6.69.28.617.017.9Nominal GDP/117.917.410.512.512.1Consumer Prices (end of period)13.812.210.818.416.9Consumer Prices (annual ,183.010,084.012,602.02,529.02,889.0Memorandum items:Gross international reserves (US millions)(in months of imports) 9/Excluding iron Ore, months of ImportsGDP (billions of Leones)6,345.07,304.0Excluding Iron Ore/4GDP (millions of U.S. dollars)2,126.02,447.02,400.0Per Capita GDP (US )357.0388.0421.0432.0482.0Source: Ministry of Finance and Economic Development, Bank of Sierra Leone and Statistics Sierra Leone. May, 2012Key Historic Socio-Economic Indicators Table 1b1980-19891990-1999averageaverage3,646,0GDP at market prices (billion of dollars) 1,31,12.88GDP per capita (dollars)364279,4482Real GDP growth (%)2,8-7,36,5IndicatorPopulation (millions)2011Source: Ministry of Finance and Economic Development, Bank of Sierra Leone and Statistics Sierra Leone. May, 201219
NATIONAL ENERGY PROFILE OF SIERRA LEONE [JUNE, 2012]Based on the data in table 2 (below), the GDP % contribution by sector shows that Agriculture,Forestry and Fishing are the highest contributors (ranged 55%-58%) whilst the Industry, Mining,Manufacturing and Energy are the lowest contributors (ranged 7%-10%).Table 2: GDP % SHARE BY SECTOR19801989average19901999averageGDP by sector %2007200820092010201142.540.9Agriculture, Forestry and Fishing5156585657Industry, Mining, Energy, 36353635Source: Ministry of Finance and Economic Development, Bank of Sierra Leone and Statistics Sierra Leone. May, 2012The Government budget and expenditure on the energy sector increased during the period from2009 through 2011 due to the high priority placed by His Excellency on improving the energysituation to create a positi
1.2.6 Electricity Situation in Sierra Leone 27 Section 2 CURRENT SITUATION WITH REGARD TO SEFA GOALS 30 2.1 Energy Access vis-à-vis goal of SEFA 30 2.1.1 Brief Introduction 30 2.1.2 Access to Mechanical Power 32 2.1.3 Access to Electricity
