Transcription
Enterprise Architecture in BankingBy Clive FinkelsteinContentsEnterprise Architecture in Banking . 1Contents. 1Introduction . 1Banking Case Study . 1Strategic Plan was the Catalyst for the Strategic Model. 2Subset of Strategic Model for the Bank . 2Identification of Business Activities at the Bank. 4The Strategic Model is a Common Communication Medium . 4Strategic Alignment of Bank to Strategic Model . 5Derivation of Project Plans from Strategic Model . 7Refinement of Business Activities from Strategic Model . 10Development of Project Maps for Rapid Delivery . 11Summary of Project Results for the Bank. 13Download Bank’s Enterprise Architecture Portfolio Plan Report . 13Clive Finkelstein . 14IntroductionThis month I will continue the series of articles on enterprise architecture.In my first article I introduced the basic concepts of enterprise architecture(see http://www.ies.aust.com/pdf-papers/bi-ea01.pdf) Last month Idiscussed the principles of strategic modeling for the rapid delivery ofenterprise architecture (see http://www.ies.aust.com/pdf-papers/biea02.pdf) This month I will show how these principles were used by aregional bank to manage its evolution to enterprise architecture by usingstrategic modeling to develop its enterprise architecture portfolio plan(EAPP) in just 20 days.Banking Case StudyThe banking case study in this series of real-world enterprise architecture projects was for aninnovative regional bank. Since 1994 this bank had used banking systems implemented usingdistributed client / server technologies, which was quite unusual for banks at the time. Most banksuse mainframe systems. In fact, in 1995 this bank was selected as one of the 100 mostinnovative installations world-wide by Computerworld USA.However these banking systems were found to be inflexible and unable to change to support theInternet. As a result, a project was initiated to redevelop these systems for electronic banking.This was a large project that used strategic modeling to develop project maps to manage theprogressive implementation for rapid delivery of priority banking systems.I discussed in my second article on strategic modeling the importance of developing an enterprisearchitecture portfolio plan (EAPP) [ED: Please insert a link to my second article in BI-EA02.doc].This is used to manage development of a project map for the rapid delivery of priority businessactivities and processes into production in 3-month increments. The EAPP is derived using entityPage 1
dependency analysis of the strategic model, as also discussed in that second article. We will seeexamples of project map derivation in this current article relating to the bank.The project team comprised banking experts as well as IT experts. An initial strategic model wasfirst developed in 1 day with the IT management project team, then refined and expanded in twofurther days in a facilitated strategic modeling session with bank managers and their businessexperts. I discussed strategic modeling in last month’s article [ED: please insert a link here to thearticle BI-EA02.doc]. The strategic model was entered into a modeling tool for the automaticapplication of entity dependency analysis and for development of the enterprise architectureportfolio plan (EAPP) documentation for the bank over a total elapsed period of four weeks. Theresults were then formally presented to managers and their business experts on the last day, forreview.The strategic information systems plan (SISP) of this project, as an example of an enterprisearchitecture portfolio plan (EAPP) report developed from the strategic model, can be read anddownloaded from the IES Web Site using links that I will provide at the end of this article.Strategic Plan was the Catalyst for the Strategic ModelThe catalyst for this strategic modeling project was the bank’s strategic business plan. Thisincluded its mission, vision and directions. It addressed the bank’s goals, objectives and definedkey performance indicators (KPIs). It covered strengths, weaknesses, opportunities and threats(SWOTs) of the bank.These planning statements were discussed by the bank managers and their expert staff in a 2day facilitated modeling session. (In last month’s article I discussed how a facilitated modelingsession is conducted, to define a strategic model.) As they agreed on key things that wereimportant to manage, the facilitator documented this on a whiteboard as a “picture of thebusiness”. This “picture” was the strategic model of the Bank.The strategic model that was developed was analyzed automatically by a modeling tool usingentity dependency analysis, as discussed last month. The results were documented in a strategicinformation systems plan (SISP) report. It identified priority databases and systems for earlydelivery. The project plans derived from the strategic model were then used for the precisemanagement of each of these early delivery sub-projects, as discussed shortly.Subset of Strategic Model for the BankPage 2
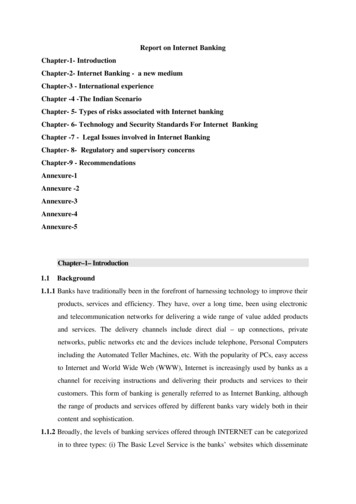
Figure 1: Part of the strategic model for the bankThe screenshot in Figure 1 is a subset of the bank’s strategic model. It indicates the key areasbased on the bank’s strategic plan. These are boxes in Figure 1, representing data entities.The lines joining related boxes you will recognize as associations or relationships. But to the bankmanagers these lines represent: management controls; reporting paths; communication paths;audit controls; security controls or governance controls that are needed in this “picture of thebank” to ensure that all required security, governance and audit issues are addressed. Thestrategic model shows the following: The bank is interested in many Markets. Each Market must have at least one Need thatthe bank can address, to be relevant to the Bank, as indicated by Market Need(highlighted in Figure 1). Each Market has many Customer Satisfaction Indices (CSIs) and a CSI can apply tomany Markets, as indicated by Market CSI. A Market has many Market Plans. Plan is outside the displayed screenshot, but Plan isalso related to Branch Plans – of which there are many for each Branch. For each Industry (outside the displayed screenshot) Industry Risk is also associated withMarket Plans. Industry also is related to Industry Needs. All of the above are time-dependent, as indicated by Period. They all must be managedclosely by the bank over time.As discussed in Figure 1, the bank had established the mandatory business rule that a Market –to be of interest to the bank – must have one or many Needs that the bank could address. ANeed also may be held by many Markets as shown in Figure 2.Page 3
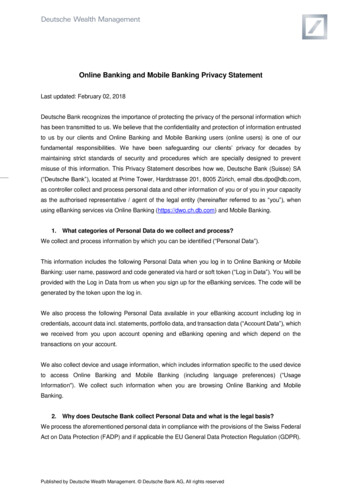
Identification of Business Activities at the BankFigure 2 shows the decomposition of this many to many association at the top of the figure intoan intersecting entity Market Need at the bottom: this represents the Market Need Activity. This isan important concept: the decomposition of many-to-many associations indicates (through theresulting intersecting entity) the existence of business activities, processes or systems.Figure 2: Identification of the Market Need ActivityThe Strategic Model is a Common Communication MediumThere is an interesting anecdote that I would like to share with you; this arose during the 2-dayfacilitated modeling session to define the bank’s strategic model. After the first two hours into thefacilitated session, when I had documented part of the strategic model on the electronicwhiteboard following discussion of their strategic plans, we stopped for coffee. We were in alarge auditorium (with tiered seating) in the bank’s head office. Over 50 of the bank’s seniormanagers attended this 2-day session, along with their expert banking staff. At the break, thecoffee was served to all of us at the back of the auditorium, way up high. I was dying for a coffeeand was about to climb the stairs when one of the bank managers came down to the front to askme a question.He pointed to a part of the strategic model on the whiteboard that was his area of responsibility inthe bank. He was very concerned about how other competitor banks, through the internet, couldattract his regional customers. I was able to answer his question by pointing to another part of thebank that was also represented in the strategic model.He had a further question, which I also answered from the strategic model. Soon we were in deepconversation for 15 minutes. I was dying for a coffee, when I noticed out of the corner of my eye,a group of bank staff by the coffee machine; they were pointing at the two of us way below in thedepths of the auditorium. They were laughing, which I thought was quite strange: in fact, it was alittle rude. And then it hit me why they were laughing Now let me tell you about the bank. The bank’s name was Kwangju Bank, in the city of Kwangju –a 40 minute flight south-west of Seoul in South Korea. The banker was talking to me in Korean;he knew no English. I was answering in English; I knew no Korean. This is what was apparentlyso humorous to the bank’s staff at the coffee machine. Yet he and I understood each otherperfectly: because we were both using a picture of the bank, its strategic model!!! We couldclearly see what the other was referring to, as the strategic model was a picture of the data andinformation used by the bank, together with clear representations of the business rules, thePage 4
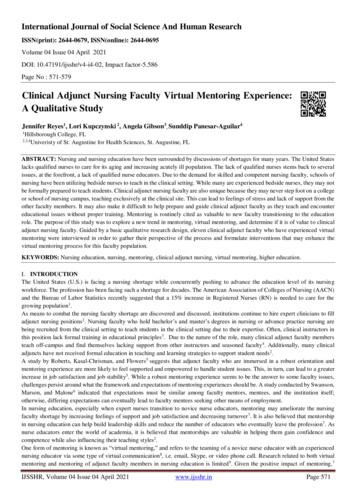
management controls, audit controls, security controls, reporting paths and governance controls.And then I thought:If he and I can understand each other using this common communication medium acrosslanguage barriers, there is indeed promise that management and IT will eventuallyunderstand each other, as they also both speak a different language.What was difficult in this enterprise architecture project was that the bankers had been discussingtheir strategic plan in Korean, which I do not understand. Fortunately, the sponsoring bankmanager spoke both Korean and English. He stood by my side, translating from Korean toEnglish so I understood what they were saying. He translated my questions from English toKorean and translated their answers back into English. This was not easy, but it worked. In fact, itwas the reason why I defined an initial strategic model on the previous day with the managementproject team. I was concerned that I had to communicate the strategic modeling principles (that Iintroduced in last month’s article) in business terms across this language barrier, I then used thisinitial strategic model as the catalyst to start the two-day facilitated session with all of the bankmanagers as discussed above.This highlights the importance of the strategic model: it is a common communication medium forall. We will see in the next topic that it later enabled the managers to evaluate the effectiveness ofsome of the planning statements in their strategic plan, to manage various activities in the bankthrough strategic alignment matrices derived from the strategic model.Strategic Alignment of Bank to Strategic ModelThe matrix in Figure 3 shows the Bank’s planning statements listed as goals and objectives downthe left as rows, with functional areas or business units of the bank listed across the top ascolumns (called “Model Views” in Figure 3).Based on the Zachman Framework, this matrix shows the alignment of business plans (in Col 6 –Why) with organization units (in Col 4 – Who). Reading across a row it indicates – with a tick ineach column – all of the business units that are involved in that objective. This answers thequestion: “who is involved in implementing that objective?” Reading down a column of Figure 3,the matrix indicates – with a tick in each row – all objectives where a business unit is involved.This answers the question: “why are they involved?”This is a matrix that is used to achieve strategic alignment, to ensure that all planning statementsare properly managed for effective implementation of the business plan. This and other strategicalignment matrices are an important deliverable of strategic modeling.Page 5
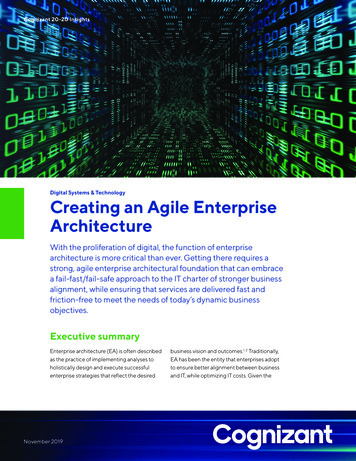
Figure 3: Coordination of goals and objectives throughout the bankWe can see in Figure 4 the effect of these strategic alignment matrices. This is the result of amatrix that aligns business plans in Col 6 (Why) with data in the strategic model in Col 1 (What),that is needed to support the achievement of those plans. The bidirectional alignment in Figure 4is achieved by a Planning Statement - Data matrix.In the planning dictionary (shown in the left window of Figure 4) the mission statement lists alldata needed to support that statement as “data links”. Those entities that are shown dimmed inthe screenshot are outside the organization unit that is being viewed – Marketing – which is thecurrent model view. Additionally, other model views that represent organization units involved inthat statement are also listed.Similarly the data dictionary window for Marketing (the right window of Figure 4) shows for MarketNeed that the mission statement is one of the statement links (Stmnt Links). It also shows otherorganization unit model views that share the data.These bi-directional links are important to know. They are automatically managed using strategicalignment matrices that are a deliverable of strategic modeling – as well as other matrices – foreffective strategic alignment.Page 6
Figure 4: Planning statements are aligned with the data that support those plansDerivation of Project Plans from Strategic ModelI will now discuss how the bank derived its project plans for rapid delivery into production of itspriority business activities as systems. The cluster report window in Figure 5 shows derivation ofthe project plan for the Market Need Activity sub-project. This project plan has been derivedautomatically from the strategic model by a modeling tool, using entity dependency analysis,which I discussed in last month’s article.The cluster in Figure 5 represents a sub-project, called Market Need Activity. The listed entities inthe cluster are all bold. This indicates that this is an independent, prerequisite sub-project that isreusable. The project plan is shown by phase numbers (followed by a right bracket) precedingeach listed entity. It indicates the sub-project phase when the attributes for that entity will bedefined during logical data modeling. It is listed with each higher phase number indented oneposition further to the right in Outline Format as follows:MARKET NEED ACTIVITY (derived)1)PERIOD2)NEED2)MARKET1)CSI3)MARKET NEED (MARKET NEED ACTIVITY)This derived project plan in Outline Format shows that, to implement this sub-project, MarketNeed (the End-Point entity) in Phase 3 is dependent on – reading up from the bottom: theCustomer Satisfaction Index, as CSI in Phase 1; as well al Market and Need, which are each inPhase 2; and also Period in Phase 1.Page 7
Figure 5: Derivation of project plan for the Market Need Activity sub-projectWe will later see this project plan also as a Gantt Chart in Figure 8. Furthermore, all of theseentities are bold, which indicates that this is an independent, reusable activity – as discussednext.Figure 6: Market Need Activity is a common, shared, reusable activityPage 8
The cluster report window in Figure 6 now shows that the Market Plan Activity is dependent onMarket Need Activity as a prerequisite reusable sub-project, as the latter sub-project entities areall shown NOT BOLD.This is an important principle of entity dependency analysis. By identifying Market Need Activityas a prerequisite sub-project, it is automatically enforcing the business rule that a Market musthave at least one or many Market Needs. We see this more clearly in Figure 7, where therequired entities for the Market Plan Activity are shown in red, and are printed as bold. Therequired entities for the Market Need Activity above are also shown as NOT BOLD.Figure 7: Derivation of project map for Market Need Activity and Market Plan ActivityAs discussed last month, this shows that the Market Plan Activity is dependent on Market NeedActivity as a prerequisite reusable sub-project. This is shown by the project map at the bottom ofFigure 7. We see that the Market Plan Activity is a Stage 2 sub-project. It is dependent on theMarket Need Activity, which is a prerequisite, reusable Stage 1 sub-project.The Market Plan Activity sub-project, including the Market Need Activity as a prerequisite subproject, is shown now in Figure 8 as a Gantt Chart.Figure 8: Market Plan Activity Gantt ChartPage 9
The cluster in Figure 8 clearly indicates the phase dependencies for later logical data modeling(Col 1 – What, Row 3 - Designer): to define the attribute detail of each entity. The duration of thedata modeling task for each entity is later derived based on rules of thumb according to theanticipated entity complexity, described in Chapter 7 of my latest book: “Enterprise Architecturefor Integration: Rapid Delivery Methods and Technologies”, by Clive Finkelstein, Artech House,Norwood MA (March 2006).Refinement of Business Activities from Strategic ModelFigure 9 documents Market Need and Market Plan activities. Previously, the Market Need Activitywas carried out in one part of the bank, while the Market Plan Activity was carried out in adifferent organization unit. The activity description for Market Plan Activity as documented inFigure 9 shows that:“This plan addresses the needs of each market, whether domestic or overseas, for bankingand financial products and services”.Figure 9: Definition of the Market Need and Market Plan activitiesHowever, in the strategic review session four weeks after the facilitated modeling session, thebank managers realized that this coordination was not being done in practice. In fact, these twoparts of the bank never communicated with each other! As a result, market plans were introducedwithout any awareness of the needs of the relevant markets. This explained the reason for somedisastrous market plans that had been implemented, but which were later found to be out of touchwith relevant market needs.The managers immediately corrected this oversight in the first paragraph of Figure 10, whichfirmly aligned the marketing plans with the identified market needs. But the second paragraph ofFigure 10 was even more dramatic.The bank had originally initiated this project because they were very concerned that overseasbanks could use the Internet to steal their regional customers. In the second paragraph of Figure10 they expressed their realization – following the development of the strategic model and itssubsequent analysis – that the bank indeed had more to gain from the Internet than the possibilityof losing some regional customers.They could instead use the Internet themselves to acquire overseas customers from the overseasbanks, as indicated in the last sentence of Figure 10. With this recognition by management, thePage 10
bank’s focus immediately changed from treating this as a defensive enterprise architectureproject, instead to an offensive project.Figure 10: Corrected activity descriptions by managementThis was a key strategic change of direction for the entire bank and resulted in a major revision ofits strategic plans. Subsequently, through this overseas market expansion the bank was able togrow rapidly and bypass many of its country competitors.Development of Project Maps for Rapid DeliveryTogether with the project plan analysis and review discussed above, a summary project map wasdeveloped as shown in Figure 11. This summarizes the detailed project maps shown in Figure 12and also in Figure 13.Figure 11: Summary Project map for rapid delivery of priority activities into productionIn the strategic review session senior management examined the Summary project map in Figure11, the Customer Management project map in Figure 12 and the Product Management projectmap in Figure 13 to identify priority activities for early delivery.The Customer Management project map in Figure 12 was identified as the highest priority areaby management. The Customer Management and Customer Risk Management sub-projectswere the focus for subsequent priority logical data modeling sub-projects.Page 11
Figure 12: Project map of Customer Management business unit, for rapid delivery ofpriority activities as systems, into productionThe project map in Figure 12 indicates the staged sequence for each Customer Managementsub-project and related sub-projects, shown as smaller boxes within the larger business unitboxes. The connecting arrows indicate the necessary order of implementation. Implementationcan be by developing new systems if necessary, or alternatively by interfacing to reuse existingsystems: which can be either automated or manual. Or it can be implemented by interfacing tothird party banking packages.Figure 13: The Project Map of the Product Management business unit for rapid delivery ofpriority activities as systems, into productionPage 12
The project map in Figure 13 is for the Product Management area of the bank. This was identifiedas the next highest priority area by management. It indicates the staged sequence for eachProduct Management sub-project and related sub-projects, shown as smaller boxes within thelarger business unit boxes. The connecting arrows indicate necessary order of implementation.Again, this implementation can be by developing new systems if necessary, or alternatively byinterfacing to reuse existing systems: which can either be automated or manual. Or it can beimplemented by interfacing to third party banking packages.This bank project is fully documented on the Internet. It is available to be downloaded as a PDFEAPP Report for offline reference. Two documents are provided. The first is a News Release inPDF of the project, downloaded from pdf. Thesecond document is the original strategic information systems plan (SISP) report in English, to bedownloaded as an example of an EAPP report from df. It includes a cover page for each appendix, describing the content of the appendix andhow it is used. The appendix contents are confidential to the bank and so have not been placedon the internet. The IES web site at http://www.ies.aust.com/ includes descriptions of many otherprojects, accessible via the Projects link from any page.Summary of Project Results for the Bank1. The total elapsed time from start to finish of the complete strategic modeling project, withall analysis, was four weeks – 20 days, for the development of the strategic model anddocumentation of the EAPP.2. The first priority business unit was the Customer Management sub-projects and relatedsub-projects, shown in Figure 12. This was defined to attribute detail through logical datamodeling over a further 3 months.3. The second business unit was the Product Management sub-projects and related subprojects, shown in Figure 13. This was defined to attribute detail through logical datamodeling also over 3 months.4. These two business unit sub-projects then both proceeded into process modeling over afurther six month period.5. This was later followed by progressive implementation in Java.Today, with the availability of Web Services and SOA technologies, the bank likely would take adifferent approach. They would bypass the process modeling in step 4 above: they would insteaduse activity modeling and activity based costing, together with workflow modeling. They woulduse modeling tools that support Business Process Modeling Notation (BPMN) to model theseworkflows. They would then automatically generate executable XML-based Business ProcessExecution Language (BPEL) code from the workflow models, for direct execution using BPELengines.I cover these rapid delivery technologies in Part 3 of my book: “Enterprise Architecture forIntegration: Rapid Delivery Methods and Technologies”, by Clive Finkelstein, Artech House,Norwood MA (March 2006). I will cover these technologies in a later monthly article.Download Bank’s Enterprise Architecture Portfolio Plan ReportAs discussed earlier, this project was for Kwangju Bank – in the city of Kwangju in South Korea.The strategic information systems plan (SISP) of this project, as an example of an enterprisearchitecture portfolio plan (EAPP) developed from the strategic model, is on the IES Web Site athttp://www.ies.aust.com/ies-projects/project references.htm. The news release of the project canPage 13
be downloaded in PDF from pdf. The SISPReport of this commercial bank project can be downloaded as an example of an EAPP Report inPDF from pdf. It includes a number of appendixcover pages that describe the content of each detailed appendix in the report. However, you willunderstand that for reasons of Bank Confidentiality, these appendices have not actually beenpublished to the Internet.Clive FinkelsteinClive Finkelstein is acknowledged worldwide as the "father" ofinformation engineering, and is Managing Director of InformationEngineering Services Pty Ltd in Australia. He has more than 45years of experience in the computer industry. Author of many booksand papers, his latest book, Enterprise Architecture for Integration:Rapid Delivery Methods and Technologies, brings together themethods and technologies for rapid delivery of enterprisearchitecture in 3-month increments. Read the book review athttp://www.ies.aust.com/ten/ten32.htm. Project references, projectsteps and descriptions are available from http://www.ies.aust.com.Click on the Projects link from any page. Clive may be contacted atcfink@ies.aust.com.Page 14
Enterprise Architecture in Banking By Clive Finkelstein . ea02.pdf) This month I will show how these principles were used by a regional bank to manage its evolution to enterprise architecture by using strategic modeling to develop it