Transcription
Institut für VerfahrenstechnikProf. S.E. Practica in Process Engineering IIPraktikum “Mechanical Engineering”Spring semester 2016FiltrationSupervisor:Georgios SotiriouML F18georgios.sotiriou@pharma.ethz.chTel.: 044 632 68 521
Institut für VerfahrenstechnikProf. S.E. Practica in Process Engineering II1 Table of Contents1TABLE OF CONTENTS . 22INTRODUCTION . 33EXPERIMENTAL . 83.1Suspension preparation . 83.2Filter placing. 83.3Measure suspension flow rate under constant pressure . 93.4Measure the pressure-drop under constant flow-rate . 93.5Shutting down and cleaning . 94REPORT. 104.1Specific tasks (in results and discussion) . 104.1.1 Constant pressure-drop measurements . 104.1.2 Constant flow-rate measurements . 114.2Final discussions . 135LIST OF SYMBOLS . 146CONSTANTS AND GEOMETRICAL DATA . 177BIBLIOGRAPHY . 17Please note:This is a very brief summary of the filtration description in German. Fortheoretical background in English please refer to Ullmann’s Encyclopedia ofIndustrial Chemistry, available online on www.ethbib.ethz.ch. Alternatively, you mayask your assistant for a hardcopy.2
Institut für VerfahrenstechnikProf. S.E. Practica in Process Engineering II2 IntroductionIn many industrial processes dispersions of particles in a fluid (liquid or gas)need to be separated from their fluid, either for the removal of valuable product or forcleaning of a product liquid (e.g. water purification). One of the basic procedures forthis is filtration.In this filtration practicum we will investigate the separation of CaCO3 particlesfrom an aqueous suspension (solid-liquid system) by filter pressing. Two differentoperation modes will be used: a) constant pressure drop and b) constant suspensionvolume flow rate.The suspension flow rate will be measured during constant pressure filtrationwhereas pressure drop across the filter is measured during constant suspensionflow experiment. Information related to the structure of the resulting filter-cake canbe extracted from this data.In the following you will find the equations based on the classic differentialequations for cake-filtration:Darcy’s law describes the flow of a liquid through a porous medium:Vf AF k Δp hkΔp h η k k η (1)Here the term η * {hk / k * η } describes the total resistance against flow throughthe filter. This law can be used to describe the build-up of a filter cake.The resistance term η * {hk / k * η } is now separated into a filter mediumresistance βM and a filter cake resistance αc * hk. Here, αc is the height specific cakeresistance and hk is the (time-dependent!) cake height.{hk / k * η} (βM αc * hk)Combining equation (1) and (2) results in3(2)
Institut für VerfahrenstechnikProf. S.E. Practica in Process Engineering IIVf AF 1 dVfΔp AF dtη (βM α C hk )(3)For the integration of the differential equation (3) the following assumptions aremade:a)The filtrate flow is laminarb)The built filtercake is incompressible, therefore its porosity is independentof the pressure (αc const).c)The resistance of the filter medium βM is constant for the whole filtrationprocess.d)The filter efficiency is 100%Based on these assumptions equation (3) can be integrated. The cake height hkis eliminated by a mass balance over the solid material:(4)A F h k (1 ε) ρsolid Vf cSubstituting hk from equation (4) into equation (3):1 dVf A F dtΔpαC c Vf η βM ρsol (1 ε) AF Δp c Vf η βM α AF (5)In equation (5) the term αc / ρsol (1-ε) is replaced by the area specific cakeresistance α, which (for convenience) will be called cake resistance from now on.In this practicum two approaches will be used to solve equation (5):a) p i.e. the filtrate volume flow rate decreases over time4
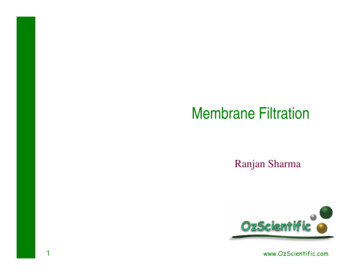
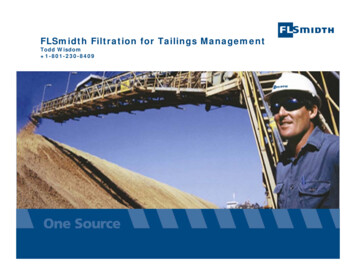
Institut für VerfahrenstechnikProf. S.E. Practica in Process Engineering IIb)Vf* dVf / dt i.e. the filtration pressure increases over timeFollowing a), the solution for p :For integration of (5) with the boundary conditions Vf 0 at t 0 : α c η Vf βM dVf dtA F Δp AF (6)V α c fη2 V βM Vf tA F Δp 2 A F f (7)0t (η α c Vf2 2 AF βM Vf)2F2 A Δp(8)For a graphical analysis of (8) use the following:η β Mtη c α Vf 2Vf 2 A F ΔpA F Δp(9)A graphic representation of t / Vf as function of Vf gives a straight line (Figure 4).From the slope the cake resistance α can be calculated, while from the intercept thefilter medium resistance βM can be found.5
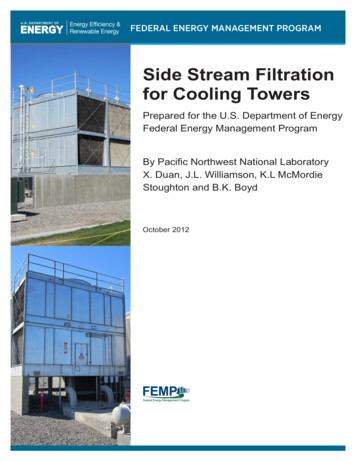
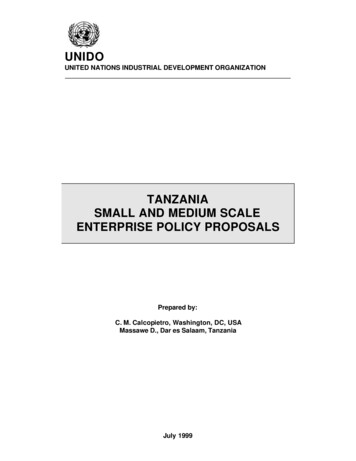
Institut für VerfahrenstechnikProf. S.E. Practica in Process Engineering IItVfαβMVfFigure 4:t / Vf vs Vf for p Following b), the solution for Vf* dVf / dt :With Vf t . Vf* from (5) you get:Δp(t) η α c Vf 2A2F t βM η Vf AF(10)This means the pressure increases linearly with time. By plotting p as functionof t you can determine α as well as βM (Figure 5).6
Institut für VerfahrenstechnikProf. S.E. Practica in Process Engineering IIΔpαβMtFigure 5: p versus t, for Vf* Plotting the specific cake resistance α from different experiments at differentconstant p in double logarithmic scale as function of p, you will find a near tolinear dependency according to the following formula:α α o (Δp / Δpo ) n(11)From this you can calculate the compressibility n:n log α / α o(12)log Δp / ΔpoFor incompressible filter cakes n becomes 0, for compressible cakes n increasesfrom 0 to approximately 1.2. At n 1 the filtrate volume is after a certain time quasiindependent of the filtration pressure.7
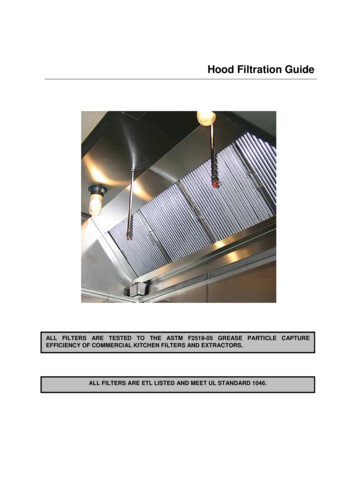
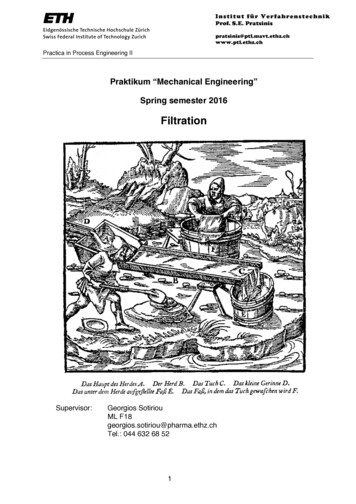
Institut für VerfahrenstechnikProf. S.E. Practica in Process Engineering IIFigure 7: Piping and Instrumentation diagram (P&ID) of the plate filter setup.3 ExperimentalFigure 7 shows the piping and instrumentation diagram of the filter press usedfor the experiments. Make yourself familiar with the setup before operation. Find therelevant valves and its proper position on the P&ID for the two modes of operation.3.1Suspension preparationWeigh 250 g of CaCO3, add some water and stir to make a rather thick presuspension. Before water is filled in through valve B, make sure the outlet valve A isclosed and the pressure release valve of the stirrer tank is opened properly. Then fillapproximately 60 L of water through valve B and add the pre-suspension throughvalve B as well and fill in water until 70 L are in the tank. Start the stirrer C and therecirculation pump D to achieve a homogeneous suspension.3.2Filter placingCheck that the filter (degas) valves E are closed. Place the filter between theplates (smooth surface towards the incoming flow). Press the plates together with8
Institut für VerfahrenstechnikProf. S.E. Practica in Process Engineering IIthe clamp. After the filter is wetted it might be needed to reinforce the clamppressure as the filter settles a bit when wet.3.3Measure suspension flow rate under constant pressureFirst close the pressure release valve E and the filling valve B on the tank.Switch the pressurized air supply on (main valve on the wall). Next, the tank needsto be pressurized to the required pressure level for the corresponding experiment.This can be done by adjusting the pressure control valve (PIC). Turning clockwisewill increase the pressure and vice versa (please lift the red plastic ring whileadjusting). Air flows into the tank and fills up the volume above the liquid (give itsome time to reach equilibrium). Once the tank is pressurized, check that the flowthrough the flow controller (FIC) is bypassed. Let some suspension pass through thefilter press by opening the final valve to the plate filter (valve J) and simultaneouslyopen the degas valves E until suspension runs out. Close degas valves and start themeasurement.Measure the flow under constant pressure for 8-12 minutes, recording the flowrate every 15 s. For the first experiment choose p 1 bar.Change the filter (release overpressure through valve E before opening thepress) and redo the measurement at p 2 bar (set valve F to 2 bar). After thesecond experiment you have to drain the remaining suspension in the tank throughvalve A and prepare a new 70 L batch of suspension. Change the filter and redo themeasurement at p 3 bar (set valve F to 3 bar).3.4Measure the pressure-drop under constant flow-rateSet the pressure to 3 bar (valve F) and replace the filter. Set the flow rate on theFIC to 80 l/h. Open the path leading through the flow meter (G) and close the paththrough the bypass line.Measure the pressure drop during approximately 10 minutes every 15 s. After allexperiments have been carried out you can compare the appearance of the filtercakes like cake thickness and porosity.3.5Shutting down and cleaningClose the valve to the pressurized air (F). Drain the rest of the suspension byopening the valve A. Shut down the stirring (C) and suspension circulation (D).Disconnect all electrics (stirring, pump, flow and pressure-meters). Clean theworking place.9
Institut für VerfahrenstechnikProf. S.E. Practica in Process Engineering II4 ReportEach member of the group has to write his/her own individual report. Thereport should be approximately 8 pages long and include the following chapters:4.11.Abstract (describe shortly what was done and what were the majorfindings)2.Theory (equations which will be used in the result part must beintroduced)3.Experimental (describe the experimental procedure)4.Results (plot the result curves and perform the needed calculations)5.Discussions (discuss the results and refer to literature if needed)6.Conclusions (what are the discoveries of the experiment, what does itmean in practice)Specific tasks (in results and discussion)4.1.1 Constant pressure-drop measurementsa) Neglecting the filter resistance βM in equation (8), the filtration for constantpressure is then described byt η c α V f22 AF2 Δp(13)Vf2 t Δp AFc η α(14)Plot the filtrate volume Vf [m3] per filter area Af [m2] as a function of time t [s] indouble logarithmic scale. Following equation (13) you should get a lineardependency with a slope of 0.5. Discuss the results and draw some qualitativeconclusions from the plotted results.10
Institut für VerfahrenstechnikProf. S.E. Practica in Process Engineering IIb) Plot t/Vf [s/m3] as a function of Vf [m3] and find the specific cake resistance αfrom the regression. Additionally, determine the resistance of the filter medium βM(m-1), for each pressure drop 1, 2 and 3 bar by using equation (9). Discuss theresults.c) Plot the pressure drop !p (Pa) as a function the time t (s) . Find the filter resistance, "-2(m4.1.2), and Constantresistance ofthe filter measurementsmedium, # (m-1), using the graph and equation.flow-ratec) Plot the pressure drop p [Pa] as a function the time t [s]. Find the cake3-2whereVf* (m) isresistancethe total filtratevolumewhichhas passedthemediumfilter at timet -1), usingspecificfilterαC [m], andresistanceof throughthe filterβM (m(s).the graph and equation (10) where Vf* [m3/s] is the filtrate volume flow.d) Solve the compressibility n using:n! ! o "( #p / #po )and d) Solve the compressibility n [-] using equation (11) or (12).n log ! / !ologe)#p/ #ptheFindporosity ε (ratio of void volume to total cake volume) of the filter cakeousing the Carman-Kozeny theory. Carman (1939) calculated the pressure loss in thee) Find the porosity (ratio of void volume to total cake volume) ( ) of the filter cake usingbulk and modeled the porous filter cake as numerous continuous parallel channels.the Carman-Kozeny theory shown below:The pressure loss in such channels is:Carman (1939) calculated the pressure loss in the bulk and modeled the porous filter cakeas numerous continuous parallel channels. The pressure loss in such channels is:#p Kanalρ liq 2hΔp Kanal liqξ (Re) hk v Kanal k2 % (Re) "v Kanal " 2dh2(15)dhpressure drop coefficient (here 64/Re)Channel mean velocityHydraulic diameterFilter cake s here 64/Re (laminar flow)Reynoldsfor suchchannelis:Re v Kanal " d h " liqThe &Reynolds number for such channel is:And the mean velocity in the
filter press by opening the final valve to the plate filter (valve J) and simultaneously open the degas valves E until suspension runs out. Close degas valves and