Transcription
ReviewCHROMATOGRAPHY, Vol.33 No.2 (2012)ReviewValidation of analytical procedures by high performanceliquid chromatography for pharmaceutical analysisMasato Kazusaki, Shinji Ueda, Naoto Takeuchi, Yasutaka OhgamiInvestigational Drug Quality Assurance, Technology Research & Development, Dainippon Sumitomo Pharma Co., Ltd.3 1 98 Kasugade naka, Konohana ku, Osaka 554 0022, JapanAbstractHPLC analysis is the critical factors in the drug developing process, and it is important to ensure the reliability of the analytical procedure toobtain meaningful data. The International Conference on Harmonization (ICH) has recognized the importance of validation concerning analytical procedures, and issued the guideline on Validation of Analytical Procedures (Q2) as a frame work for the validation study. This reportcomplements the ICH guideline Q2, and provides practicable means for validation study focusing on the analyses by HPLC.Keywords : validation, ICH, specificity, linearity, accuracy, precisionprocedures are classified into four categories. These four types ofIntroductionValidation of analytical procedure is the process for proving thatanalytical procedures are: 1) identification tests, 2) quantitativean analytical procedure is suitable for its intended purpose. Resultstests for impurities, 3) limit tests for the control of impurities, 4)obtained from method validation study can be used to judge thequantitative tests of the active moiety in bulk active pharmaceuticalquality, reliability and consistency of analytical results.ingredient, formulated product, or other selected components in theSeveral articles have been published on the requirements of vali-formulated product. The assessment of validation characteristicsdation for analytical methods [1,2]. Green gave a practical guideshould be based on the intended use of the method, and the level offor analytical method validation with a set of requirements for astringency is proportional to the criticality of the analytical proce-method [3]. For the pharmaceutical industry, guidelines from thedure in measurement. The ICH also recognizes that it is not alwaysFDA [4 6] and US pharmacopoeia (USP) [7] provide a frameworknecessary to evaluate every validation characteristics. For identifi-for performing validation study. Unfortunately, some of the defini-cation test, only the validation characteristic of “specificity” shouldtions vary between the different organizations. To achieve har-be established. Table 1 shows the two types of the analyticalmonization for pharmaceutical applications, International Confer-method for chromatographic analysis, such as assay method forence on Harmonization (ICH) was organized, and representativesmeasurement of the active moiety and impurity method for deter-from the pharmaceutical industry and regulatory agencies from themination of target compounds at trace level, and validation charac-United States, Europe and Japan defined validation characteristics,teristics to be investigated. For assay method, evaluation of detec-requirements and methodology for analytical methods validation.tion limit (DL) and quantitation limit (QL) is not essential, becauseFor pharmaceutical analyses, an ICH guideline (Q2 (R1): Text onthe target compound to be measured exists at high level. For quan-Validation of Analytical procedures and Methodology [8]) was is-titative analysis, a determination of DL is not necessary. There aresued for performing validation study. In this guideline, analyticalno official guidelines on the sequence of validation experiments,Corresponding author: Masato KazusakiTel: 81 6 6439 8139Fax: 81 6 6466 5430E mail address: masato kazusaki@ds pharma.co.jp―65―
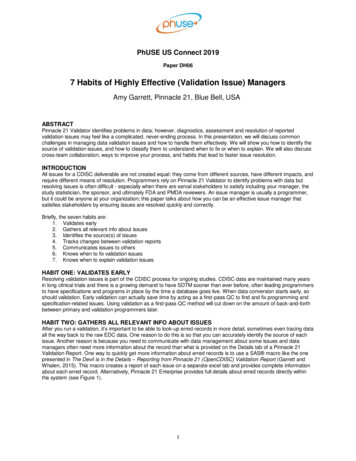
CHROMATOGRAPHY, Vol.33 No.2 (2012)Table 1. Validation characteristics for chromatographic analysis.Type of methodAssay method for the bulk active pharmaceutical ingredientType of analysisQuantitative analysis by HPLCSpecificityDetection limitQuantitation limitLinearityAccuracyPrecisionRangeImpurity method for the trace compoundsQuantitative analysis by HPLCLimit testing by TLC / and the optimal sequence may depend on the analytical procedure.for baseline noise and the response to specified compounds shouldBased on the authors’ experience, for conducting the validation ofbe verified.a liquid chromatographic method, the following sequence would beBefore undertaking the validation study, it is necessary to verifyuseful: specificity, detection limit and/or quantitation limit, linear-that the analytical system is adequately designed, maintained,ity, accuracy, precision.qualified. ICH has published the guideline Q 7 [9] in which qualifi-In the ICH Q2 guideline, validation characteristics to be investi-cation of instruments are described to ensure the appropriateness ofgated are all listed, but the acceptance limit for any items are not il-the analytical instruments. During the qualification stage of analyti-lustrated as an example. In addition to this, actual procedures to becal instruments purchased from the vendor, installation qualifica-conducted are not stated in detail. Vagueness in the ICH Q2 guide-tion (IQ), operational qualification (OQ) and performance qualifi-line necessitates effective protocol design. A well designed experi-cation (PQ) should be carried out. The IQ establishes that the in-ment and statistically relevant approaches will facilitate the valida-struments are well received as designed and specified, and that it istion study on analytical procedure in accordance with the ICHinstalled properly. The OQ ensures that modules of the HPLC sys-guideline. This report describes approach for performing validationtem operates accurately and precisely according to the definedstudies on the analytical procedure by HPLC. Acceptable criteriaspecifications concerning some parameters, such as the flow ratefor each validation characteristics are also suggested in this report.for the pump, the injection volume for auto sampler, temperatureApproaches described in this report would be applicable to othercontrol for column oven, wavelength for UV detector, etc. The PQanalytical techniques for biological samples and environmentalverifies the system performance. These steps are usually employedanalyses.to verify that the system is adequate for the analysis to be performed.Pre validation requirements2. Stability of the analyte(s) in the solutionsChemicals, such as reagents and standards, should be availablein sufficient quantities, accurately identified, sufficiently stable andSome analytes in the solution might decompose prior to chroma-checked for purity. Other materials and consumables, for example,tographic investigations, for example, during the preparation of thechromatographic columns, should be qualified to meet the col-sample solutions, extraction, cleanup or storage in the vials (in re-umn’s performance criteria. The validation experiments should alsofrigerators or in an automatic sampler). To generate reproduciblebe carried out by an experienced analyst to avoid errors due to in-and reliable results, the stability of the analyte(s) in the solutions,experience.and that of mobile phase must be determined prior to initiating thevalidation studies.Validation on the analytical procedure should be performed withhomogeneous samples, and validation data should be obtained byIn many cases, samples are analyzed overnight using HPLC sys-repeatedly analyzing aliquots of a homogeneous sample, each oftem equipped with the auto sampler. For the assay method for bulkwhich has been independently prepared according to the analyticalactive pharmaceutical ingredient or the impurity method for tracemethod procedure.compounds (impurities and contaminants), the analyte(s) in thesample solutions and the standard solution should be stable for 48hours under the defined storage conditions. Mobile phases have to1. Analytical equipment qualificationSatisfactory results of validation study can be obtained only withbe stable for at least 48 hours. Acceptable stability criterion for thethe equipment that operates well. For example, if detection limit isassay method is not more than 2.0% change in peak areas obtaineda critical factor for a specific method, the instrument’s specificationfrom the stored solutions, relative to those from the solutions―66―
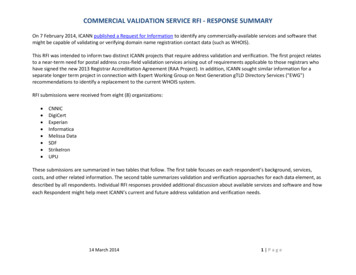
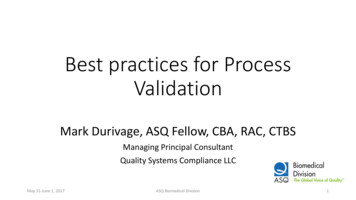
CHROMATOGRAPHY, Vol.33 No.2 (2012)Masato Kazusaki, Shinji Ueda, Naoto Takeuchi, Yasutaka Ohgamibe optimized for best separation.freshly prepared. As for the impurity method, acceptable stabilitycriterion is not more than 10% change determined in the same waySpecificity can be demonstrated by analyzing the samples con-to the assay method. If the analyte(s) in the solutions are not stabletaining impurities or other materials spiked onto the analyte(s) ofat room temperature, then decreasing the storage temperature to 2 interest. It is not necessary to spike potential interfering substances8 C may improve stability of the solutions. The mobile phase isthat do not reasonably exist in the testing samples. The degradationconsidered to be stable if the stored mobile phase produces theproducts could be generated by storing the analyte under the stressequivalent chromatogram to that obtained with mobile phaseconditions sufficient to degrade it to approximately 90% purity.freshly prepared. Assessment should be performed based on capac-Typical stress conditions for generation of degradation products fority factors, resolution and tailing factors.bulk active pharmaceutical ingredients are heat (50 C, 60 C), light(6500 lx of ultraviolet light), acidic condition (in 0.1 mol/L hydrochloric acid solution), alkaline condition (in 0.1 mol/L sodium hy-Protocol on analytical validationThe protocol on the validation study should include the follow-droxide solution), and oxidant (in 3% hydrogen peroxide solution).ing points in the validation study: 1) the purpose and scope of theFor formulated products, heat, light and humidity are the factors ofanalytical method, 2) the type of analytical method and validationsevere conditions. Resulting mixtures should be analyzed, and thecharacteristics, 3) acceptance criteria for each validation character-analyte peak is evaluated for peak purity and resolution from theistics. Consideration on the following points will be useful to pre-nearest eluting peak. For biological analysis specificity studiespare the protocol.should also be extended to assess interferences that may be caused・What type of the samples will be measured by the analyticalby the components in urine, blood, etc. Optimized sample preparation can eliminate most of the matrix components.method? Will the samples be whole blood, serum, plasma, purified protein, chemicals? Are there interfering substances con-In chromatographic analyses, it is difficult to ascertain whethertained in the samples, if so, should they be detected or quanti-the peaks in a chromatogram are pure, or consist of more than onefied?compound. In the past, chromatographic parameters such as mobile・What is the expected concentration range?phase composition were modified in order to investigate the peak・What level of specificity, detection limit or quantitation limit,purity. Recently the ultraviolet/visible diode array detectors arelinearity, accuracy and precision is required?being used. The level of impurities that can be detected with thisThe purpose of answering the questions described above is toinstrument depends on the spectral difference, on the detector per-determine how best to meet the objective of the validation for ana-formance and on the software algorithm. Under ideal conditions,lytical procedure. If the method is intended to quantitate the activepeak impurities at the level of 0.5% can be detected.pharmaceutical ingredient in the pharmaceuticals, or impurities atAn example of specificity criteria for an impurity method for de-trace level, the method is categorized into the quantitative assaytermining trace amounts of compounds is that the resolution factorsmethod, as shown in Table 1. If the method is intended to serve asare at least 1.2 among all the potential impurities that generateda limit testing, the method is a qualitative method.over the level of 0.1% in the stress conditions. For assay method,the resolution factor between target compound and impurities is atleast 1.5. The desirable separation is shown in Figure 1.Validation procedureIn this section, we describe the meaning of the validation charac-Once acceptable resolution is achieved for the analyte and poten-teristics, and the actual approaches to perform the validation stud-tial impurities, the chromatographic parameters, such as mobile ies. An example of the acceptable criteria is also described.phase composition, flow rate, and detection mode, column type,should be considered to be set.1. Specificity2. Detection limit and quantitation limitSpecificity of the chromatographic analytical procedure is theability to measure the analyte response in the presence of all poten-The detection limit (DL) of an analytical procedure is the lowesttial sample components such as the starting materials, intermedi-analytical concentration at which an analyte(s) could be detectedates in the synthesis, and inactive ingredients in the formulatedqualitatively. Typically peak heights are two or three times theproducts, and the degradation products. Specificity in liquid chro-noise level. The quantitation limit (QL) is also the lowest concen-matography is achieved by choosing optimal columns and settingtration at that level analyte can be quantitated with acceptable pre-chromatographic conditions, such as mobile phase composition,cision, requiring peak heights 10 to 20 times higher than the base-column temperature and detector wavelength. Besides chroma-line noise. This signal to noise ratio is a good rule of thumb.The ICH has recognized the signal to noise ratio is most con-tographic separation, the sample preparation procedure should also―67―
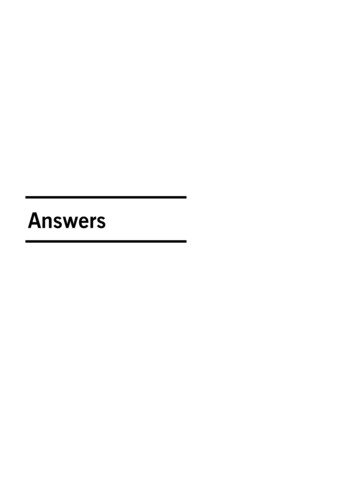
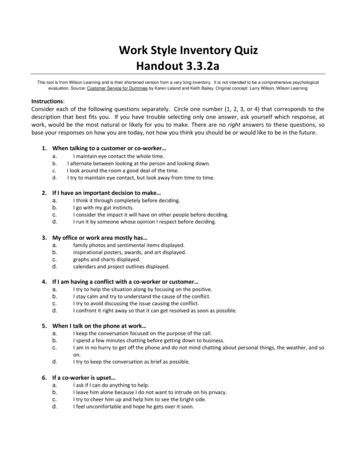
CHROMATOGRAPHY, Vol.33 No.2 (2012)Figure 1. Desirable resolution between impurities and the target compound, and among impurities.ventional, but also lists two other operations to determine DL andIn general, the physical quantity of interest (mass, concentration)QL: visual non instrumental method and a means of calculation.is not directly measurable, but is calculated with the observed sig-Visual non instrumental methods may apply to a separation tech-nal (peak area) through a calibration curve. DL is expressed in thenique such as thin layer chromatography. A means of calculationfollowing equation:is based on the statistical background. Each method will give different results.DL 3.3 Currie proposed that DL should be decided exclusively based onσslopeerror of the first kind (α) that is defined by the distribution of thewhere “slope” means that of the calibration curve. This equationblank noise [10]. He introduced the concept of critical level (LC)could be converted into the following equation. σ slope 1 3.3 30%below which signals are judged not to be observed. Mathematically, the critical level is given asDLLC KασThis equation means the relative standard deviation (RSD) at theand the detection limit is expressed as below,detection limit level is 30%. In the same manner, QL is also expressed in the following equation, and the RSD is 10% at the quantitation limit level.DL 2 KασσQL 10 slopewhere Kα is the value concerning the standard normal distributiondefining the probabilities, and σ represents the standard deviation σ slope 1 10 10%of the blank peaks. The standard deviation of the sample peaks atthe DL level is assumed to be equal to that of the blank peaks. Thetwo kinds of error should be considered: deciding that the sub-QLstance is present when it is not (α; error of the first kind), and theconverse, failing to decide that it is present when it exist (β; errorMeasurement of the magnitude of analytical background re-of the second kind). Generally, the acceptable value for α and β aresponse is performed by analyzing an appropriate number of blank0.05 in the pharmaceutical industries [11]. In this case, Kα is 1.65,samples and calculating the standard deviation of these responses.and DL is equal to 3.3 σ. The relationship between LC, DL andThe residual standard deviation or the standard deviation of y in-probability distributions is depicted in Figure 2.tercepts of regression lines might be used as the standard deviation.―68―
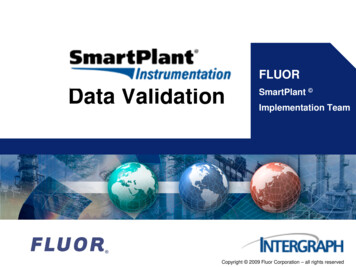
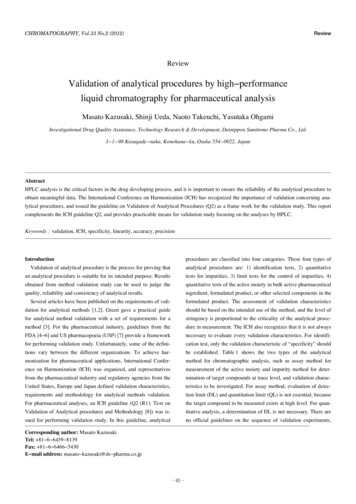
CHROMATOGRAPHY, Vol.33 No.2 (2012)Masato Kazusaki, Shinji Ueda, Naoto Takeuchi, Yasutaka OhgamiFigure 2. Relationship among critical level (LC), detection limit (DL) and errors of the first and second kind.Figure 3. Typical chromatogram showing detection limit and quantitation limit. Noise levels vary, and are observedin the normal distribution pattern.the old HPLC system to the one of new type.An example of criterion for detection limit is that, where theRSD of peak area of an impurity peak will be 30% when an ana-3. Linearitylyte is analyzed in the short intervals. Similarly, criterion for quantitation limit is that RSD of the peak areas at that level are 10%.Linearity of an analytical procedure is the ability for showing theAny estimated results of detection limit and quantitation limit mustresponse of the analyte is proportional to the analyte concentrationbe verified with samples containing the corresponding analytes atwithin a given range. In practice, the linearity study should be de-DL or QL level, as shown in Figure 3.signed to be appropriate for the intended analysis. At the comple-Both DL and QL could be affected by the HPLC instruments.tion of linearity studies, the appropriate concentration range wouldSharper peaks result in a higher signal to noise ratio, resulting inbe set for all subsequent studies. For assay methods, linearity studylower DL and QL. We recommend verifying DL and QL when theis generally performed by preparing standard solutions at five con-HPLC system for routine analyses was changed, especially fromcentration levels from 80 to 120% of the target analyte concentra-―69―
CHROMATOGRAPHY, Vol.33 No.2 (2012)analyte at the specification level.tion. For impurity methods, linearity is determined by preparingstandard solutions at five concentration levels over a range from re-Linearity should also be evaluated graphically, in addition toporting threshold to 120% of the specification level. Reportingmathematical evaluation described above. The evaluation is madethreshold is a limit above which an impurity in the bulk activeby visually inspecting a plot of peak area as a function of analytepharmaceutical ingredient or formulated products should be re-concentration, as shown in Figure 4. In addition to this approach,ported to regulatory authorities, and specification level is a limitplots of the values obtained by the subtraction of the observed val-above which an impurity should not occur in the bulk active phar-ues from the predicted values (from the linear equation) against themaceutical ingredient or formulated products [12,13]. The ICH Q2concentration can help to assess the linearity. For linear ranges inguideline specifies a minimum of five concentration levels alongthe calibration curve, the deviations should be equally distributedwith certain minimum specified ranges, but do not require anybetween positive and negative values, as shown in Figure 5.proof of precision, because the linear relationship cannot be gener4. Accuracy and precisionated without sufficient precision.Linearity is typically demonstrated via least square regression.Analytical results are obtained through the analytical procedureAcceptability of linearity data is often judged by examining thefrom the sample. In this case, analytical results involve two typescorrelation coefficient and y intercept, and residual sum ofof errors. One is the systematic error and the other is the randomsquares. For assay method, a correlation coefficient of more thanerror. Systematic error is often caused from the analytical instru-0.999 is generally considered as an evidence of acceptable fit of thements, interference by the coexisting materials. Random error oc-data to the regression line. For impurity method, a correlation coef-curs whenever analyses are performed. These two types of errors inficient of more than 0.99 is generally acceptable. A linear regres-the analytical procedure should be investigated as validation char-sion equation applied to the results should have an intercept notacteristics of accuracy and precision.significantly different from 0. This result should be driven from theAccuracy is the closeness of the analytical results obtained bystatistical assessment of calibration curve. It is also accepted thatthe analyses to the true values, and usually presented as a percentthe y intercept should be less than a few percent of the responseof nominal. Accuracy in the absence of precision has little mean-obtained for the analyte at the target concentration. For example,ing. Accuracy is usually determined in one of the following fourthe y intercept for assay method should be less than 2.0% of theways. First, accuracy can be assessed by analyzing a sample ofresponse of the analyte at the target concentration. The y interceptknown concentration (reference materials) and comparing thefor impurity method should be less than 10% of the response of themeasured value to the true value. If National Institute of StandardsFigure 4. Typical calibration curve as a function of concentration and peak area.―70―
CHROMATOGRAPHY, Vol.33 No.2 (2012)Masato Kazusaki, Shinji Ueda, Naoto Takeuchi, Yasutaka OhgamiFigure 5. Deviation around the calibration line shown in Figure 5. and Technology (NIST) standards could be available, those stan-( V ). The average of the dataset is calculated using the followingdards should be utilized. However, such a well characterized stan-equation:dard could not be offered for new drug related analytes. The sec-nond approach is to compare analytical results from the new analyti-x cal procedure with the results from an existing well characterized1nΣ xii 1procedure that is known to be accurate. Again, during the drug de-where n means the number of samples measured in this study. Thevelopment stage in the pharmaceutical industries, such an alternatestandard deviation is a measure of the spread of the values in theanalytical procedure is usually not available. The third approach isdataset, and can be calculated by the difference between the aver-performed by spiking analyte in blank matrices. Added amountage and the individual values as follows.corresponds to the true value. If potential impurities have been iso- V Σ(x x )n2lated, they would be added to the matrix to mimic impure samples.iThe analyte levels in the spiked samples should be determined us-i 1n 1ing the same equation procedure as will be used in the defined analytical procedure.Confidential intervals are used to indicate the reliability of an es-The ICH Q2 guideline recommends accuracy to be assessed us-timate. When the amount of pharmaceutical active ingredient in theing a minimum of nine determinations over a minimum of threeformulated products is determined, the average value of the resultsconcentration levels covering the specified range. For assay meth-is an estimate of an actual amount present in the formulated ones.ods, spiked samples are prepared in triplicate at three levels over aA confidence interval provides limits around the mean values ob-range of 80 120% of the target concentration. For impurity meth-tained through the assay procedure. In a confidence interval, theods, spiked samples are prepared in triplicate over a range that cov-true value (population mean) lies with a given value of probability,ers the expected impurity content of the sample, such as reportingusually 95%. Confidence interval of population mean (µ) is ex-threshold to 120% of the specification level. After the calculationpressed using the t distribution: µ x t(φ,α) Vnof the percent recovery, accuracy should be reported as percent re-x t(φ,α) Vncovery by the determination of known added amount of analyte inthe sample or as the difference between the mean and the acceptedtrue value, together with the confidence intervals. Confidence inter-where φ means degree of freedom, and α is error of the first kind.val is calculated mainly from the average (x), standard deviationIf 0% is out of the confidence interval of the accuracy (difference―71―
CHROMATOGRAPHY, Vol.33 No.2 (2012)of the true value and observed value), analytical results are ad-precision validation is to verify that in the same laboratory theversely affected by the systematic error. An example of accuracymethod will provide the same results. In determining intermediatecriteria for impurity method is that the individual recoveries will beprecision, experimental design should be employed so that the ef-in the range of 80% to 120% at each concentration levels. For as-fects (if any) of the individual variables can be monitored. The in-say method that is applied to the formulated products, individualvestigation consists of a minimum of two analysts on six differentrecovery will be from 95% to 105% at each concentration levels.days with two replicates.For accuracy of the assay method for bulk active pharmaceuticalReproducibility, which is determined by analyzing homogeneousingredient, accuracy is estimated from the investigational results ofsamples in multiple laboratories, is often a part of inter laboratoryspecificity, linearity and precision.crossover studies. The objective is to verify that the method willprovide the same results in different laboratories.The most important part of any validation study for analyticalprocedure is precision. The precision of an analytical method is the5. Rangeamount of variation in the results obtained from multiple analysesof the homogeneous samples. ICH guidelines break precision intoThe range of an analytical method is the interval between the up-three parts: repeatability, intermediate precision, and reproducibil-per and lower levels (including these levels) that have been demon-ity.strated with precision, accuracy and linearity using the analyticalRepeatability precision is expressed as the standard deviation ofmethod. So, the acceptable range will be defined as the concentra-the analytical results when the analysis is carried out in a labora-tion interval over which linearity, accuracy and precision are ac-tory by an operator using an equipment over a relatively short timeceptable.span. Repeatability is also termed intra assay precision. The ICHguideline on methodology states two ways for data collection. One6. Robustnessway is collecting data from a minimum of nine determinations (forThe robustness of an analytical procedure is its ability to remainexample, three concentrations, three replicates each) over a mini-unaffected by small variation in the analytical parameters. The ro-mum of three concentrations covering the target range. Anotherbustness is evaluated by varying the analytical parameters such asway is collecting data from at least 6 replications to be measured atbuffer pH, flow rate, column temperature, injection volume, detec-100 percent of the test target concentration. Precision data wouldtion wavelength or mobile phase composition within a realisticbe available from the triplicate analyses of spiked samples per-range. The quantitative influence of the variables should be deter-formed in the accuracy study. Documentation in support of preci-mined.sion (repeatability) studies should include the standard deviationand the confidence interval. Precision (repeatability) criteria of as-Conclusionsay method for bulk active pharmaceutical ingredient are that theIf the analysts in the pharmaceutical industry obtained the doubt-repeatability should be not more than 1.0%, and that for formulatedful testing results through the invalid analytical procedure, theyproducts not more than 2.0%. For impurity method for determiningwould realize that much amount of time should be required fortiny amount of compounds, these precisions should be not moresolving problems. This kind of trouble would be avoided, providedthan 10%. Confidence interval of precision is also calculated usingthat the validation study is performed properly. A well definedchi square distribution,validation process provides evidence that the system and method Sσ2α/2)x(φ,are suitable for its intended use. Performing a throughout valida-S21 α/2)x(φ,tion study on an analytical procedure can be a tedious process.However, once validation studies are completed, the analysts canwhere S is sum of squared deviation, and obtained from the fol-be confident in the ability of the analytical procedure to providelowing calculation.good quantitation.We hope that we could provide a guide to help to understandn2Σ(x x )S how to perform a validation study on an analytical procedure thatii 1generates both useful and meaning data. This report focuses on per-Intermediate precision is a term that has been defined by ICH asforming a validation study for pharmaceuticals by HPLC system.the long term variability of the measurement process. IntermediateThis validation approach would be applied to the analytical meth-precision is the results from within lab variations due to randomods using GC, HPLC, GC MS, LC MS for the biological samplesevents such as different day, different analysts, different analyticalor environmental pollution substances. Many of the principles,columns, different equipments, etc. The objective of intermediateseparation techniques, and requirements are common to all types of―72―
CHROMATOGRAPHY, Vol.33 No.2 (2012)Masato Kazusaki, Shinji Ueda, Naoto Takeuchi, Yasutaka Ohgamisearch (CBER). Guidance for Industry, Analytical Proce-chromatographic analytical methodologies.dures and Methods Validation, 2000.[7]References[1][8]D.; Persinger, M. L.; Ruther
the target compound to be measured exists at high level. For quan-titative analysis, a determination of DL is not necessary. There are no official guidelines on the sequence of validation experiments, Review Validation of analytical procedures by high performance l