Transcription
Chapter14-1
CHAPTER 14Financial StatementAnalysis: The Big PictureManagerial Accounting, Fourth EditionChapter14-2
Study Objectives1.Discuss the need for comparative analysis.2. Identify the tools of financial statement analysis.3. Explain and apply horizontal analysis.4. Describe and apply vertical analysis.5. Identify and compute ratios used in analyzing afirm’s liquidity, profitability, and solvency.6. Understand the concept of earning power, and howirregular items are presented.7. Understand the concept of quality of earnings.Chapter14-3
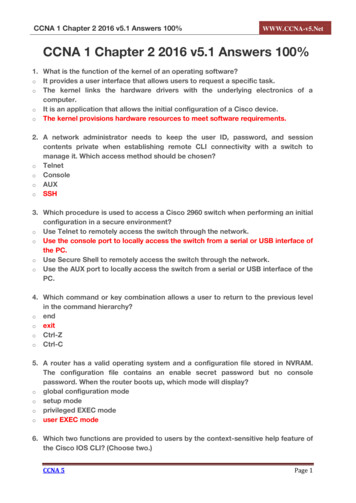
Financial Statement AnalysisBasics ofFinancialStatementAnalysisNeed forcomparativeanalysisTools ofanalysisHorizontal inedearningsstatementRatio ngPower andIrregular es 4Quality ofEarningsAlternativeaccountingmethodsPro formaincomeImproperrecognition
Basics of Financial Statement AnalysisAnalyzing financial statements involves:CharacteristicsComparisonBasesTools anyChapter14-5LO 1 Discuss the need for comparative analysis.LO 2 Identify the tools of financial statement analysis.
Horizontal AnalysisHorizontal analysis, also called trend analysis, is atechnique for evaluating a series of financialstatement data over a period of time.Its purpose is to determine the increase or decreasethat has taken place.Horizontal analysis is commonly applied to the balancesheet, income statement, and statement of retainedearnings.Chapter14-6LO 3 Explain and apply horizontal analysis.
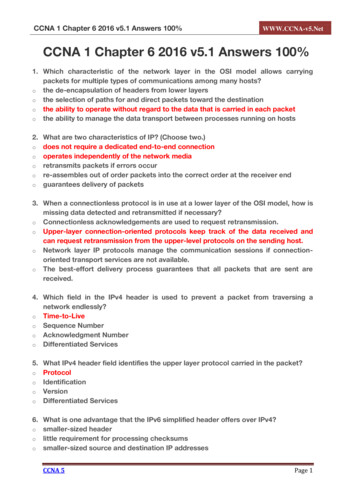
Horizontal AnalysisExercise: The comparative condensed balance sheets ofRamsey Corporation are presented below.Current assetsPP&EIntangiblesTotal assets2009 76,00099,00025,000 200,0002008 80,00090,00040,000 210,000Current liabilitiesLong-term liabiltiesStockholders' equityTotal liabilities & equity 40,800143,00016,200 200,000 48,000150,00012,000 210,000Instructions: Prepare a horizontal analysis of the balancesheet data for Ramsey Corporation using 2008 as a base.Chapter14-7LO 3 Explain and apply horizontal analysis.
Horizontal AnalysisExercise: The comparative condensed balance sheets ofRamsey Corporation are presented below.Current assetsPP&EIntangiblesTotal assets2009 76,00099,00025,000 200,0002008 80,00090,00040,000 210,000Current liabilitiesLong-term liabiltiesStockholders' equityTotal liabilities & equity 40,800143,00016,200 200,000 48,000150,00012,000 210,000Increase Percentage(Decrease)Change (4,000)-5.0%9,00010.0%(15,000)-37.5% (10,000)-4.8% (7,200)(7,000)4,200 (10,000)-15.0%-4.7%35.0%-4.8%Instructions: Prepare a horizontal analysis of the balancesheet data for Ramsey Corporation using 2008 as a base.Chapter14-8LO 3 Explain and apply horizontal analysis.
Vertical AnalysisVertical analysis, also called common-size analysis, isa technique that expresses each financial statementitem as a percent of a base amount.On an income statement, we might say that sellingexpenses are 16% of net sales.Vertical analysis is commonly applied to the balancesheet and the income statement.Chapter14-9LO 4 Describe and apply vertical analysis.
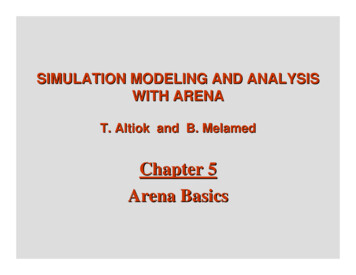
Vertical AnalysisExercise: The comparative condensed income statementsof Hendi Corporation are shown below.Net salesCost of goods soldGross profitOperating expenseNet income2009Amount 600,000483,000117,00057,200 59,8002008Amount 500,000420,00080,00044,000 36,000Instructions: Prepare a vertical analysis of the incomestatement data for Hendi Corporation in columnar formfor both years.Chapter14-10LO 4 Describe and apply vertical analysis.
Vertical AnalysisExercise: The comparative condensed income statementsof Hendi Corporation are shown below.Net salesCost of goods soldGross profitOperating expenseNet income2009AmountPercent 600,000100.0%483,00080.5%117,00019.5%57,2009.5% 59,80010.0%2008AmountPercent 500,000100.0%420,00084.0%80,00016.0%44,0008.8% 36,0007.2%Instructions: Prepare a vertical analysis of the incomestatement data for Hendi Corporation in columnar formfor both years.Chapter14-11LO 4 Describe and apply vertical analysis.
Ratio AnalysisRatio analysis expresses the relationship amongselected items of financial statement data.Financial Ratio olvencyMeasures shortterm ability ofthe company topay its maturingobligations and tomeet unexpectedneeds for cash.Measures theincome oroperating successof a company fora given period oftime.Measures theability of thecompany tosurvive over along period oftime.LO 5 Identify and compute ratios used in analyzinga firm’s liquidity, profitability, and solvency.
Ratio AnalysisA single ratio by itself is not very meaningful.The discussion of ratios willinclude the following types ofcomparisons.Chapter14-13LO 5 Identify and compute ratios used in analyzinga firm’s liquidity, profitability, and solvency.
Ratio AnalysisLiquidity RatiosMeasure the short-term ability of the company to payits maturing obligations and to meet unexpected needsfor cash. Short-term creditors such as bankers andsuppliers are particularly interested in assessingliquidity. Ratios include the current ratio, the acid-testratio, receivables turnover, and inventoryturnover.Chapter14-14LO 5 Identify and compute ratios used in analyzinga firm’s liquidity, profitability, and solvency.
Ratio AnalysisIllustrationTaylor Tool CompanyIncome StatementFor the Year Ended December 3120092008 1,818,5001,011,500 1,750,500996,000Gross profit807,000754,500Selling and administrative expenses506,000479,000Income from operations301,000275,500Other expenses and losses:Interest expense18,00014,000Income before income taxes283,000261,50084,00077,000Net salesCost of goods soldIncome tax expenseNet incomeChapter14-15 199,000 184,500LO 5 Identify and compute ratios used in analyzinga firm’s liquidity, profitability, and solvency.
Ratio AnalysisTaylor Tool CompanyBalance SheetsDecember 31Assets20092008Current assetsCash Short-term investmentsAccounts receivable (net)InventoryTotal current assetsPlant assets (net)Total assetsChapter14-16 60,100 900332,500600,300520,300970,200 852,800LO 5 Identify and compute ratios used in analyzinga firm’s liquidity, profitability, and solvency.
Ratio AnalysisLiabilities and Stockholders' Equity20092008Current liabilitiesAccounts payable Income taxes payableTotal current liabilitiesBonds payableTotal liabilities160,000 400Stockholders' equityCommon stock ( 5 par)Retained earningsTotal stockholders' equityTotal liabilities and equity 970,200 852,800All sales were on account. The allowance for doubtful accounts was 3,200 on December 31, 2009, and 3,000 on December 31, 2008.Chapter14-17LO 5 Identify and compute ratios used in analyzinga firm’s liquidity, profitability, and solvency.
Ratio AnalysisLiquidity RatiosCompute the Current Ratio for 2009.Current Assets Current RatioCurrent Liabilities 369,900 1.82 : 1 203,500The ratio of 1.82:1 means that for every dollar ofcurrent liabilities, the company has 1.82 ofcurrent assets.Chapter14-18LO 5 Identify and compute ratios used in analyzinga firm’s liquidity, profitability, and solvency.
Ratio AnalysisLiquidity RatiosCompute the Acid-Test Ratio for 2009.Cash Short-Term Investments Receivables (Net) Acid-TestRatioCurrent Liabilities 60,100 69,000 107,800 1.16 : 1 203,500The acid-test ratio measures immediate liquidity.Chapter14-19LO 5 Identify and compute ratios used in analyzinga firm’s liquidity, profitability, and solvency.
Ratio AnalysisLiquidity RatiosCompute the Receivables Turnover ratio for 2009.Net Credit SalesAverage Net Receivables 1,818,500 ReceivablesTurnover 17.3 times( 107,800 102,800) / 2It measures the number of times, on average, thecompany collects receivables during the period.Chapter14-20LO 5 Identify and compute ratios used in analyzinga firm’s liquidity, profitability, and solvency.
Ratio AnalysisLiquidity RatiosReceivables Turnover 1,818,500 17.3 times( 107,800 102,800) / 2A variant of the receivables turnover ratio is to convertit to an average collection period in terms of days.365 days / 17.3 times every 21.1 daysThis means that receivables are collected on averageevery 21 days.Chapter14-21LO 5 Identify and compute ratios used in analyzinga firm’s liquidity, profitability, and solvency.
Ratio AnalysisLiquidity RatiosCompute the Inventory Turnover ratio for 2009.Cost of Good SoldAverage Inventory 1,011,500 InventoryTurnover 8.1 times( 133,000 115,500) / 2Inventory turnover measures the number of times,on average, the inventory is sold during the period.Chapter14-22LO 5 Identify and compute ratios used in analyzinga firm’s liquidity, profitability, and solvency.
Ratio AnalysisLiquidity RatiosInventory Turnover 8.1 times( 133,000 115,500) / 2 1,011,500A variant of inventory turnover is the days in inventory.365 days / 8.1 times every 45.1 daysInventory turnover ratios vary considerably amongindustries.Chapter14-23LO 5 Identify and compute ratios used in analyzinga firm’s liquidity, profitability, and solvency.
Ratio AnalysisProfitability RatiosMeasure the income or operating success of a companyfor a given period of time. Income, or the lack of it, affects the company’sability to obtain debt and equity financing,liquidity position, and the ability to grow. Ratios include the profit margin, asset turnover,return on assets, return on common stockholders’equity, earnings per share, price-earnings, andpayout ratio.Chapter14-24LO 5 Identify and compute ratios used in analyzinga firm’s liquidity, profitability, and solvency.
Ratio AnalysisProfitability RatiosCompute the Profit Margin ratio for 2009.Net IncomeNet Sales 199,000 ProfitMargin 10.9% 1,818,500Measures the percentage of each dollar of salesthat results in net income.Chapter14-25LO 5 Identify and compute ratios used in analyzinga firm’s liquidity, profitability, and solvency.
Ratio AnalysisProfitability RatiosCompute the Asset Turnover ratio for 2009.Net SalesAverage Assets 1,818,500 AssetTurnover 2.0 times( 970,200 852,800) / 2Measures how efficiently a company uses its assetsto generate sales.Chapter14-26LO 5 Identify and compute ratios used in analyzinga firm’s liquidity, profitability, and solvency.
Ratio AnalysisProfitability RatiosCompute the Return on Assets ratio for 2009.Net Income Average Assets 199,000Returnon Assets 21.8%( 970,200 852,800) / 2An overall measure of profitability.Chapter14-27LO 5 Identify and compute ratios used in analyzinga firm’s liquidity, profitability, and solvency.
Ratio AnalysisProfitability RatiosCompute the Return on Common Stockholders’Equity ratio for 2009.Return onNet Income – Preferred DividendsCommon Stockholders’Average Common Stockholders’ EquityEquity 199,000 - 0 38.6%( 566,700 465,400) / 2Shows how many dollars of net income the companyearned for each dollar invested by the owners.Chapter14-28LO 5 Identify and compute ratios used in analyzinga firm’s liquidity, profitability, and solvency.
Ratio AnalysisProfitability RatiosCompute the Earnings Per Share for 2009.Net IncomeWeighted Average CommonShares Outstanding 199,000 EarningsPer Share 3.49 per share57,000 (given)A measure of the net income earned on each shareof common stock.Chapter14-29LO 5 Identify and compute ratios used in analyzinga firm’s liquidity, profitability, and solvency.
Ratio AnalysisProfitability RatiosCompute the Price Earnings Ratio for 2009.Market Price per Share of StockEarnings Per Share 25 (given) PriceEarningsRatio 7.16 times 3.49The price-earnings (P-E) ratio reflects investors’assessments of a company’s future earnings.Chapter14-30LO 5 Identify and compute ratios used in analyzinga firm’s liquidity, profitability, and solvency.
Ratio AnalysisProfitability RatiosCompute the Payout Ratio for 2009.Cash Dividends Net Income 77,700 * 199,000PayoutRatio 39%Measures the percentage of earnings distributed inthe form of cash dividends.* From analysis of retained earnings.Chapter14-31LO 5 Identify and compute ratios used in analyzinga firm’s liquidity, profitability, and solvency.
Ratio AnalysisSolvency RatiosSolvency ratios measure the ability of a company tosurvive over a long period of time. Debt to total assets and times interest earnedare two ratios that provide information aboutdebt-paying ability.Chapter14-32LO 5 Identify and compute ratios used in analyzinga firm’s liquidity, profitability, and solvency.
Ratio AnalysisSolvency RatiosCompute the Debt to Total Assets Ratio for 2009.Total DebtTotal Assets 403,500 970,200Debt to Total AssetsRatio 41.6%Measures the percentage of the total assets thatcreditors provide.Chapter14-33LO 5 Identify and compute ratios used in analyzinga firm’s liquidity, profitability, and solvency.
Ratio AnalysisSolvency RatiosCompute the Times Interest Earned ratio for 2009.Income before Income Taxes andInterest ExpenseInterest Expense 199,000 84,000 18,000 18,000 TimesInterestEarned 16.7 timesProvides an indication of the company’s ability tomeet interest payments as they come due.Chapter14-34LO 5 Identify and compute ratios used in analyzinga firm’s liquidity, profitability, and solvency.
Earning Power and Irregular ItemsEarning power means the normal level of income to beobtained in the future.“Irregular” items are separately identified on theincome statement. Two types are:1. Discontinued operations.2. Extraordinary items.These “irregular” items are reported net of incometaxes.Chapter14-35LO 6 Understand the concept of earning power,and how irregular items are presented.
Ear
14-6 LO 3 Explain and apply horizontal analysis. Horizontal Analysis Horizontal analysis, also called trend analysis, is a technique for evaluating a series of financial statement data over a period of time. Its purposeis to determine the increase or decrease that has taken place. Horizontal analysis is commonly applied to the balance