Transcription
User Manual for the Danish (Q)SAR Database
User manual - December 2018Copyright notice, terms and conditions of usePermission is granted to use information from the database as is. The database is an expert tool wherethe final assessment of properties is not dictated by the (Q)SAR estimates, but by the user's ownscientific judgment. Aside from the fact that models are never perfect, the (Q)SAR field is under rapiddevelopment and models are regularly updated and improved. It is also impossible to provide thedetailed information accompanying each individual prediction that is available to those who do notown licences to the software platforms. The structural information in the database stems from manysources and in some cases it may be wrong. The structures are also in some cases abbreviated in thatpossible anions and cations have been removed. This can have important toxicological significance(e.g. for Heavy Metal salts).All access to the database should happen through the provided client-side software and without anyuse of automated workflow or scripting.Reproduction of information from the database is permitted provided the source is acknowledged asfollows: “Danish (Q)SAR Database, Division of Diet, Disease Prevention and Toxicology, NationalFood Institute, Technical University of Denmark, http://qsar.food.dtu.dk.”The Technical University of Denmark (DTU) is not responsible for any errors or inaccuracies thedatabase may contain and is not liable for any use that may be made of the information containedtherein. DTU do not warrant, and hereby disclaim any warranties, with respect to the accuracy,adequacy or completeness of any information obtained from this database. Nor do we warrant thatthe site will operate in an uninterrupted or error-free manner or that the site and its components arefree of viruses or other harmful components. Use of information obtained from or through this site isat your own risk. As a user of this database, you agree to indemnify and hold DTU harmless from anyclaims, losses or damages, including legal fees, resulting from your use of this database, and to fullycooperate in DTU's defense against any such claims.The user requests are processed by the server hosting the database which in the process storesinformation. Only authorized employees have authorized access to the server and reasonablemeasures are in place to protect the server from unauthorized access. DTU uses the stored user requestinformation solely for error tracking and to collect anonymized statistics (number of users, numberof searches, number of report downloads etc.), and we do not release any information at the level ofindividual searches. However, as the online user access to the database does not happen through asecure connection and as any server/PC/network that the requests pass through may be compromisedby unauthorized access, we cannot guarantee that the information submitted by users does not fallinto the hands of third parties.These terms are governed by Danish Law, with the exception of international private law and conflictof law rules, to the extent that such rules would result in the application of another country's law. Anydispute arising between the parties in connection with the use of this database, including theinterpretation of the above terms, which cannot be settled amicably by negotiation between theparties, shall be settled by the Court of Lyngby, Denmark, as the court of first instance.1
User manual - December 2018ContentsCopyright notice, terms and conditions of use. 1Background . 3Introduction . 3Main features at a glance . 4Launching the Danish QSAR Database . 4Main search screen . 5Searching by identification data . 5Structure and similarity search . 6Searching by model endpoint . 8Combining searches . 10Searches and Results sections . 11Results window with substances . 12Technical requirements and notes . 13Battery algorithm . 13Appendix 1: Searching by identification number . 23Appendix 2: Searching by structure and similarity. 24Appendix 3: Searching by model endpoint . 29Appendix 4: Combining searches . 31Appendix 5: Software systems used for modeling. 35Appendix 6: A short introduction to QSARs. 372
User manual - December 2018BackgroundThe Danish QSAR database has been freely available on the internet since 2004. It is a tool that allowsindustry, research, authorities and others to search for hazard information on chemical substances,especially those with little or no testing data. The information provided may be useful to identifychemical substances of potential concern.With the EU chemicals legislations, e.g. the REACH regulation, there is increased focus on the useof alternatives to animal testing. The QSAR database is used for a wide variety of tasks such asscreening for potentially harmful substances and for assessment of specific substances e.g. in relationto dossier evaluation under REACH. The results in the database have also been used to generate theDanish Advisory Self-classification List and to screen for potential PBTs.Besides direct replacement of experimental tests in some cases, QSAR predictions can help prioritizefurther in vitro and in vivo testing of chemicals. In cases where animal testing is still needed, QSARpredictions of mechanistic properties for the chemical can contribute in optimizing the experimentaldesign. In this way, QSARs can reduce the need for later animal testing. It is anticipated that the useof QSAR predictions, and hence the need for good tools will grow in the future.The new version of the QSAR database has been rebuilt from scratch, and is an updated, extendedand improved version of the previous 2004 version of the online QSAR predictions database. It waspublished in November 2015 and has since then been expanded and updated a number of times. Itcontains an improved, user-friendly interface, new functionalities and updated predictions for aconsiderably larger substance structure set than the previous database. The new database is a dynamicsystem, which will be updated continuously in terms of functionalities and content.IntroductionThe new Danish QSAR database is a repository of model estimates for more than 600,000 substances.The QSAR models include endpoints for physico-chemical properties, environmental fate,bioaccumulation, eco-toxicity, absorption, metabolism and toxicity. As far as possible all organicsingle constituent substances that were pre-registered or registered under REACH (around 80,000)are included in the structure set. In addition, chemical structures from other relevant databases areincluded leading to the new structure set of more than 600,000 unique chemical structures.When possible, the endpoints have been modelled in the three software systems Leadscope, CASEUltra and SciQSAR. All DTU in-house models and a number of commercial models have with thekind permission from MultiCASE been modelled in two or three systems. The structure set hasbeen predicted in the different systems and an overall battery prediction is made. With the batteryapproach it is in many cases possible to reduce “noise” from the individual model estimates andthereby improve accuracy and/or broaden the applicability domain.All applied DTU QSAR models are documented in QMRFs (QSAR Model Reporting Format).Permissions to publish predictions for more than 600,000 substances were kindly provided byMultiCASE Inc., Leadscope Inc., SciMatics, ACD/Labs, and US EPA. The published predictions are3
User manual - December 2018abbreviated predictions (simple yes/no) and do not include detailed information about specific alertsidentified. Applicability domain calls are however available.Predictions from a number of OECD QSAR Toolbox profilers have also been included as supportinginformation to the QSAR predictions. Besides predictions for the parent compounds, predictions forToolbox simulated transformation products have been included for some profilers. If alerts werepredicted, they are included in the database, and if none were found or the compound could not bepredicted by the Toolbox this is likewise included. Reference is made to the QSAR Toolboxdocumentation for the individual profilers via direct link to the documents.Main features at a glance Estimates for more than 600,000 chemicals in over 200 (Q)SAR models.Contains experimental training set data for DTU models, for which data are public.Search on substance ID and affiliation.Structure search on 2D structures as substructure or exact match.Search on all contained QSAR predictions and training set data.Combination of search results to make complex AND, OR and NOT algorithms.Download of QSAR predictions in an RTF format document compatible with Microsoft Wordand OpenOffice.Sorting on chemical similarity to facilitate read-across groupings.Launching the Danish QSAR DatabaseType in the following link in the address bar of the web browser: http://qsar.food.dtu.dkFigure 1: Opening screen for the Danish QSAR Database.4
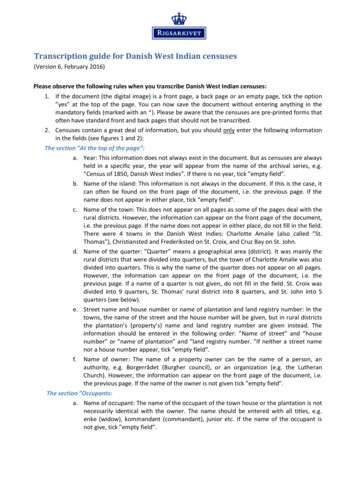
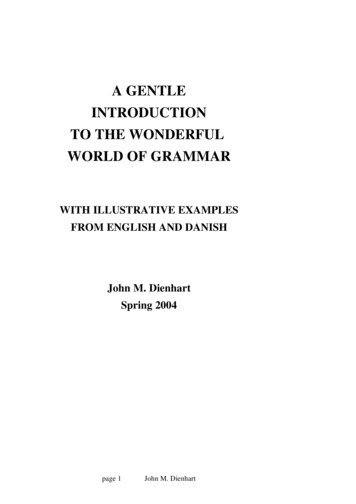
User manual - December 2018To begin searching, click the Search button, and the screen shown in Figure 2 should appear. Clickthe button marked I agree to enter the database.Figure 2. Main search screen with disclaimer box.Main search screenIn the left part of this screen a number of buttons and the headline "New Search” is shown. There arethree basic search options in the interface window: Id, Structure and Model endpoint (divided intoPhysChem, ADME, Environment and Human health). These are explained in more detail below.Each search can be combined with others in order to form more complex search queries. Thecombined searches are performed using the three buttons AND, OR and NOT and are described inmore detail below in the section: Combining searches.The Clear button is used to clear the previous searches from the screen.Searching by identification dataThe ID search button is designed for queries by Single ID, ID List or Affiliation (see Figure 3).5
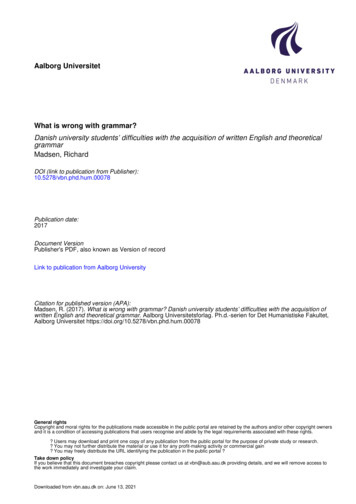
User manual - December 2018When choosing Single ID, a number of options are possible: Registry Number, EC Number,PubChem CID. To start a Single ID search, type in the query in the white box and click the Searchbutton. The Registry number can be entered with or without hyphens. The structures matching yoursearch will be listed in a result window similar to the window shown in Figure 8 and give thepossibility to download a report containing the prediction results of the resulting substance. Thesearch section and the result window are further described below in the sections Searches andResults and Results window with substances.Figure 3. The ID search box.When choosing ID list (in the ID Search box), two options are possible: Registry numbers andPubChem CIDs. To start an ID list search, type or paste in the query in the white box and click theSearch button.Choosing Affiliation gives two options for retrieving database structures: REACH Pre-registrationlist and PubChem. To retrieve the structures, choose the database of interest and click the Searchbutton.A search example is given in Appendix 1.Structure, name and similarity searchThe Structure section offers a 2D molecular editor, where it is possible to input structure fragmentsto search for. Click the Structure button to the left on the main search screen to open the moleculareditor (see Figure 4). Structures can be drawn or entered from either SMILES or MOL/SDF records.Substructure search, exact structure matching and similarity search are available. Chemical namesearch is also performed using the molecular editor window.6
User manual - December 2018Figure 4. The Structure and name search interface.A chemical structure can be either built using the molecular editor or entered from a SMILES stringor a MOL/SDF record. When building a fragment, to add an item, click on the corresponding buttonand then click on the blank canvas. Add atoms/fragments/bonds one by one. Click thebutton ifyou need other atoms than shown in the molecular editor, and then type the element symbol in theblank field, which is case-sensitive; confirm with ‘Ok’ and click the desired atom position in thestructure.To start a structure search, select either Substructure or Similarity to the right on the screen. Whenchoosing Substructure, two options are possible: Select Substructure search to search for the builtfragment as a subfragment within the database, or Exact match search to search for exactly the samestructure. When choosing Similarity, the entire database will be ordered in the order of similarity tothe query structure. Alternatively, select a number of closest analogs that will be sorted in the orderof similarity and displayed. The search will generate a result window similar to the window shownin Figure 8 and include the similarity coefficient for each analog. The result window is furtherdescribed below in the section: Results window with substances.Editor operations:Undo: Undoes the last operation.Redo: Repeats the last undone operation.7
User manual - December 2018Center: Moves the fragment to the center of the canvas.Toggle R/S labels: Marks R/S isomerism.Clear: Clears the Edit window.Import: Imports MOL or SMILES structure decsription.Export: Displays MOL or SMILES description for the current structure.About: Displays version number etc. of the fragment editor.2D cleanup/depiction: Corrects bond angles etc.Chemical name search:- type a chemical name or a part of it. The structure will be looked up in the US NIH chemicaldictionary and displayed in the molecular editor.- proceed with Exact match to search for the structure in the Danish (Q)SAR Database.Search examples are given in Appendix 2.Searching by model endpointThe PhysChem, Environment, ADME and Human health buttons to the left on the main screen canbe used to search for specific model endpoints. Each of the four categories covers a number ofdifferent endpoints. To start a search by model endpoint, click the category button of interest, e.g.Human health. This will generate a drop-down menu with a list of subcategories as shown in Figure5. Figure 5 shows an example query to search for prediction results in the model for Bacterial ReverseMutation Test (Ames test in S. typhimurium (in vitro)), which is found in the genotoxicitysubcategory.8
User manual - December 2018Figure 5. An example query to search for prediction results in Ames test. As shown, a number of submodelsare available.When the model of interest is chosen, a dialog box appears (Figure 6). Select the heading Search atthe top of the dialog box to start a search. The menu in the dialog box depends on whether the selectedmodel is made in one or more software systems. The selected model in Figure 6 is made in threesystems, CASE Ultra, Leadscope and SciQSAR. Based on predictions from the three systems, afourth and overall battery prediction is made. These four predictions (three predictions from theindividual systems and the battery prediction) can be selected individually. The battery predictionapproach is further described below in the section: Battery algorithm. It is also possible to selectand search for experimental results from the training set.9
User manual - December 2018Figure 6. Dialog box from query shown in Figure 5.Select the relevant results type (predictions/experimental) in the dialog box and then click either thepositive or negative button to start the search. Only the predictions within applicability domain willbe searched and displayed.The search will generate the browser window shown in Figure 8 and give the possibility to downloada report containing the prediction results in the rtf.file format. The results window is further describedbelow in the section: Results window with substances.Information about the selected model can be found by selecting the information tab at the top of thedialog box. A list of options will appear enabling you to download QMRFs of the relevant modelversions.Search examples are given in Appendix 3.Combining searchesCombinations of searches are also possible. These are performed using the two buttons to the left onthe main screen, AND and OR. Using the OR button will display all substances from two or moresearches, whereas the AND button will only display the intersection of the individual searches. The10
User manual - December 2018individual queries are made as described in the previous text so that they appear under “Searches” onthe main search screen.To combine searches, click the search definition buttons for the searches of interest that appear underthe field “Searches”. This will highlight the text in the selected buttons, which change the state to‘selected’ and the foreground color to green. Then select either the AND or OR button to start thesearch. The results of the combination search are displayed to the right under “Searches”, “Results”and “Substances”. The example in figure 7 shows the result of a combination of searches for ARantagonism and PXR binding using the AND button. The result window is further described belowin the section: Results window with substances.The NOT button to the left on the main search screen is for inverting a search. Click the searchdefinition button of interest (only one) under the field “Searches” and select NOT. Inverted searches,as well as results of AND and OR searches, can in turn be combined with other individual orcombined ones to form more complex combined searches.Search example is given in Appendix 4.Figure 7. An example where searches for AR antagonism and PXR binding are combined by using the ANDbutton.Searches and Results sectionsEvery time you perform a search, several new screen elements will appear. A search definition buttonwill be added to the Searches section (Figure 7). It can be used for combining searches, which isdescribed in the section “Combining searches”.11
User manual - December 2018Another button in the Results section will display the number of structures resulting from the search.The actual structures will be listed in a browser window similar to the window shown in Figure 8(described below in the section Results window with substances).The Searches and Results sections will keep track of all searches you have performed. You can clearthem by clicking the Clear button, or delete individual searches using the small ‘ ’ button next to thesearch definition. You can revisit previous search results at any time by clicking the button displayingthe number of structures in the Results section. The relevant searches are not executed again butinstead retrieved quickly from a repository of searches.Results window with substancesThe searches described in the previous sections will generate a results window and give the possibilityto download a report containing database results for selected substances. One report per substancewill be generated.The example in Figure 8 shows the result of a Model endpoint search of the Bacterial ReverseMutation Test. The results of the search are displayed to the right under “Results” and “Substances”.Figure 8. An example of a results window from a Model endpoint search of the Bacterial Reverse MutationTest.The window under "Substances" shows the resulting structures. When there are more than 10structures, they are shown in pages with 10 structures per page. Use the top button row (Previous,Next, First, Current, Last etc.) to navigation through the result pages. All result pages are directlyaccessible the moment the search is executed, so you can e.g. view any page directly without havingto go first through the preceding ones.12
User manual - December 2018To download a single substance report, click thebutton in the id column next to the substanceof interest. This will provide an .RTF file containing all predictions as well as training set data whenavailable. The .RTF document format is supported by Microsoft Word, OpenOffice and otherviewers/editors.Clicking the Similarity button will open the 2D fragment editor, where it is possible to search forsubstances similar to a query substance within the current result set. The current result set will beordered by decreasing similarity to the query substance.To revert back to the Id order, click the Id button above the structure list.Clicking the button next to Similarity opens a dialog box, where you can select any databaseproperty (experimental or predicted in any model and predictive system) and display its values in theresult window. You can select up to eight properties to display. The extra information will bedisplayed in new columns and refresh as you navigate through result pages.The Substances window can be resized and moved and scroll bars will automatically appear ifnecessary.Technical requirements and notesAll operations with the Danish (Q)SAR database are performed in a web browser. There is no needto download or install any software. Likewise, there is no need to install any browser plugin or addon (the previous version of the web site used Java).The system is can be accessed from both personal computers and mobile devices. The minimumscreen resolution for using the system is 640x480 pixels. For convenience, higher resolution displaysettings can be recommended (preferably 1280 or more pixels on the horizontal axis).The client-side software is implemented entirely in JavaScript and is compatible with all majorbrowsers and operating systems without the need for third-party software. Depending on the securitysettings of your browser, you may need to enable JavaScript in order to use the website.The system has been tested with the following browser versions: Google Chrome 46.0, MicrosoftInternet Explorer 11, Opera 33.0, Mozilla Firefox 37.0.2.Battery algorithmSome of the models are made in two or three of the following independent systems: CASE Ultra(CU), Leadscope Predictive Data Miner (LS) and SciQSAR (SQ). The systems are described inAppendix 5. Based on predictions from each of the applied systems, a battery prediction is madeusing a so-called battery algorithm. The battery approach can give more reliable predictions and can13
User manual - December 2018also expand the applicability domain, which was shown in a previous pilot project including 32different models and the three systems mentioned above (not published).For a given effect, QSAR predictions are made in each of the independent QSAR model systems andcombined into a battery prediction by using the criteria shown in Table 1. The first column shows thetotal number of predictions (positive/negative) in domain. The next two columns show the number ofpositive and negative predictions, respectively. The final battery prediction based on the individualpredictions is shown in the fourth column.Table 1. Battery algorithm.Total POS/NEGin domain3333POSin domain3021NEGin domain0312Battery predictionaRemarksPOS INNEG INPOS ININC OUTor (see remark)NEG INEXCEPT when CU and LS areboth NEG IN, in this case thebattery call is NEG IN222210012POS ININC OUTNEG IN111001POS OUTNEG OUT000INC OUT000-If minimum one prediction (outof domain)None predictedPOS, positive; NEG, negative; INC, inconclusive; IN, inside applicability domain; OUT, outside applicabilitydomain. b Less weight is put on an SQ POS compared to LS or CU POS in cases where LS and CU agree on aNEG in AD prediction, because SQ in many cases has lower specificity than LS and CU.a14
User manual - December 2018Table 2. Training set numbers and performance results. See QMRFs for more information.EndpointNot ready biodegradability(POS Not Ready)Fathead minnow 96h LC50(mg/L)Daphnia magna 48h EC50(mg/L)Pseudokirchneriella s. 72hEC50 (mg/L)Cytochrome P450 2D6(CYP2D6) substrates(human clinical data)N in training set735565626531746SoftwarePerformance result (%)aCASE UltraSens 68.9, Spec 87.8, Conc 77.2LeadscopeSens 87.3, Spec 85.2, Conc 86.4SciQSARSens 63.0, Spec 92.7, Conc 77.8LeadscopeR2 0.75, Q2 0.73SciQSARR2 0.74, Q2 0.72LeadscopeR2 0.67, Q2 0.64SciQSARR2 0.65, Q2 0.63LeadscopeR2 0.74, Q2 0.71SciQSARR2 0.64, Q2 0.60CASE UltraSens 43.9, Spec 87.0, Conc 74.1LeadscopeSens 60.0, Spec 89.4, Conc 80.1SciQSARSens 59.5, Spec 79.8, Conc 73.1CASE UltraSens 30.6, Spec 83.6, Conc 68.8LeadscopeSens 30.0, Spec 89.6, Conc 75.4SciQSARSens 26.3, Spec 91.5, Conc 74.7Cytochrome P450 2C9(CYP2C9) substrates(human clinical data)736Rat oral6,464ACDLabsExt. validation, RI 0.5, Q2 0.64Rat intraperitoneal3,751ACDLabsExt. validation, RI 0.5, Q2 0.56Mouse oral14,678ACDLabsExt. validation, RI 0.5, Q2 0.55Mouse intraperitoneal27,004ACDLabsExt. validation, RI 0.5, Q2 0.61Mouse intravenous14,972ACDLabsExt. validation, RI 0.5, Q2 0.66Mouse subcutaneous6,432ACDLabsExt. validation, RI 0.5, Q2 0.57CASE UltraSens 69.4, Spec 92.5, Conc 82.5LeadscopeSens 78.6, Spec 82.5, Conc 80.7SciQSARSens 73.1, Spec 77.3, Conc 75.3CASE UltraSens 63.4, Spec 86.7, Conc 75.8LeadscopeSens 79.5, Spec 81.7, Conc 80.6SciQSARSens 77.3, Spec 71.3, Conc 74.3CASE UltraSens 76.7, Spec 93.9, Conc 89.3LeadscopeSens 75.0, Spec 96.3, Conc 90.8SciQSARSens 61.6, Spec 96.8, Conc 85.8Maximum recommendeddaily dose (MRDD) inhumans 2.69 mg/kg-2bw/dSevere skin irritation inrabbitAllergic contact dermatitisin guinea pig and human1,2228361,03215
User manual - December 2018EndpointRespiratory sensitisation inhumansProfiler : Protein binding byOASIS 1.4Profilerb: Protein binding byOECDProfilerb: Protein bindingpotency Cys (DPRA 13%)Profilerb: Protein bindingpotency Lys (DPRA 13%)Profilerb: Keratinocyte geneexpressionbEstrogen Receptor α binding(human in vitro) ALLEstrogen Receptor α binding(human in vitro) BalancedEstrogen Receptor αactivation (human in vitro)Profiler : Estrogen ReceptorBindingProfilerb: rtER ExpertSystem - USEPAbAndrogen Receptorantagonism (human in vitro)N in training set80N/A (101 alerts)N/A(104 alerts)SoftwarePerformance result (%)aCASE UltraSens 68.2, Spec 96.3, Conc 86.4LeadscopeSens 91.7, Spec 95.5, Conc 93.9SciQSARSens 80.0, Spec 87.5, Conc 83.8OECD QSAR ToolboxOECD QSAR ToolboxN/AN/A229 (77 alerts)OECD QSAR ToolboxN/A228 (73 alerts)OECD QSAR ToolboxN/A 300 (21 alerts)OECD QSAR ToolboxN/ACASE UltraSens 60.9, Spec 95.2, Conc 85.7LeadscopeSens 75.2, Spec 90.1, Conc 84.7SciQSARSens 67.3, Spec 89.0, Conc 81.3CASE UltraSens 81.7, Spec 89.2, Conc 85.4LeadscopeSens 83.7, Spec 89.0, Conc 86.3SciQSARSens 76.1, Spec 83.3 Conc 79.8CASE UltraSens 73.7, Spec 86.6, Conc 80.9LeadscopeSens 73.1, Spec 86.6, Conc 80.7SciQSARSens 77.9, Spec 80.8, Conc 79.6N/AOECD QSAR ToolboxN/AN/AOECD QSAR ToolboxN/ACASE UltraSens 57.4, Spec 87.2, Conc 78.3LeadscopeSens 51.7, Spec 91.2, Conc 80.4SciQSARSens 56.3 Spec 91.1, Conc 81.9802595481874Arylhydrocarbon (AhR)Activation – Rational finalmodel4,625LeadscopeTBA (manuscript under review)Arylhydrocarbon (AhR)Activation – Random finalmodel4,625LeadscopeTBA (manuscript under review)CASE UltraQ2 0.59LeadscopeR2 0.83, Q2 0.68SciQSARR2 0.64, Q2 0.57CASE UltraQ2 0.61Thyroid receptor α binding –log(IC50 in µM) (human invitro)11813016
User manual - December 2018EndpointThyroid receptor β binding –log(IC50 in µM) (human invitro)Thyroperoxidase (TPO)inhibition QSAR1 (rat invitro)Thyroperoxidase (TPO)inhibition QSAR2 (rat invitro)Pregnane X receptor binding(human in vitro)Pregnane X Receptor (PXR)Binding (Human in vitro)NEWN in training setSoftwarePerformance result (%)aLeadscopeR2 0.83, Q2 0.64SciQSARR2 0.65, Q2 0.58877LeadscopeSens 72.4, Spec 89.0, BA 80.6Ext. validation: Sens 79.7,Spec 90.8, BA 85.31,519LeadscopeSens 75.6, Spec 89.8, BA 82.7CASE UltraSens 72.3, Spec 89.0, Conc 78.5LeadscopeSens 80.4, Spec 80.4, Conc 80.4SciQSARSens 79.9, Spec 82.7, Conc 81.46311,504LeadscopePregnane X Receptor (PXR)Activation (Human in vitro)2,176LeadscopePregnane X Receptor (PXR)Activation (Rat in vitro)2,330LeadscopeCYP3A4 Induction (Humanin vitro)2,271LeadscopeTeratogenic potential inHumansAshby structural alertsBacterial reverse mutationtest (Ames test in S.typhimurium in vitro)Direct acting Amesmu
Toolbox simulated transformation products have been included . If alerts werefor some profilers predicted, they are included in the database, and if none were found or the compound could not be predicted by the Toolbox this is likewise include