Transcription
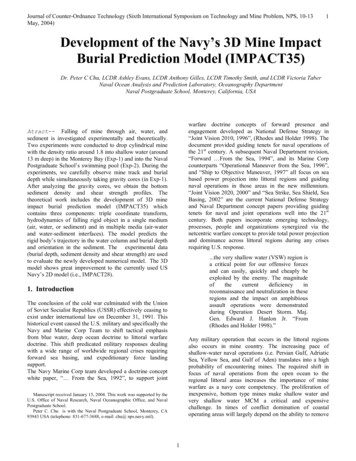
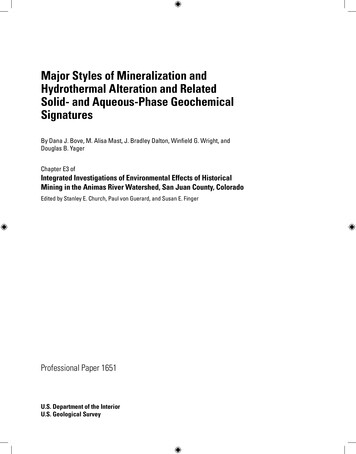
The Journal of Counter-Ordnance Technology (Fifth International Symposium on Technology and Mine Problem)1Mine Impact Burial Prediction ExperimentPeter C. Chu, Timothy B. Smith, and Steven D. Haegermine was a simple watertight wooden keg, loaded withgunpowder, which hung from a float and, at that time, wascalled a torpedo. In 1777, under orders from GeneralWashington, a number of the kegs were set adrift by Bushnellin an attempt to destroy a fleet of British warships anchored inthe Delaware River off Philadelphia. The attempt failed. Butthe naval mine has since - through the American Civil War,World Wars I and II, and the Korean and Southeast AsianConflicts - gained a reputation as one of the Navy's leastcostly, yet most effective, offensive and defensive weapons.Abstract-- Mine Impact Burial Prediction Experiment(MIBEX) was conducted at Monterey Bay on May 23, 2000 usinga simulated mine. During the experiment, we carefully observemine track and mine burial depth while simultaneously takinggravity cores. After analyzing the gravity cores, we obtain thebottom sediment shear strength data set. Such synchronousmine burial depth and shear strength data were used to evaluatethe Navy's Impact Burial Prediction Model (IBPM) whichcreates a two-dimensional time history of a bottom mine as itfalls through air, water, and sediment. The output of the modelis the predicted burial depth of the mine in the sediment inmeters, as well as height, area, and volume protruding. Modelinput consists of environmental parameters and minecharacteristics, as well as parameters describing the mine’srelease. The MIBEX data show that the current IBPM modelneeds to be improved.Modern times have not changed the value placed on mines.Although technology has improved and new and moreeffective mines have been invented, many third worldcountries still employ mines of the simplest design. Minedetection capability is now in the spotlight.Mines are deployed one of three ways: Aircraft, seasurface, or subsurface. Mines will float on the surfacethrough inherent buoyancy, float just below the surface usingsome sort of anchoring mechanism or lodge themselves in thesea bottom. They can detonate by contact, disruption of amagnetic field, or by acoustic detection. For the mines whichimbed themselves in the sea floor, the sensitivity of the minetrigger is directly proportional to the amount of the mineprotruding from the sea floor. Because of this, it is importantto be able to predict the burial depth of the mine dependingupon deployment platform, sediment type and oceanographicconditions.Key Words—Mine impact burial prediction experiment(MIBEX), mine impact burial prediction model (IMPACT25),gravity core, and sediment transport.INTRODUCTIONSince the conclusion of the cold war, emphasis has beenshifted from blue-water, open ocean battle tactics tolittoral warfare. It is in this arena that mine warfare hasbecome an all-important issue. Mine warfare is one of mostcost efficient ways to protect critical waterways and inflictserious damage upon a fleet. The fear inflicted upon anenemy fleet after knowledge of the presence of mines is apsychological bonus that enhances their effectiveness as aweapon. Many mines are of the same design as theircounterparts from thirty or forty years ago. Their simplicity,effectiveness, and cost efficiency make them an appealingweapon for third world countries.Chu et al. (2000) reviewed the current status of currentnumerical models for simulating the mine burial process andconstituting the viable means for burial depth prediction.These models provided some information for clearing an areaof mines. However, the Impact Burial (IB) model wasdeveloped to determine the depth at which the mine comes torest in the sediment upon impact and at which only themomentum equations of the mine gravity center is considered(Arnone and Bowen, 1980). The IB model was designed tocreate a two-dimensional time history of a cylindrical mine asit falls through air, water, and sediment phases (Figure 1).The burial depth of the mine in the marine sediment is thencalculated from the mine’s velocity on contact with thesediment and the sediment characteristics. Several revisionshave been made to the model to refine the physics and allowfor more realistic geometry and more extensive input from theuser. Most notable are the changes made by Satkowiak(1987) and Hurst (1991). Other revisions involved translatingto newer computer language. Currently, the model allows theThere are hundreds of variations of mines and they aretriggered various ways. In 1776, an American, DavidBushnell, who is also recognized as the inventor of America’sfirst submarine, invented the first known sea mine. Bushnell'sManuscript received January 15, 2002. This work was supported by theU.S. Office of Naval Research, Naval Oceanographic Office, and NavalPostgraduate School.Peter C. Chu is with the Naval Postgraduate School, Monterey, CA 93943USA (telephone: 831-677-3688, e-mail: chu@ nps.navy.mil).T. B. Smith., is with Naval Postgraduate School, Monterey, CA 93943USA (e-mail: timosmith@erathlink.net).S.D. Haeger is with the Naval Oceanographic Office, Stennis SpaceCenter,MS 39529 USA (e-mail: Haegers@navo.navy.mil).1
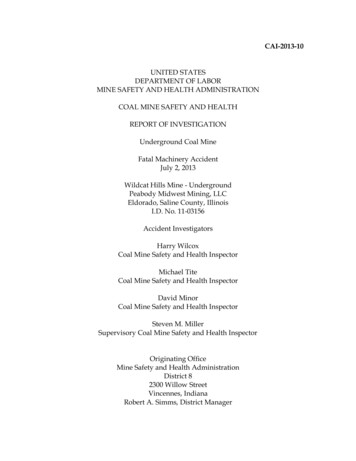
The Journal of Counter-Ordnance Technology (Fifth International Symposium on Technology and Mine Problem)2user to input nearly any value for each environmentalparameter.The most popular IB model is IMPACT25. The altitudefrom which the mine is released determines the velocity andattitude of the mine as it reaches the air-water interface.IMPACT25 simulates one of the two kinds of mine motion:(1) falling downward without any rotation around its gravitycenter, and (2) “tumbling” with a constant rate of rotation.The attitude of the mine upon reaching the water is impactedgreatly by the release altitude. Although not accounted for inthe model, this rotation rate may be caused or affected bywind.In the water phase, this rotation rate is dampedsignificantly. However, it still has a great effect on the anglethe mine makes with the sediment upon impact. Currents mayaffect the rotation rate in the model, but again are notaccounted for in the model. The water depth only has aneffect on impact velocity if it is less than that required for themine to reach terminal velocity, the velocity at which thedeceleration due to frictional drag is equal to the accelerationfrom gravity. The velocity at which this equilibrium isreached is a function of the weight of the mine. Since minesare laid in shipping channels almost exclusively, one mayassume that water depths in excess of that required for a mineto reach terminal velocity are the norm. Water temperaturehas an effect on the viscosity of seawater, and hence increasesthe drag of the seawater on the mine.Fig. 1. The trajectory of a cylindrical mine as it falls through three phases: air,water, and sediment. Labels are parameters used by the model to calculate thevelocity, attitude, and burial depth of the mine.This study includes three parts: (1) collecting synchronousmine impact burial and environmental data through the MineImpact Burial Experiment (MIBEX) at Monterey Bay, (2)analyzing the real-time environmental data collected at theRapid environmental Assessment Laboratory (REAL), and (3)evaluating IMPACT25 using the MIBEX data.I. ENVIRONMENT OF THE MONTEREY BAYA. Geology and StructureThe experiment was conducted in the Monterey BayNational Marine Sanctuary (MBNMS) off the central coast ofCalifornia.The location was chosen because of itsaccessibility and the oceanographic data collection capabilityalready in place. The MBNMS spans nearly 10,000 km² inthe central California region, and extends offshore an averagedistance of approximately 50 km (a maximum distance ofnearly 100 km in the Monterey Bay area and a minimumdistance of 15 km off Partington Point) between the FarallonIslands in the north and Morro Bay in the south (Figure 2).Data input for the IMPACT25 model can be split into twocategories. The first category is rudimentary deployment andoceanographic water column data. The second category ismore detailed sediment data. Penetration depth predictabilityis going to depend directly on impact velocity, and sedimentdensity and shear strength values. The model puts sufficientemphasis in the utilization of sediment parameters butidealistic conditions for predicting impact velocity.It contains one of the world's most geologically diverse andcomplex seafloors and continental margins. The MBNMS islocated on a plate boundary, which separates the NorthAmerican Plate from the Pacific Plate, and is marked by theSan Andreas fault system. This is an active tectonic regionwith common occurrences of earthquakes, submarinelandslides, turbidity currents, flood discharges and coastalerosion. It is also a region of extensive natural and economicresources.The output of the model is in question due the instability ofocean sediment. Until this experiment was conducted, datedsediment values were used when running the code that led toskepticism in the validity of it’s output. Changes in the watercolumn due to turbulence and currents above an impact areahave a significant effect on sediment characteristics in theupper layers. These same changes in the water column have adirect effect on the impact velocity and orientation and are notaddressed by the model. Sensitivity studies (Taber 1999; Chuet al. 2000) indicate the importance of the environment;especially on the bottom shear strength in the mine impactburial.Before transferring the IMPACT25 model for navaloperation use, we should verify the model using synchronousmine impact burial and environmental data. Unfortunately, itis very hard to find such a data set. The current data sets areeither the mine data or the environmental data only. It istherefore a high priority to collect the data for the evaluationof the IMPACT25 model.Coastal topography varies greatly, encompassing steepbluffs with flat-topped terraces and pocket beaches to thenorth; large sandy beaches bordered by cliff and large dunefields mid-sanctuary; and predominately steep, rocky cliffs tothe south. Low- to high-relief mountain ranges and broad, flatfloored valleys are prevalent farther inland.The Santa Cruz and Gabilan mountain ranges dominate thetopography in the northern and central half of the region. Twomajor rivers (San Lorenzo and Pajaro Rivers) and a majorcreek (Scott Creek) enter Monterey Bay from these highlands2
The Journal of Counter-Ordnance Technology (Fifth International Symposium on Technology and Mine Problem)through well-defined valleys (Figure 2). Elkhorn Slough, anold river estuary that today is occupied only by tidal saltmarshes, extends inland from Moss Landing for more than 10km. The broad, extensive Salinas Valley and the northernSanta Lucia Range are the dominant topographic features inthe southern half of the region; the Salinas River is the majordrainage system (Figure 2). South of Monterey, the west flankof the Santa Lucia Range drops abruptly into the ocean. Here,the valleys of the Carmel and Little Sur Rivers are dominanttopographic features. From Point Sur to Morro Bay manystreams and creeks drain the southern Santa Lucias and cut thesteep western face of the mountain range.3sanctuary, about 7,500 square kilometers of ocean andseafloor off central California, is home to a rich diversity ofmarine life. More than 30 species of marine mammals live inor visit the Bay, making it one of the largest collections in thenorthern hemisphere. For example, Bairds Beaked Whalenavigates the canyon to make infrequent surface visits to theBay. The sanctuary is rich in marine life because nutrientenriched seawater upwells along the steep margin fromdeeper, colder waters.Sediments derived from land accumulate in the marineenvironment, often at a temporary location awaiting a largestorm, strong currents, or a quick shake from an earthquake tosend them cascading down the canyon. The region istectonically active, a fact underscored by the 7.0-magnitudeLoma Prieta earthquake in 1989. Much has been learned fromthat event, including indications that the style of faulting maybe significantly different than previously thought. Suchdifferences have implications for how rocks move and react toshock waves, which, in turn, influence the size of earthquakes.Further studies are needed to determine how these rocks arepackaged, how the packages move, and what effect thatmovement has on the seafloor and adjacent coast. Sedimentsdeposited on the shelf are affected by winter storms, whichresuspend particles and transport them to new locations. Forexample, giant landslides and currents of turbid materialsoccur in Monterey Canyon when waves or earthquakesdestabilize huge piles of sediment at the head of the canyon.These slides and flows are well documented, but the extent ofmovement is not well known. Recent mass movements ofsediments have moved electronic instruments on the seafloormiles down the canyon. Movement of sediments along thecoast and their ultimate accumulation more than 300kilometers from the shore are topics of study requiring a longterm research commitment.The MBNMS is located along the active transformboundary (the San Andreas fault system) separating thePacific Plate from the North American Plate. Here the faultsystem is over 100 km wide and incorporates faults in theoffshore, including those of the Palo Colorado-San Gregorioand Monterey Bay fault zones. These fault zones areseismically active, and in many places offset the seafloor orQuaternary sedimentary rocks. A paleo-subduction zoneoccurs along the MBNMS western boundary; the fossil thrustfaults in this zone appear to control the structure at the base ofthe continental slope. Most of the northern and central parts ofthe MBNMS lie within the Salinian block. It is composed ofallochthonous (i.e. transported to local region) Cretaceousgranitic basement material, primarily overlain with Neogenemarine sedimentary units; it has been tectonically slivered intoits present position. This block has been carried upon thePacific Plate as the plate moves northward, slipping along theSan Andreas fault for about the last twenty-one million years.In the Monterey Bay region, the plate boundary betweenthe North American and Pacific plates is comprised of the SanAndreas fault system, consisting of the Hayward-Calaverasand San Andreas fault zones on land, and the offshore PaloColorado-San Gregorio fault zones. The Palo Colorado-SanGregorio is the major active fault zone within the MBNMS. Itis a right-lateral strike-slip fault zone oriented generally northsouth, comprised of two or more parallel and fairly continuousfault segments that extend at least 100 km from Point AñoNuevo in the north to Garrapata Beach (10 km north of PointSur). The amount of right-lateral offset along this fault zonehas been measured by different methods and at severallocations; offset varies from 80-90 km to as much as 150 km.B. OceanographyMBNMS including Monterey Bay and the coastal areabetween the Gulf of the Farallones and Point Piedras Blancas,is closely tied to processes of the California Current. TheCalifornia Current is an eastern boundary current that hasbeen characterized generally as a broad, shallow, slowsouthward moving current exhibiting high spatial andtemporal variability. The California Current is the eastwardportion of the clockwise North Pacific Gyre and transportslow salinity, cool water equatorward. Associated with thecoastal surface flow is a poleward undercurrent, the CaliforniaUndercurrent. Even though the California Current is one ofthe most-studied oceanographic features in the oceans, it isdifficult to predict at any particular instant the location of itsvelocity core, its speed, or direction. Indeed, at variouslocations observers might characterize the current as southflowing (as it often is in offshore regions), westward flowing(as is frequently observed in a coastal jet near Point Reyes), oreastward flowing (as found in the southern regions of suchjets). At times, principally in winter, the nearshore currentflows northward.The Monterey Bay fault zone is a wide ( 10 km), enechelon (i.e. composed of short, discontinuous, offset, roughlyparallel faults) formation comprised of many fault segmentsranging from 5 km or less up to 15 km in length. TheMonterey Bay fault zone is either truncated or merges with theSan Gregorio fault segment of the Palo Colorado-SanGregorio fault zone.Monterey Canyon, the most dramatic submarinefeature of the sanctuary, rivals the Grand Canyon in relief andtopographic complexity. Monterey Canyon ranks among thelarger canyons of the world and has a richness of life thatexceeds that of most land and marine areas. The marine3
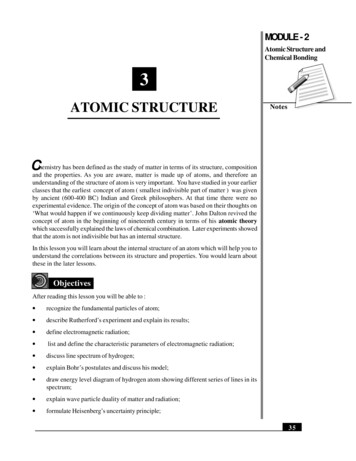
The Journal of Counter-Ordnance Technology (Fifth International Symposium on Technology and Mine Problem)The California Current can be divided into three regions(based on the seasonal amplitude variation and standarddeviation of dynamic height): an offshore oceanic regime, acoastal regime and an intervening transition zone. Thistransition zone lies approximately 200-300 km west of PointSur. Geostrophic speeds in the core of the California Currentmay approach 25 cm/s, but generally are 5 to 10 cm/s (0.1 to0.2 knots). The core of the California Current lies in thesalinity minimum about 300 km offshore of Point Sur, withinthe transition zone, and is not associated generally with athermal gradient.42. MIBEX AT THE MONTEREY BAYA. Experiment PreparationA major purpose of MIBEX is to collect synchronizedenvironmental and mine burial data. To accomplish this, theMonterey Inner Shelf Observatory (MISO) at the NavalPostgraduate School (NPS) off of Del Monte Beach inMonterey Bay was selected to provide the oceanenvironmental data such as waves and currents. After anexploratory dive near MISO, the bottom was found to becomposed of “sandy ledges” and the water depth wasapproximately 12 meters (similar to real world bottom miningenvironments). Jon Heine was contacted and solicited to bethe dive supervisor for the experiment. It was ascertained thata minimum of four divers would be needed to safely go upand down the 12-meter depth 20 times. Heine’s divers wouldalso take the gravity cores and film the barrel entry and otherpertinent underwater evolutions.The California Current is richly populated with semistationary jets and eddies. The importance of these features,which represent the highly variable oceanographic "weather"of the California Current, lies in their offshore transport ofcool, nutrient-rich upwelled water. This extends the effects ofnearshore upwelling which is confined to a band about 50 kmwide to several hundred km. Cross-shore velocities may reach1 m/s which is an order of magnitude greater thancharacteristic speeds of the California Current core. In whatare called "squirts," the flow may be directed offshore, andwhere the "squirt" dissipates elongated "hammerhead"features evolve. Between mesoscale eddies, the flow isdirected offshore north of cyclonic eddies and onshore southof them. A jet may be found off Point Sur that transports cool,upwelled waters offshore 100 km. The "San Francisco Eddy"is a semi-permanent cyclonic eddy northwest of MontereyBay, while other observations describe anti-cyclonic eddies inthis region. Current meter measurements and estimatedgeostrophic flow in an anti-cyclonic eddy southeast ofMonterey Bay. Between that eddy and a cyclonic eddy justnorth of it strong onshore geostrophic flow was observed.The next task was contacting the United States GeologicalSurvey (USGS) office to determine the proper procedure fortaking and analyzing gravity cores.Dr. Homa Leevolunteered to provide assistance on May 31, 2000 andoffered the use of the USGS freezer to store the gravity coresafter the experiment. Prior to this happening, gravity coreshad to be fashioned. 2 ½ inch polycarbonate piping andrubber stoppers were ordered. The polycarbonate piping wascut into eight, three-foot lengths and four, two-foot lengths.These were carried in a special rack designed to transport thesediment intact to the USGS.On the afternoon of May 22, 2000, the R/V John Martinwas loaded with the mine, gravity cores and dive equipment.Captain Lee Bradford supplied a seaforth quick-release to beused when dropping the barrel. This quick release could beeasily fastened and released by a diver in the water, thereforeproviding the greatest margin of safety for the divers. On themorning of May 22, 2000, Andy Andersen of theOceanography department at NPS, contacted theEnvironmental Health office and secured a 55 gallon drum(Figure 3) which was to be modeled as the “mine.” Although“ribbed,” it was assumed the symmetrical design would havelittle effect on hydrodynamics in the water column.Fig. 2. The Monterey Bay National Marine Sanctuary.Fig. 3. The model mine.4
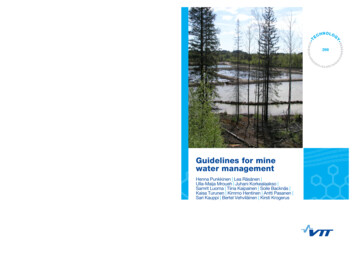
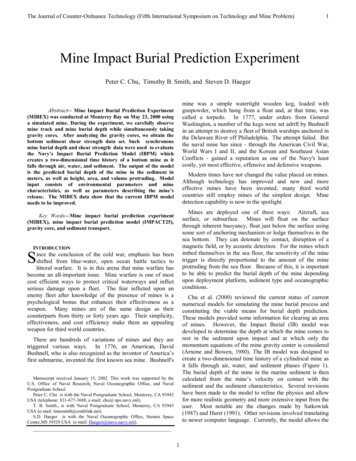
The Journal of Counter-Ordnance Technology (Fifth International Symposium on Technology and Mine Problem)5B. ExperimentTABLE 1 MEASUERING RANGES OF THE GRAVITY CORESOn May 23, 2000, the R/V John Martin got underway at0630. The team was on location and in the water by 0805.After an extensive safety discussion, it was decided that thebarrel/mine would be released while touching the surface.This would be to eliminate any chance of inertial effectscaused by uneven introduction into the air-sea interface. Thisalso set the initial velocity parameter in the code to zero.WEIGHTApexAnglePenetration(mm)30 30 60 60 4.0 – 15.05.0 – 15.05.0 – 15.05.0 – 20.0(g)4001006010The barrel was to be released 20 times, although, onlyseventeen drops were actually made because of diverlimitations. The diver would snap the quick-release shackleon the barrel and then dive down to conduct measurements.The average depth of the water was 13 meters. Since it wasuncertain the path the barrel would follow, both the releasingdiver and a second safety diver would stay on the surface untilafter the barrel had dropped. Once reaching the bottom, onediver would take penetration measurements using a meterstick marked at millimeter increments while the other wouldtake a gravity core.Undrainedshearstrength(kPa)25 – 1.84 – 0.450.6 – 0.0670.10–0.0063B. Sediment ProfilesPrevious studies (Taber 1999; Chu et al. 2000a,b) showedthat the sediment parameters are the most critical element indetermining how deep the mine was buried when it came torest. Sensitivity to the alteration of sediment density and shearstrength was tested using six sediment profiles including threeprofiles from Sydney Harbor (Mulhearn, 1993) and threeprofiles available for selection in the IB model. The profilesincluded in the model are called simply “softsed”, “medsed”,and “hardsed” and do not clearly correspond to specificsediment types.During the MIBEX at the Monterey Bay, we obtained 17gravity cores. Sediment density was observed to generallyincrease until approximately 6-9 cm below the surface afterwhich it would decrease (Figure 4). Sediment shear strengthtended to increase as depth increased (Figure 5).After 17 drops, the divers began to run out of air andresults were not varying greatly so the decision was made toend the experiment. Upon return to the Monterey BayAquarium Research Institute, the gravity cores were takenimmediately to the USGS Laboratories in Menlo Park,California where they were refrigerated until the analysiscould be performed on May 31 – June 1, 2000.3. SEDIMENT DATA ANALYSISA. Gravity Core AnalysisAnalysis of the gravity cores was begun on May 31, 2000 atthe USGS Laboratories in Menlo Park, California with the aidof a graduate student, Priscilla Barnes. The gravity cores weresliced into two-centimeter segments to a depth of tencentimeters, and then sliced into four-centimeter segments. AFall Cone Apparatus (Model G-200) was used to determinesediment shear strength.In the test, it is assumed that the shear strength of sedimentat constant penetration of a cone is directly proportional to theweight of the cone and the relation between undrained shearstrength s and the penetration h of a cone of weight Q is givenby:2s KQ / hwhere K is a constant which depends mainly on the angle ofthe cone, but is also influenced by the sensitivity of theclay/sediment. Four different cones are used with thisinstrument, each one having the measuring range listed inTable 1. The cones are suspended from a permanent magnet.By pressing a knob, the magnet is moved so that the magneticfield is broken momentarily, and the cone is released.Measurements are taken of penetration depth and theevolution is repeated five times per sediment slice. Thesevalues are then averaged and correlated with a table whichgives shear strength.Fig. 4 Sediment density profile at the gravity core #1.5
The Journal of Counter-Ordnance Technology (Fifth International Symposium on Technology and Mine Problem)6the surf zone. Surface observations of the surf zone andbreaking waves are made from an automated digital cameralocated on the sand dune overlooking the underwater frame.By using a high bandwidth multifiber optic and power cableconnected to a shore terminus, long term measurements ofthese important coastal processes can be made for use inresearch programs and teaching by faculty of theOceanography Department at NPS and shared with otherusers. Hourly summaries of the data sets are available throughthe main MISO web site. An offshore directional wave buoydeployed in January 2000 provides hourly updated directionalwave spectra and wave height / direction time series.B. Real-Time Wave DataAnalysis of wave height data provided by the MISOexperiment shows a significant wave motion of approximately0.5 meters (Figure 8).Oscillation of wave heightssignificantly affects water depth and subsequently terminalvelocity of the mine upon impact. This is especiallysignificant when running the model in shallow depths.Although not a parameter considered in the IB model,wave action has a direct effect on water depth and, therefore,on velocity of the mine as it reaches the sediment interface(Taber 1999). This effect only becomes significant when theratio of water depth to wave height is high, and only at verylow release altitudes.Fig. 5 Sediment shear strength profile at the gravity core #1.C. Sediment Density-Shear Strength RelationHayter (1986) discussed an equation originallyderived by Krone (1963) for deriving shear strength, Su, fromdensity using empirically derived coefficients α and β:Su αρβ(2)Values for α and β must be calculated for each separatesediment type, after which the shear strength can simply becalculated using the coefficients. The scatter diagram betweenshear strength and density (Figure 6) doesn't show such anexponential relationship. However, it does indicate that thehigher the density, the higher the shear strength.Shear Strength Vs. Density403530Core #1Core #225Shear Strength (kPA)Core #34. REAL/MISO DATA ANALYSISCore #5Core #6Core #720Core #8Core #9Core #1015Core #11A. General Information of REAL/MISOCore #1210The Monterey Inner Shelf Observatory (MISO) is acomponent of the Rapid Environmental AssessmentLaboratory (REAL) being developed by the oceanography andmeteorology departments at NPS (Figure 7). The REALlaboratory encompasses a range of littoral oceanographyobservation and modeling programs focused on littoral(coastal) oceanography. MISO, designed and implemented byResearch Associate Professor Tim Stanton, has a long termcabled instrument frame deployed at the southern end ofMonterey Bay in 12m of water, about 600m from theshoreline, with support instruments on the sand dunes inshorefrom the underwater frame. The instruments on the 12m frameare designed to study the interaction of winds, waves and thesediment bed in the inner continental shelf, just offshore from501800185019001950200020502100Density (kg/m3 )Fig. 6. Shear strength versus density near MISO at Del Monte beach of theMonterey Bay.6
The Journal of Counter-Ordnance Technology (Fifth International Symposium on Technology and Mine Problem)7Hs ig For M IS O S ite0.60.5Hs ig(m )0.40.30.20.10144145146147Yearday of 2000148149150Fig. 8. Significant wave height during MIBEX.Fig. 7. REAL phase-1 implementation.Penetration of the cylindrical mine into the bottomsediment depends primarily on the attitude and velocity of themine upon impact, as well as the sediment properties ofdensity and shear strength. Initial impact of the cylindricalmine into the sediment creates a cavity in which the fluidproperties of water and sediment are interacting. The kineticviscosity of the sediment, ΛS, is not a pure constant, but ratheris equal to the water viscosity, Λw, plus that resulting from theshear stress of the sediment:Λs Λw Su / ( s dV/dz)(5)where s is the density of the sediment and Su is the shearstrength.5. MINE IMPACT BURIALA. Hydrodynamic ProcessesIMPACT25 tries to estimate the characteristics of the watercolumn by using fluid drag approximations in its calculations.The essential elements of the mine impact burial modeltranslate into the science and engineering of hydrodynamicprocess of a falling object and of sediment transport. Thecurrent model is only based on the momentum balance of thefalling mine,dV(3) dt dm Fw,a Fb FdB. Mine Burial DynamicsThe vertical momentum balance of a mine in the sedimentphase is given by:(6)Mr dV/dt Fw,a Fb Fd Fc Fswhere Fb is the buoyancy force in the sediment, Fc is thecompressive force, and FS is the shear force. Fc and Fs areadditional forces (different from air and water phases) exertedon the mine by the sediment. They are proportional to shearstrength of the sediment and the projected area of the mine. Ifthe mine is a right circular cylinder, the compressive force istwice the shear force:Fs Su A(7)Fc 2 Fs ,The mine burial depth is predicted by integrating (6) withrespect to time until the mine velocity becomes zero.Accurate values for sediment properties are essential to theaccuracy of t
momentum equations of the mine gravity center is considered (Arnone and Bowen, 1980). The IB model was designed to create a two-dimensional time history of a cylindrical mine as it falls through air, water, and sediment phases (Figure 1). Th