Transcription
INTRODUCTIONTOMICROECONOMICSE201 Dr. David A. DiltsDepartment of Economics, School of Business and Management SciencesIndiana - Purdue University - Fort Wayne May 10, 1995First Revision July 14, 1995Second Revision May 5, 1996Third Revision August 16, 1996Fourth Revision May 15, 2003Fifth Revision March 31, 2004Sixth Revision July 7, 2004
Introduction to Microeconomics, E2018 Dr. David A. DiltsAll rights reserved. No portion of this bookmay be reproduced, transmitted, or stored, byany process or technique, without the expresswritten consent of Dr. David A. Dilts1992, 1993, 1994, 1995 ,1996, 2003 and 2004Published by Indiana - Purdue University - Fort Waynefor use in classes offered by the Department of Economics,School of Business and Management Sciences at I.P.F.W.by permission of Dr. David A. Dilts
TABLE OF CONTENTSPreface. iiSyllabus. ivI. Lecture Notes1. Introduction to Economics .2. Economic Problems.3. Interdependence and the Global Economy .4. Supply and Demand .5. Elasticity .6. Consumer Behavior.7. Costs .8. Competition .9. Monopoly .10. Resource Markets .11. Wage Determination.12. Epilogue.2712182933374350566068II. Reading Assignments1. Introduction to Economics . 712. Economic Problems. 873. Interdependence and the Global Economy . 1014. Supply and Demand . 1165. Elasticity . 1346. Consumer Behavior. 1467. Costs . 1548. Competition . 1659. Monopoly . 17910. Resource Markets . 19111. Wage Determination. 20012. Epilogue. 217III. Appendix ASample Midterm Examination . 222Sample Final Examination. 229IV. Appendix BBibliography, book list . 236i
PREFACEThis Course Guide was developed in part because of the high cost of collegetextbooks, and in part, to help organize students studying by providing lecture notes.This Guide was made possible because the administration of IPFW had the foresight tomake the campus printing services available to duplicate these sorts of materials, andprovide them at cost through the auspices of the University Bookstore in Kettler Hall.Without the active participation of both the campus duplicating services, and its mostcooperative staff, and the bookstore this would not be available.The department, school nor the professor make anything whatsoever from thisGuide. In fact, the department s budget and the professor s own resources are used inthe writing of the Guide, and the numerous draft copies that are produced in therevisions of this document. Like the sign in the Mom and Pop bait shop on Big BarbeeLake says, “This is a non-profit organization, wasn’t planned to be B it just sorta workedout that way.” Well, actually it was planned to be a non-profit enterprise in this particularcase.The professor also wishes to acknowledge the fact that several students haveproposed changes, improvements, caught errors, and helped to make this documentmore useful as a learning tool. Naturally, any errors of omission or commission arethose of the professor alone.ii
Introduction & Use of GuideThis Course Guide is provided to assist students in mastering the subject matterpresented E201, Introduction to Microeconomics. The commercially available studentguides and workbooks are notoriously inadequate and are simply of little value. Atseveral institutions, prepared course materials are made available to students to assisttheir learning. What research has been done concerning these course specificmaterials, suggests that students' performances are enhanced by having access tothese types of materials. Because microeconomics is such an important foundation forbusiness, engineering, and the social sciences this Guide has been prepared.The purpose of this Course Guide is fourfold. First, the course syllabus isincluded in the Guide. Second, the Guide provides the student a listing of the keyconcepts covered in the lectures. Third, the Guide provides students with problems andstudy-guides to aid each individual in the retaining the materials presented by the textand lecture. Fourth, sample exams are offered as self-test exercises and to givestudents an idea of the level of mastery expected in this course.OrganizationThe Guide is divided into eleven units, following the organization of the TentativeCourse Outline found in the syllabus. At the end of each chapters in the readingassignments there is a section containing the key concepts developed in the chapter,sample exam questions and a brief study guide. Also in the Guide is the coursesyllabus included before the eleven sections covering the substantive portions of thecourse. Following the reading assignments are the lecture notes for each chapter. Thefinal section of the Guide contains sample examinations, including answers.Note to StudentsThere is no substitute for doing the reading assignments, attending class, andworking through the material. A teacher cannot cause a student to learn, all a teachercan do is to organize and present the material, grades can provide a small extrinsicreward for accomplishment, but it is the student's ability, effort, and desire thatdetermine how much and how well they will learn. It is hoped this Guide will help in thelearning effort.iii
SYLLABUSE201, Introduction to MicroeconomicsDr. David A. DiltsRoom 340D Neff HallPhone 481-6486Department of Economics and FinanceSchool of Business and Management SciencesIndiana - Purdue University - Fort WayneCOURSE POLICIES1. In all respects, the policies of the School, Department, IPFW and the Universityshall be applied in this course.2. Office hours will be posted on the professor's door, appointments may also bearranged. The Professor's office is Neff 340D.3. The following grade scale will be applied in this course for determination of finalgrades:ABCDF100 - 90 percent89 - 80 percent79 - 70 percent69 - 60 percentbelow 60 percentAll final grade calculations shall be rounded up. In other words, 69.01 and 69.99percent are both considered 70 percent and will earn the student a grade of C.4. The majority of undergraduate economics courses this professor has taught havehad average final grades that fall within the range centered on 2.0 on a 4.0 scale.5. Course requirements:The mid-term examination is worth 40% of the final grade, the final examinationis worth 50% of the final grade, and there will be at least three quizzes, the besttwo scores on these quizzes will be worth 10% of the final grade.A. Examinations will consist of objective items. Examinations will beworth 100 points, and will consist of twenty multiple-choicequestions (worth four points each), and twenty true-false questions(worth one point each).B. Quizzes are worth twenty points each, and will consist ofiv
three multiple choice questions (four points each) and fourtrue false questions (worth two points each)C. If there is a 10-point improvement on the final exam overwhat was earned on the midterm, then the weights will bechange to the midterm being worth only 30 percent and thefinal exam being worth 60 percent of the final grade.6. The final examination will be given at the time and place scheduled by theuniversity. No exception is possible.7. No make-up exams will be permitted. If you cannot attend class at examtime, you must make prior arrangements to take an equivalentexamination before your classmates. Exceptions may be granted forcases where there was no possibility for an earlier examination, i.e.,injuries or illnesses, etc B things clearly beyond the student s control.8. Academic dishonesty in any form will result in a course grade of F andother sanctions as may be authorized by the university. The overwhelming preponderance of students do not engage in dishonesty, andthe professor owes it to these students to strictly police this policy.9. The provisions of these policies and the course objectives are subject totesting. These policies are also subject to change at the discretion of theprofessor and do not constitute a binding contract.COURSE OBJECTIVESThis is an introductory principles of economics course that covers topics inmicroeconomics. The breath of topical coverage limits the course objectives to subjectmatter mastery. The course will present factual material concerning the operation of thefirm and household as well as the development of rudimentary understanding ofeconomic decision-making.REQUIRED TEXTDavid A. Dilts, Introduction to Microeconomics, E201. Fort Wayne: 2004, memo.SUPPLEMENTAL TEXTv
Campbell R. McConnell and Stanley L. Bruce, Economics, twelfth edition. NewYork: McGraw-Hill. [M&B in the outline]TENTATIVE COURSE OUTLINE1. Introduction to Course and EconomicsDilts, Chapter 1M & B Chapter 12. Economic ProblemsDilts, Chapter 2M & B Chapter 23. Circular FlowDilts, Chapter 3M & B Chapter 34. The Basics of Supply and DemandDilts, Chapter 4M & B Chapter 45. Supply and Demand: ElasticitiesDilts, Chapter 5M & B Chapter 206. Consumer BehaviorDilts, Chapter 6M & B Chapter 21MIDTERM EXAMINATION7. Costs of ProductionDilts, Chapter 7M & B Chapter 22vi
8. Pure CompetitionDilts, Chapter 8M & B Chapter 239. MonopolyDilts, Chapter 9M & B Chapter 2410. Introduction to Resource MarketsDilts, Chapter 10M & B Chapter 2711. Wage DeterminationDilts, Chapter 11M & B Chapter 2812. EpilogueDilts, Chapter 12vii
LECTURENOTESINTRODUCTION TO MICROECONOMICSE2011
1. Introduction to Course and EconomicsLecture Notes1. Economics Defined - Economics is the study of the ALLOCATION of SCARCEresources to meet UNLIMITED human wants.a. Microeconomics - is concerned with decision-making by individualeconomic agents such as firms and consumers. (Subject matter of thiscourse)b. Macroeconomics - is concerned with the aggregate performance of theentire economic system. (Subject matter of the following course)c. Empirical economics - relies upon facts to present a description ofeconomic activity.d. Economic theory - relies upon principles to analyze behavior of economicagents.e. Inductive logic - creates principles from observation.f. Deductive logic - hypothesis is formulated and tested.2. Usefulness of economics - economics provides an objective mode of analysis,with rigorous models that are predictive of human behavior.a. Scientific approachb. Rational choice2
3. Assumptions in Economics - economic models of human behavior are built uponassumptions; or simplifications that permit rigorous analysis of real world events,without irrelevant complications.a. model building - models are abstractions from reality - the best model isthe one that best describes reality and is the simplest B Occam s Razor.b. simplifications:1. ceteris paribus - means all other things equal.2. There are problems with abstractions, based on assumptions.Too often, the models built are inconsistent with observed reality therefore they are faulty and require modification. When a modelis so complex that it cannot be easily communicated or itsimplications easily understood - it is less useful.4. Goals and their Relations -a. POSITIVE economics is concerned with what is;b. NORMATIVE economics is concerned with what should be.1. Economic goals are value statements, hence normative.c. Economics is not value free, there are judgments made concerning whatis important:1. Individual utility maximization versus social betterment2. Efficiency versus fairness3. More is preferred to less3
d. Most societies have one or more of the following goals, depending onhistorical context, public opinion, and socially accepted values :1. Economic efficiency,2. Economic growth,3. Economic freedom,4. Economic security,5. Equitable distribution of income,6. Full employment,7. Price level stability, and8. Reasonable balance of trade.5. Goals are subject to:a. interpretation - precise meanings and measurements will often becomethe subject of different points of view, often caused by politics.b. goals that are complementary are consistent and can often beaccomplished together.c. conflicting - where one goal precludes, or is inconsistent with another.d. priorities - rank ordering from most important to least important; againinvolving value judgments.6. The Formulation of Public and Private Policy - Policy is the creation of guidelines,regulations or law designed to affect the accomplishment of specific economicgoals.4
a. Steps in formulating policy:1. stating goals - must be measurable with specific stated objectives tobe accomplished.2. options - identify the various actions that will accomplish the statedgoals & select one, and3. evaluation - gathers and analyzes evidence to determine whetherpolicy was effective in accomplishing goal, if not re-examine optionsand select option most likely to be effective.7. Objective Thinking:a. bias - most people bring many misconceptions and biases to economics.1. Because of political beliefs and other value system componentsrational, objective thinking concerning various issues requires theshedding of these preconceptions and biases.b. fallacy of composition - is simply the mistaken belief that what is true forthe individual, must be true for the group.c. cause and effect - post hoc, ergo propter hoc - Aafter this, because of this@B fallacy.1. correlation - statistical association of two or more variables.2. causation - where one variable actually causes another.a. Granger causality states that the thing that causes another mustoccur first, that the explainer must add to the correlation, andmust be sensible.5
d. cost-benefit or economic perspective - marginal decision-making - ifbenefits of an action will reap more benefits than costs it is rational to dothat thing.1. Focus on the addition to benefit, and the addition to cost as the basisfor decision-making.a. Sunk costs have nothing to do with rational decision-making.6
2. Economic ProblemsLecture Notes1. The economizing problem involves the allocation of resources among competingwants. There is an economizing problem because there are:d. unlimited wantse. limited resources2. Resources and factor payments:d. land - includes space (i.e., location), natural resources, and what iscommonly thought of as land.1. land is paid rente. capital - are the physical assets used in production - i.e., plant andequipment.2. capital is paid interestf. labor - is the skills, abilities, knowledge (called human capital) and theeffort exerted by people in production.3. labor is paid wagesd. entrepreneurial talent - (risk taker) the economic agent who creates theenterprise.4. entrepreneurial talent is paid profits3. Full employment includes the natural rate of unemployment and down time fornormal maintenance (both capital & labor). However, full production or 100%capacity utilization cannot be maintained for a prolonged period without laborand capital breaking-down:7
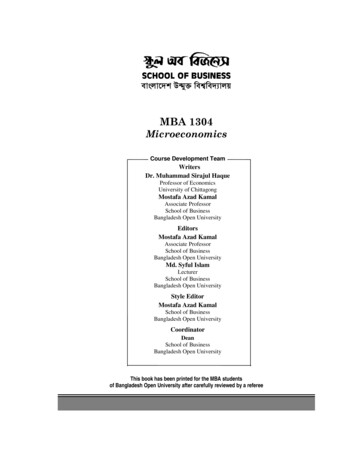
a. underemployment - utilization of a resource in a manner, which is lessthan what is consistent with full employment - using an M.D. as a practicalnurse.4. Economic Efficiency consists of the following three components:a. allocative efficiency - is measured using a concept known as ParetoSuperiority (or Optimality)1. Pareto Optimal - is that allocation where no person could be madebetter off without inflicting harm on another.2. Pareto Superior - is that allocation where the benefit received by oneperson is more than the harm inflicted on another. [cost - benefitapproach]b. technical efficiency - for a given level of output, you minimize cost or(alternatively) for a given level of cost you maximize output.c. full employment - for a system to be economically efficient then fullemployment is also required.5. Allocations of resources imply that decisions must be made, which in turninvolves choice. Every choice is costly; there is always the lost alternative -- theopportunity cost:a. opportunity cost - the next best alternative that must be foregone as aresult of a particular decision.6. The production possibilities curve is a simple model that can be used to showchoices:a. assumptions necessary to represent production possibilities in a simpleproduction possibilities curve model:8
1. efficiency2. fixed resources3. fixed technology4. two productsBeerPizza7. Law of Increasing Opportunity Costs is illustrated in the above productionpossibilities curve. Notice - as we obtain more pizza (shift to the right along thepizza axis) we have to give up large amounts of beer (downward shift along beeraxis).8. Inefficiency, unemployment and underemployment are illustrated by a pointinside the production possibilities curve, as shown above. (identifiedby this symbol):a. Inefficiency is a violation of the assumptions behind the model, but do notchange the potential output of the system.9. Economic Growth can also be illustrated with a production possibilities curve.The dashed line in the above model shows a shift to the right of the of the curvewhich is called economic growth.9
a. The only way this can happen is for there to be more resources or bettertechnology.b. Growth will change the potential output of the economy, hence the shift ofthe entire curve.10. Economic Systems rarely exist in a pure form. The following classification ofsystems is based on the dominant characteristics of those systems:a. pure capitalism - private ownership of productive capacity, very limitedgovernment, and motivated by self-interest.1. laissez faire - government hands-off; markets relied-upon to performallocations.2. costs of freedom - poverty, inequity and several social ills areassociated with the lack of protection afforded by government.b. command - government makes the decisions - with force of law (andsometimes martial force)1. Often associated with dictatorshipsc. traditional - based on social mores or ethics or other non-market, nonlegislative bases1. Christmas gift giving is traditiond. socialism - maximizes individual welfare based on perceived needs, notcontributions; generally concerned more with perceived equity thanefficiency.e. communism - everyone shares equally in the output of society (accordingto their needs), generally no private holdings of productive resources1. The former Soviet Union espoused communism, but also was mostly10
command2. Utopian movement in the U.S.f. mixed system - contains elements of more than one system - U.S.economy is a mixed system (capitalism, command, and socialism are themajor elements, with some communism and tradition)1. All of the high income, industrialized economies are mixed economiese. Even with mixed systems there are substantial variations in the amountsof socialism, capitalism, tradition, and command exist in each example.11
3. Interdependence and the Global EconomyLecture Notes1. The modern economic system is no longer the closed (i.e., U.S. only) systemupon which the debates surrounding isolationalism occurred prior to World WarII.a. Imports and Exports are increasingly importantb. Foreign investment versus U.S. investment abroad1. Outsourcing2. Technological transfersc. Balance of trade issues.1. Current accounts (import v. exports)2. Capital accounts (foreign investment)2. Capitalist Ideology - The characteristics of a capitalist economy and the ideologythat has developed concerning this paradigm are not necessarily the same thing.The elements of a capitalist ideology are:a. freedom of enterpriseb. self-interestc. competitiond. markets and prices12
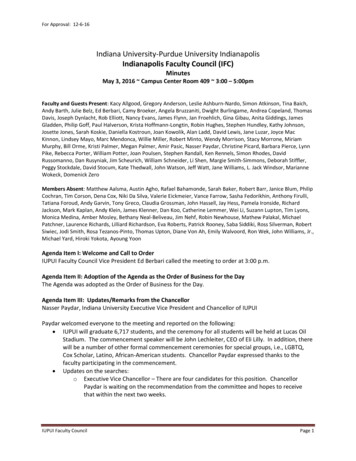
e. a very limited role for governmentf. different countries with different views of these matters B i.e., equity v.efficiency again.3. Market System Characteristics - the following characteristics are typical of asystem that relies substantially on markets for allocation of resources. Thesecharacteristics are:a. division of labor & specializationb. capital goodsc. comparative advantage - is concerned with cost advantages.1. Comparative advantage is the motivation for trade among nations andpersons.2. Terms of trade are those upon which the parties may agree anddepends on the respective cost advantages and bargaining power.4. Trade among nationsa. the reliance upon comparative advantage to motivate trade B 400The data above show what each country could produce if all of theirresources were put into each commodity. For example, if Holland put all13
their resources in tulip production they could produce 4000 tons of tulipsbut no wine. Assuming the data give the rate at which the commoditiescan be substituted, if both countries equally divided their resourcesbetween the two commodities, Belgium can produce 200 tons of tulips and2000 barrels of wine and Holland can produce 200 barrels of wine and2000 tons of tulips (for a total of 2200 units of each commodity producedby the two countries by splitting their resources among the twocommodities). If Belgium produced nothing but wine it would produce4000, and if Holland produced nothing but tulips it would produce 4000tons). If the countries traded on terms where one barrel of wine was worthone ton of tulips then both countries would have 2000 units of eachcommodity and obviously benefit from specialization and trade.b. absolute advantage for one trading partner results in no advantage totrade.1. LDCs often have no comparative advantage and hence the developedcountries, possessing absolute advantage have no incentive to trade (.2. LDCB Less Developed Country - Low-income countries B 60 B (percapita GDP of 800), middle-income countries B 75 B (per capital GDPof 8000).3. High income countries and developed countries (19 countries)4. High income countries without economic development (Hong Kong,Israel, Kuwait, Singapore, and UAE)5. Money facilitates market activities and is necessary in complex market systems:a. barter economy - is where commodities are directly traded without the useof money.1. Direct trade requires a coincidence of wants.2. Prices become complicated by not having a method to easily measureworth.14
b. functions of money:1. medium of exchange2. store of value3. measure of worthc. Fiat money1. European Gold & Silver smith receipts 15th century2. Genghis Kahn in the 12th century in Asia B paper money6. Foreign exchange B value of one currency versus anothera. Hard currency B U.S. dollar, British Pound, Canadian dollar, JapaneseYen, and the Euro B general acceptability of the currency and it beingdemanded as reserves by central banks1. G-7 nations, hard currency nations; Euro predecessors France,Germany, Italyb. Exchange rates affect both imports and exports; and foreign investmenthere, U.S. investment abroad.1. Dollar gains strength, Imports cheaper here, exports more expensiveabroad2. Dollar gains strength, foreign investment in U.S. more attractive15
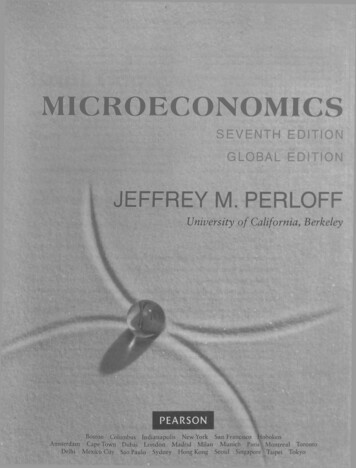
because dollar buys more foreigners home currency when investmentrepatriatedc. Strong dollar policy in exchange B based on interest rates, growth, andrelative strength of economy and stability of political system etc.1. Debt and supply of currency an important factor in economicdevelopment7. The Circular Flow Diagram is used to show the interdependence that existsamong sectors of the economy:a. sectors [private-domestic]1. households2. resource markets3. businesses4. product marketsb. complications1. government2. foreign sectorc. Model of interdependence:16
FOREIGN SECTORProduct markets are where the domestic parties obtain and sell commodities[inside the pyramid], and the factor markets [shown with the dotted lines] arewhere the domestic parties obtain and supply productive resources. The basereads AFOREIGN SECTOR@, which indicates that the same buying and selling ofcommodities and resources is not limited to just domestic parties, but can includeforeign businesses and resources as well. The circular flow diagram shows thateach of the sectors relies on the others for resources and supplies the otherscommodities and resources.17
4. Basics of Supply and DemandLecture Notes1. A market is nothing more or less than the locus of exchange; it is not necessarilya place, but simply buyers and sellers coming together for transactions.2. The law of demand states that as price increases (decreases) consumers willpurchase less (more) of the specific commodity.a. The demand schedule (demand curve) reflects the law of demand it is adownward sloping function and is a schedule of the quantity demanded ateach and every price.As price falls from P1 to P2 the quantity demanded increases from Q1 to Q2. This is anegative relation between price and quantity, hence the negative slope of the demandschedule; as predicted by the law of demand.1. utility (use, pleasure, jollies) from the consumption of commodities.18
2. The change in utility derived from the consumption of one more unit ofa commodity is called marginal utility.3. Diminishing marginal utility is the fact that at some point furtherconsumption of a commodity adds smaller and smaller increments tothe total utility received from the consumption of that commodity.b. The income effect is the fact that as a person's income increases (or theprice of item goes down [which effectively increases command overgoods] more of everything will be demanded.c. The substitution effect is the fact that as the price of a commodityincreases, consumers will buy less of it and more of other commodities.3. Demand Curvea. Price and quantity - again the demand curve shows the negative relationbetween price and quantity.b. Individual versus market demand - a market demand curve is simply anaggregation of all individual demand curves for a particular commodity.c. Nonprice determinants of demand; and a shift to the left (right) of thedemand curve is called a decrease (increase) in demand. The nonpricedeterminants of demand are:1. tastes and preferences of consumers,2. the number of consumers,3. the money incomes of consumers,4. the prices of related goods, and5. consumers' expectations concerning future availability or prices ofthe commodity.19
d. Changes in demand versus in quantity demandedAn increase in demand is shown in the first panel, notice that at each price there is agreater quantity demanded along D2 (the dotted line) than was demanded with D1 (thesolid line). The second panel shows a decrease in demand, notice that there is a lowerquantity demanded at each price along D2 (the dotted line) than was demanded with D1(the solid line).20
Move
microeconomics. The breath of topical coverage limits the course objectives to subject matter mastery. The course will present factual material concerning the operation of the firm and household as well as the development of rudimentary understanding of economic decision-making. REQUIRED TEXT David A. Dilt