Transcription
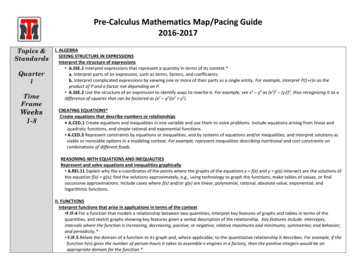
Pre-Calculus Mathematics Map/Pacing Guide2016-2017Topics &StandardsQuarter1TimeFrameWeeks1-8I. ALGEBRASEEING STRUCTURE IN EXPRESSIONSInterpret the structure of expressions A.SSE.1 Interpret expressions that represent a quantity in terms of its context.*a. Interpret parts of an expression, such as terms, factors, and coefficients.b. Interpret complicated expressions by viewing one or more of their parts as a single entity. For example, interpret P(1 r)n as theproduct of P and a factor not depending on P. A.SSE.2 Use the structure of an expression to identify ways to rewrite it. For example, see x4 – y4 as (x2)2 – (y2)2, thus recognizing it as adifference of squares that can be factored as (x2 – y2)(x2 y2).CREATING EQUATIONS*Create equations that describe numbers or relationships A.CED.1 Create equations and inequalities in one variable and use them to solve problems. Include equations arising from linear andquadratic functions, and simple rational and exponential functions. A.CED.3 Represent constraints by equations or inequalities, and by systems of equations and/or inequalities, and interpret solutions asviable or nonviable options in a modeling context. For example, represent inequalities describing nutritional and cost constraints oncombinations of different foods.REASONING WITH EQUATIONS AND INEQUALITIESRepresent and solve equations and inequalities graphically A.REI.11 Explain why the x-coordinates of the points where the graphs of the equations y f(x) and y g(x) intersect are the solutions ofthe equation f(x) g(x); find the solutions approximately, e.g., using technology to graph the functions, make tables of values, or findsuccessive approximations. Include cases where f(x) and/or g(x) are linear, polynomial, rational, absolute value, exponential, andlogarithmic functions.II. FUNCTIONSInterpret functions that arise in applications in terms of the context F.IF.4 For a function that models a relationship between two quantities, interpret key features of graphs and tables in terms of thequantities, and sketch graphs showing key features given a verbal description of the relationship. Key features include: intercepts;intervals where the function is increasing, decreasing, positive, or negative; relative maximums and minimums; symmetries; end behavior;and periodicity.* F.IF.5 Relate the domain of a function to its graph and, where applicable, to the quantitative relationship it describes. For example, if thefunction h(n) gives the number of person-hours it takes to assemble n engines in a factory, then the positive integers would be anappropriate domain for the function.*
Pre-Calculus Mathematics Map/Pacing Guide2016-2017 F.IF.6 Calculate and interpret the average rate of change of a function (presented symbolically or as a table) over a specified interval.Estimate the rate of change from a graph.*Analyze functions using different representations F.IF.7 Graph functions expressed symbolically and show key features of the graph, by hand in simple cases and using technology for morecomplicated cases.*a. Graph linear and quadratic functions and show intercepts, maxima, and minima.b. Graph square root, cube root, and piecewise-defined functions, including step functions and absolute value functions.c. Graph polynomial functions, identifying zeros when suitable factorizations are available, and showing end behavior.d. ( ) Graph rational functions, identifying zeros and asymptotes when suitable factorizations are available, and showing endbehavior.e. Graph exponential and logarithmic functions, showing intercepts and end behavior, and trigonometric functions, showing period,midline, and amplitude.BUILDING FUNCTIONSBuild new functions from existing functions F.BF.3 Identify the effect on the graph of replacing f(x) by f(x) k, k f(x), f(kx), and f(x k) for specific values of k (both positive andnegative); find the value of k given the graphs. Experiment with cases and illustrate an explanation of the effects on the graph usingtechnology. Include recognizing even and odd functions from their graphs and algebraic expressions for them.For guidance with I can statements, clarifications, Enduring Understandings, and Essential Questions, see your resource titled, TheCommon Core, Clarifying Expectations for Teachers & Students, 2011 Edition.Be sure to use the “Why” information at the beginning of each Divide polynomials using long division and synthetic divisionchapter for support with the Big Ideas. Use the Remainder and Factor Theorems. Find all zeros of polynomial functions.Key Concepts and Skills Solve radical and rational equations. Identify functions and determine their domains, ranges, y Graph and analyze power, radical, polynomial, and rationalintercepts, and zeros.functions. Evaluate the continuity, end behavior, limits, and extrema of Divide polynomials using long division and synthetic division.a function. Use the Remainder and Factor Theorems. Calculate rates of change of nonlinear functions. Find all zeros of polynomial functions. Identify parent functions and transformations. Solve radical and rational equations. Perform operations with functions, identify composite Solve polynomial and rational inequalities.functions, and calculate inverse functions. Graph and analyze power, radical, polynomial, and rationalfunctions.
Pre-Calculus Mathematics Map/Pacing Guide2016-2017Curriculum Units &Assessment(Evidence)UBD FrameworkUnits: Formative & SummativeAssessments 4-7 tasks that reach DOK 3-4AND/OR 3-5 FATPs / RAFTs At least (1) GRASPS perquarter & At least 1 common shortcycle per quarter*Assessments are located withinunitMGraw-Hill GlencoeAssessment Resources(Formative, Pre/Post, andSummative): Chapter Readiness Checks,Chapter Tests, Quizzes, &Mid-chapter tests “Free Response Questions”provided to preparestudents for AP Exams Aleks SoftwareOpportunities forIntegrationResources(Curriculum &Textbook)Key Concept tools &practices forDifferentiationGlencoe Pre-Calculus Chapter 1: Functions from aCalculus Perspective Chapter 2: Power, Polynomial,and Rational Functions Chapter 3: Exponential andLogarithmic FunctionsAvailable on ConnectED: Dinah Zike’s Foldables Virtual Manipulatives “abc Vocab” Activities TI Easy Files H.O.T. Questions embedded ineach textbook lesson *Multi-lingual Glossary &Audio in the ebook*Be sure to use the followinginstructional resources availablefor each chapter; found in the“Resources” tab: Intro. Video & Animations Interactive Guides Anticipation Guides & StudentBuilt Vocabulary eSolutions “Before you Read” & “KeyPoints” notes guide Chapter Projects Interactive WhiteboardPresentations *Connection to AP CalculusLesson (provided in the Planand Present Tab)Other Resources Illustrative Mathematics ndards/HSA ODE Math Model CurriculumOther tools and practices: Algebra Tiles Graphing Calculators Graphing Software Graphs and equations of realworld applications that applyquadratic and exponentialfunctions Computer software thatgenerate graphs of functions Examples of real-worldsituations that lendthemselves to writingequations that model thecontexts Computer Algebra Systems Area models Journals Concept/Anchor Charts Non-linguistic representations Discourse and questioning
Pre-Calculus Mathematics Map/Pacing Guide2016-2017Topics &StandardsQuarter2TimeFrameWeeks 1-8I. THE COMPLEX NUMBER SYSTEMPerform arithmetic operations with complex numbers. N.CN.1 Know there is a complex number i such that i2 –1, and every complex number has the form a bi with a and b real. N.CN.2 Use the relation i 2 –1 and the commutative, associative, and distributive properties to add, subtract, and multiply complexnumbers.Use complex numbers in polynomial identities and equations. N.CN.7 Solve quadratic equations with real coefficients that have complex solutions. N.CN.9 ( ) Know the Fundamental Theorem of Algebra; show that it is true for quadratic polynomials.II. ALGEBRASEEING STRUCTURE IN EXPRESSIONSInterpret the structure of expressions A.SSE.1 Interpret expressions that represent a quantity in terms of its context.*a. Interpret parts of an expression, such as terms, factors, and coefficients.b. Interpret complicated expressions by viewing one or more of their parts as a single entity. For example, interpret P(1 r)n as theproduct of P and a factor not depending on P. A.SSE.2 Use the structure of an expression to identify ways to rewrite it. For example, see x4 – y4 as (x2)2 – (y2)2, thus recognizing it as adifference of squares that can be factored as (x2 – y2)(x2 y2).CREATING EQUATIONS*Create equations that describe numbers or relationships A.CED.1 Create equations and inequalities in one variable and use them to solve problems. Include equations arising from linear andquadratic functions, and simple rational and exponential functions. A.CED.2 Create equations in two or more variables to represent relationships between quantities; graph equations on coordinate axeswith labels and scales. A.CED.3 Represent constraints by equations or inequalities, and by systems of equations and/or inequalities, and interpret solutions asviable or nonviable options in a modeling context. For example, represent inequalities describing nutritional and cost constraints oncombinations of different foods.ARITHMETIC WITH POLYNOMIALS AND RATIONALEXPRESSIONSPerform arithmetic operations on polynomials A.APR.1 Understand that polynomials form a system analogous to the integers, namely, they are closed under the operations ofaddition, subtraction, and multiplication; add, subtract, and multiply polynomials.Understand the relationship between zeros and factors of polynomials A.APR.2 Know and apply the Remainder Theorem: For a polynomial p(x) and a number a, the remainder on division by x – a is p(a),so p(a) 0 if and only if (x – a) is a factor of p(x).
Pre-Calculus Mathematics Map/Pacing Guide2016-2017Use polynomial identities to solve problems A.APR.4 Prove polynomial identities and use them to describe numerical relationships. For example, the polynomial identity (x2 y2)2 (x2 – y2)2 (2xy)2 can be used to generate Pythagorean triples.Rewrite rational expressions A.APR.6 Rewrite simple rational expressions in different forms; write a(x)/b(x) in the form q(x) r(x)/b(x), where a(x), b(x), q(x), andr(x) are polynomials with the degree of r(x) less than the degree of b(x), using inspection, long division, or, for the more complicatedexamples, a computer algebra system. A.APR.7 ( ) Understand that rational expressions form a system analogous to the rational numbers, closed under addition,subtraction, multiplication, and division by a nonzero rational expression; add, subtract, multiply, and divide rational expressions.REASONING WITH EQUATIONS AND INEQUALITIES A-REIRepresent and solve equations and inequalities graphically A.REI.11 Explain why the x-coordinates of the points where the graphs of the equations y f(x) and y g(x) intersect are the solutions ofthe equation f(x) g(x); find the solutions approximately, e.g., using technology to graph the functions, make tables of values, or findsuccessive approximations. Include cases where f(x) and/or g(x) are linear, polynomial, rational, absolute value, exponential, andlogarithmic functions. A.REI.12 Graph the solutions to a linear inequality in two variables as a half- plane (excluding the boundary in the case of a strictinequality), and graph the solution set to a system of linear inequalities in two variables as the intersection of the corresponding halfplanes.III. FUNCTIONSINTERPRETING FUNCTIONSUnderstand the concept of a function and use function notation F.IF.1 Understand that a function from one set (called the domain) to another set (called the range) assigns to each element of thedomain exactly one element of the range. If f is a function and x is an element of its domain, then f(x) denotes the output of fcorresponding to the input x. The graph of f is the graph of the equation y f(x). F.IF.2 Use function notation, evaluate functions for inputs in their domains, and interpret statements that use function notation in termsof a context.Interpret functions that arise in applications in terms of the context F.IF.4 For a function that models a relationship between two quantities, interpret key features of graphs and tables in terms of thequantities, and sketch graphs showing key features given a verbal description of the relationship. Key features include: intercepts;intervals where the function is increasing, decreasing, positive, or negative; relative maximums and minimums; symmetries; end behavior;and periodicity.* F.IF.5 Relate the domain of a function to its graph and, where applicable, to the quantitative relationship it describes. For example, if thefunction h(n) gives the number of person-hours it takes to assemble n engines in a factory, then the positive integers would be anappropriate domain for the function.*
Pre-Calculus Mathematics Map/Pacing Guide2016-2017 F.IF.6 Calculate and interpret the average rate of change of a function (presented symbolically or as a table) over a specified interval.Estimate the rate of change from a graph.*Analyze functions using different representations F.IF.7 Graph functions expressed symbolically and show key features of the graph, by hand in simple cases and using technology for morecomplicated cases.*a. Graph linear and quadratic functions and show intercepts, maxima, and minima.b. Graph square root, cube root, and piecewise-defined functions, including step functions and absolute value functions.c. Graph polynomial functions, identifying zeros when suitable factorizations are available, and showing end behavior.d. ( ) Graph rational functions, identifying zeros and asymptotes when suitable factorizations are available, and showing endbehavior.e. Graph exponential and logarithmic functions, showing intercepts and end behavior, and trigonometric functions, showing period,midline, and amplitude.BUILDING FUNCTIONSBuild new functions from existing functions F.BF.3 Identify the effect on the graph of replacing f(x) by f(x) k, k f(x), f(kx), and f(x k) for specific values of k (both positive andnegative); find the value of k given the graphs. Experiment with cases and illustrate an explanation of the effects on the graph usingtechnology. Include recognizing even and odd functions from their graphs and algebraic expressions for them. F.BF.4 Find inverse functions.a. Solve an equation of the form f(x) c for a simple function f that has an inverse and write an expression for the inverse. Forexample, f(x) 2 x3 or f(x) (x 1)/(x–1) for x 1.b. ( ) Verify by composition that one function is the inverse of another.c. ( ) Read values of an inverse function from a graph or a table, given that the function has an inverse.d. ( ) Produce an invertible function from a non-invertible function by restricting the domain.For guidance with I can statements, clarifications, Enduring Understandings, and Essential Questions, see your provided resource titled, TheCommon Core, Clarifying Expectations for Teachers & Students, 2011 Edition.Be sure to use the “Why” information at the beginning of each Use sum and difference identities to evaluate trigonometricchapter for support with the Big Ideas.functions. Use double-angle, power-reducing, half-angle, and product-to-sumKey Concepts and Skills:identities to evaluate trigonometric expressions and solve Solve right triangles using trigonometric and inversetrigonometric equations.trigonometric functions. Convert between degrees and radians. Solve systems of linear equations using matrices and Gaussian orGauss-Jordan elimination. Solve real-world problems using trigonometric functions. Multiply matrices. Graph trigonometric functions and their inverses. Find determinants and inverses of 2 2 and 3 3 matrices.
Pre-Calculus Mathematics Map/Pacing Guide2016-2017 Solve oblique triangles and find their area using various lawsand formulas.Identify and use trigonometric identities to find trigonometricvalues.Use trigonometric identities to simplify and rewritetrigonometric expressions.Verify trigonometric identities.Solve trigonometric equations.Curriculum Unis &Assessment(Evidence)UBD FrameworkUnits:Formative & SummativeAssessments 4-7 tasks that reach DOK 3-4AND/OR 3-5 FATPs / RAFTs At least (1) GRASPS perquarter & At least 1 common shortcycle per quarter*Assessments are located withinunitMGraw-Hill GlencoeAssessment Resources(Formative, Pre/Post, andSummative): Chapter Readiness Checks,Chapter Tests, Quizzes, &Mid-chapter testsOpportunities forIntegration Solve systems of linear equations using inverse matrices andCramer's Rule.Write partial fraction decompositions of rational expressions withlinear and irreducible quadratic factors.Use linear programming to solve applications.Recognize situations in which there are no solutions or more thanone solution of a linear programming application.Resources(Curriculum &supplemental)Glencoe PreCalculus Chapter 4: TrigonometricFunctions Chapter 5: TrigonometricIdentities and Equations Chapter 6: Systems ofEquations and Matrices*Be sure to use the followinginstructional resources availablefor each chapter; found in the“Resources” tab: Intro. Video & Animations Interactive Student Guide Anticipation Guides & StudentBuilt Vocabulary eSolutions “Before you Read” & “KeyPoints” notes guide Chapter ProjectsKey Concept tools &Practices forDifferentiationAvailable on ConnectED: Dinah Zike’s Foldables Virtual Manipulatives “abc Vocab” Activities TI Easy Files H.O.T. Questions embedded ineach textbook lesson *Multi-lingual Glossary &Audio in the ebookOther tools and practices: Algebra Tiles Graphing Calculators Graphing Software Graphs and equations of realworld applications that applyquadratic and exponentialfunctions Computer software thatgenerate graphs of functions
Pre-Calculus Mathematics Map/Pacing Guide2016-2017 “Free Response Questions”provided to preparestudents for AP ExamsAleks Software Interactive WhiteboardPresentations*Connection to AP CalculusLesson (provided in the Planand Present Tab)Other Resources Illustrative Mathematics ndards/HSA ODE Math Model CurriculumTopic &StandardQuarter 3TimeFrameWeeks 1-8 Examples of real-worldsituations that lendthemselves to writingequations that model thecontextsComputer Algebra SystemsArea modelsJournalsConcept/Anchor ChartsNon-linguistic representationsDiscourse and questioningI. ALGEBRASEEING STRUCTURE IN EXPRESSIONSInterpret the structure of expressions A.SSE.1 Interpret expressions that represent a quantity in terms of its context.*a. Interpret parts of an expression, such as terms, factors, and coefficients.b. Interpret complicated expressions by viewing one or more of their parts as a single entity. For example, interpret P(1 r)n as theproduct of P and a factor not depending on P. A.SSE.2 Use the structure of an expression to identify ways to rewrite it. For example, see x4 – y4 as (x2)2 – (y2)2, thus recognizing it as adifference of squares that can be factored as (x2 – y2)(x2 y2).Write expressions in equivalent forms to solve problems A.SSE.4 Derive the formula for the sum of a finite geometric series (when the common ratio is not 1), and use the formula to solveproblems. For example, calculate mortgage payments.*REASONING WITH EQUATIONS AND INEQUALITIESUnderstand solving equations as a process of reasoning and explain the reasoning A.REI.2 Solve simple rational and radical equations in one variable, and give examples showing how extraneous solutions may arise.Represent and solve equations and inequalities graphically A.REI.11 Explain why the x-coordinates of the points where the graphs of the equations y f(x) and y g(x) intersect are the solutions ofthe equation f(x) g(x); find the solutions approximately, e.g., using technology to graph the functions, make tables of values, or findsuccessive approximations. Include cases where f(x) and/or g(x) are linear, polynomial, rational, absolute value, exponential, andlogarithmic functions.
Pre-Calculus Mathematics Map/Pacing Guide2016-2017CREATING EQUATIONS*Create equations that describe numbers or relationships A.CED.1 Create equations and inequalities in one variable and use them to solve problems. Include equations arising from linear andquadratic functions, and simple rational and exponential functions. A.CED.2 Create equations in two or more variables to represent relationships between quantities; graph equations on coordinate axeswith labels and scales. A.CED.4 Rearrange formulas to highlight a quantity of interest, using the same reasoning as in solving equations. For example, rearrangeOhm’s law V IR to highlight resistance R.ARITHMETIC WITH POLYNOMIALS AND RATIONALEXPRESSIONSUse polynomial identities to solve problems A.APR.5 ( ) Know and apply the Binomial Theorem for the expansion of (x y)n in powers of x and y for a positive integer n, where xand y are any numbers, with coefficients determined for example by Pascal’s Triangle.1Rewrite rational expressions A.APR.7 ( ) Understand that rational expressions form a system analogous to the rational numbers, closed under addition,subtraction, multiplication, and division by a nonzero rational expression; add, subtract, multiply, and divide rational expressions.II. FUNCTIONSInterpret functions that arise in applications in terms of the context F.IF.4 For a function that models a relationship between two quantities, interpret key features of graphs and tables in terms of thequantities, and sketch graphs showing key features given a verbal description of the relationship. Key features include: intercepts;intervals where the function is increasing, decreasing, positive, or negative; relative maximums and minimums; symmetries; end behavior;and periodicity.*Analyze functions using different representations F.IF.7 Graph functions expressed symbolically and show key features of the graph, by hand in simple cases and using technology for morecomplicated cases.*a. Graph linear and quadratic functions and show intercepts, maxima, and minima.b. Graph square root, cube root, and piecewise-defined functions, including step functions and absolute value functions.c. Graph polynomial functions, identifying zeros when suitable factorizations are available, and showing end behavior.d. ( ) Graph rational functions, identifying zeros and asymptotes when suitable factorizations are available, and showing endbehavior.e. Graph exponential and logarithmic functions, showing intercepts and end behavior, and trigonometric functions, showing period,midline, and amplitude. F.IF.8 Write a function defined by an expression in different but equivalent forms to reveal and explain different properties of thefunction.
Pre-Calculus Mathematics Map/Pacing Guide2016-2017a. Use the process of factoring and completing the square in a quadratic function to show zeros, extreme values, and symmetry ofthe graph, and interpret these in terms of a context.b. Use the properties of exponents to interpret expressions for exponential functions. For example, identify percent rate of change infunctions such as y (1.02)t, y (0.97)t, y (1.01)12t, y (1.2)t/10, and classify them as representing exponential growth ordecay. F.IF.9 Compare properties of two functions each represented in a different way (algebraically, graphically, numerically in tables, or byverbal descriptions). For example, given a graph of one quadratic function and an algebraic expression for another, say which has thelarger maximum.LINEAR, QUADRATIC, AND EXPONENTIAL MODELS*Construct and compare linear, quadratic, and exponential models and solve problems F.LE.4 For exponential models, express as a logarithm the solution to abct d where a, c, and d are numbers and the base b is 2, 10, ore; evaluate the logarithm using technology.BUILDING FUNCTIONSBuild a function that models a relationship between two quantities F.BF.1 Write a function that describes a relationship between two quantities.*a. Determine an explicit expression, a recursive process, or steps for calculation from a context.b. Combine standard function types using arithmetic operations. For example, build a function that models the temperature of acooling body by adding a constant function to a decaying exponential, and relate these functions to the model.c. ( ) Compose functions. For example, if T(y) is the temperature in the atmosphere as a function of height, and h(t) is the height of aweather balloon as a function of time, then T(h(t)) is the temperature at the location of the weather balloon as a function oftime.Build new functions from existing functions F.BF.3 Identify the effect on the graph of replacing f(x) by f(x) k, k f(x), f(kx), and f(x k) for specific values of k (both positive andnegative); find the value of k given the graphs. Experiment with cases and illustrate an explanation of the effects on the graph usingtechnology. Include recognizing even and odd functions from their graphs and algebraic expressions for them.For guidance with I can statements, clarifications, Enduring Understandings, and Essential Questions, see your provided resource titled,The Common Core, Clarifying Expectations for Teachers & Students, 2011 Edition.
Pre-Calculus Mathematics Map/Pacing Guide2016-2017Be sure to use the “Why” information at the beginning of eachchapter for support with the Big Ideas.Key Concepts and Skills: Analyze, write, and graph equations of parabolas, ellipses,circles, and hyperbolas. Use equations to identify types of conic sections. Use rotation of axes to write equations of rotated conicsections. Graph rotated conic sections. Graph parametric equations. Solve problems related to the motion of projectiles. Represent and operate with vectors both geometrically andalgebraically. Resolve vectors into their rectangular components. Write a vector as the linear combination of unit vectors. Find the dot product of two vectors and use the dot productto find the angle between them.Curriculum Units &Assessment(Evidence)UBD FrameworkUnits:Formative & SummativeAssessments 4-7 tasks that reach DOK 3-4AND/OR 3-5 FATPs / RAFTs At least (1) GRASPS perquarter & At least 1 common short cycleper quarterOpportunities forIntegration Find the projection of one vector onto another.Graph and operate with vectors in space.Find the dot and cross products of and angles between vectors inspace.Find areas of parallelograms and volumes of parallelepipeds in space.Graph points with polar coordinates.Graph polar equations.Identify and graph classic polar curves.Convert between polar and rectangular coordinates.Convert between polar and rectangular equations.Identify polar equations of conics.Write and graph the polar equation of a conic given its eccentricity andthe equation of its directrix.Convert complex numbers from rectangular to polar form and viceversa.Find products, quotients, powers, and roots of complex numbers inpolar form.Resources(Curriculum/Textbook)Glencoe Pre-Calculus Chapter 7: Conic Sectionsand Parametric Equations Chapter 8: Vectors Chapter 9: PolarCoordinates and ComplexNumbers*Be sure to use the followinginstructional resourcesavailable for each chapter;found in the “Resources” tab: Intro. Video & AnimationsConcept Tools &Practices forDifferentiationAvailable on ConnectED: Dinah Zike’s Foldables Virtual Manipulatives “abc Vocab” Activities TI Easy Files H.O.T. Questions embedded ineach textbook lesson *Multi-lingual Glossary & Audio inthe ebookOther tools and practices: Algebra Tiles Graphing Calculators
Pre-Calculus Mathematics Map/Pacing Guide2016-2017*Assessments are located withinunit MGraw-Hill Glencoe AssessmentResources (Formative, Pre/Post,and Summative): Chapter Readiness Checks,Chapter Tests, Quizzes, &Mid-chapter tests “Free Response Questions”provided to preparestudents for AP Exams Aleks Software Interactive Student GuidesAnticipation Guides &Student Built VocabularyeSolutions“Before you Read” & “KeyPoints” notes guideChapter ProjectsInteractive WhiteboardPresentations*Connection to AP CalculusLesson (provided in the Planand Present Tab)Other Resources Illustrative Mathematics ndards/HSA ODE Math ModelCurriculumTopic &StandardQuarter 4TimeFrameWeeks 1-8 Graphing SoftwareGraphs and equations of realworld applications that applyquadratic and exponentialfunctionsComputer software that generategraphs of functionsExamples of real-world situationsthat lend themselves to writingequations that model the contextsComputer Algebra SystemsArea modelsJournalsConcept/Anchor ChartsNon-linguistic representationsDiscourse and questioningI. STATISTICSMAKING INFERENCES AND JUSTIFYING CONCLUSIONSUnderstand and evaluate random processes underlying statistical experiments S.IC.1 Understand statistics as a process for making inferences about population parameters based on a random sample from thatpopulation.Make inferences and justify conclusions from sample surveys, experiments, and observational studies S.IC.3 Recognize the purposes of and differences among sample surveys, experiments, and observational studies; explain howrandomization relates to each. S.IC.6 Evaluate reports based on data.INTERPRETING CATEGORICAL AND QUANTITATIVE DATASummarize, represent, and interpret data on a single count or measurement variable S.ID.4 Use the mean and standard deviation of a data set to fit it to a normal distribution and to estimate population percentages. Recognizethat there are data sets for which such a procedure is not appropriate. Use calculators, spreadsheets, and tables to estimate areas underthe normal curve.
Pre-Calc
Pre-Calculus Mathematics Map/Pacing Guide 2016-2017 F.IF.6 Calculate and interpret the average rate of change of a function (presented symbolically or as a table) over a specified interval. Estimate th
