Transcription
nCSamplehaptean r 1d Rehy gpo reth ssies onis , cte orst rein lag tio11 - 19 PROGRESSIONonline digitalludes aincnitedNEW FOREdexcel A level MathematicsStatistics and MechanicsYear 2ion2017
Edexcel AS and A level MathematicsSample materialRegression, correlationand hypothesis testing1ObjectivesAfter completing this chapter you should be able to: Understand exponential models in bivariate data pages 2–5 Use a change of variable to estimate coefficients in anexponential model pages 2–5 Understand and calculate the product moment correlation pages 5–8coefficient Carry out a hypothesis test for zero correlation pages 8–12Prior knowledge check1Given that y 3 2xa show that log y A Bx, where A andB are constants to be found.b The straight-line graph of x againstlog y is plotted. Write down the gradientof the line and the intercept on the Pure Year 1, Chapter 12vertical axis.Ice-cream sellers typically find that they sellmore ice cream the hotter the day. You canmeasure the strength of this correlation usingthe product moment correlation coefficient. Mixed exercise, Q102The height, h cm, and handspan, s cm, of20 students are recorded. The regressionline of h on s is found to be h 22 11.3s.Give an interpretation of the value 11.3 in Year 1, Chapter 4this model.3A single observation of x 32 is takenfrom the random variable X B(40, p). Test,at the 1% significance level, H0 : p 0.6 Year 1, Chapter 7against H1 : p 0.6.1
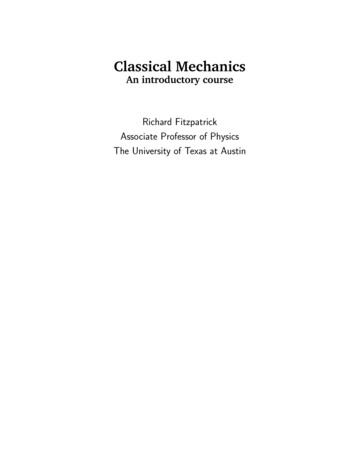
Chapter 1Regression, correlation and hypothesis testing1.1 Exponential modelsRegression lines can be used to model a linear relationship between two variables. Sometimes,experimental data does not fit a linear model, but still shows a clear pattern. You can use logarithmsand coding to examine trends in non-linear data.For data that can be modelled by a relationship of the form y axn, you need to code the data usingY log y and X log x to obtain a linear relationship. If y axn for constants a and n then log y log a n log x If y kbxTake logs of bothsides and rearrange toconvert the original forminto the linear form. Pure Year 1, Section 14.6for constants k and b then log y log k x log by4Use the laws of indices to write the expression inthe form g kbt.1AExercise3yOnlinexExplore the original andcoded data graphically using technology.2.51 Data are coded using Y log y and X log xto give a linear relationship. The equation ofthe regression line for the coded data is Y 1.2 0.4X.a State whether the relationship between y and x is of the form y ax n or y kb x.b Write down the relationship between y and x and find the values of the constants.21.50.51234567log yPlotting log xagainst log ygives a straightline.18 x1OThe gradient of the line is 1.8. This correspondsto the value of n in the non-linear relationship.The y-intercept is at (0, 1). This correspondsto log a hence a 10 1 0.1, as expected.2 Data are coded using Y log y and X x to give a linear relationship. The equation of theregression line for the coded data is Y 0.4 1.6X.a State whether the relationship between y and x is of the form y ax n or y kb x.b Write down the relationship between y and x and find the values of the constants.1 log x–1PExample1The table shows some data collected on the temperature, in C, of a colony of bacteria (t) and itsgrowth rate (g).Temperature, t ( C)Growth rate, g35689111.041.491.792.583.14.46The data are coded using the changes of variable x t and y log g. The regression line of y on xis found to be y 0.2215 0.0792x.a Mika says that the constant 0.2215 in the regression line means that the colony is shrinkingwhen the temperature is 0 C. Explain why Mika is wrong.b Given that the data can be modelled by an equation of the form g kbt where k and b areconstants, find the values of k and b.2Remember log means log to the base 10.So 10log g g.The points on this scatter graph satisfy the relationshipy 0.1x1.8. This is in the form y axn.3.5OUse the change of variable to find an expressionfor log g in terms of t. You could also comparethe equation of the regression line withlog g log k t log b. Pure Year 1, Section 14.6b Substitute x t and y log g:log g 0.2215 0.0792tg 10 0.2215 0.0792tg 10 0.2215 (100.0792)tg 0.600 1.20t (both values givento 3 s.f.)LinkFor data that can be modelled by an exponential relationshipof the form y abx, you need to code the data using Y log yand X x to obtain a linear relationship.Remember that the original data have beencoded. Use the coding in reverse to find thecorresponding value of g. You could also observethat a prediction based on t 0 would be outsidethe range of the data so would be an example of Year 1, Section 4.2extrapolation.a When t 0, x 0, so according to themodel,y 0.2215log g 0.2215g 10 0.2215 0.600 (3 s.f.).This growth rate is positive: the colony isnot shrinking.3 The scatter diagram shows the relationship betweentwo sets of coded data, X and Y, where X log xand Y log y. The regression line of Y on X is shown,and passes through the points (0, 172) and (23, 109).Y(0, 172)The relationship between the original data sets ismodelled by an equation of the form y ax n.Find, correct to 3 decimal places, the values of aand n.(23, 109)OPX4 The size of a population of moles is recorded and the data are shown in the table. T is the time, inmonths, elapsed since the beginning of the study and P is the number of moles in the population.T235789P72861251792142573
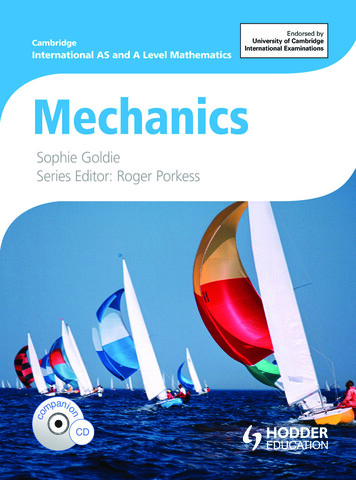
Chapter 1Regression, correlation and hypothesis testinga Plot a scatter diagram showing log P against T.b Give an interpretation of the constant b in this equation.b Comment on the correlation between log P and T.c Explain why this model is not reliable for estimating the growth rate of the populationwhen the temperature is 35 C.(1 mark)c State whether your answer to b supports the fact that the original data can be modelled by arelationship of the form P abT.Challenged Calculate the values of a and b for this model.The table shows some data collected on the efficiency rating, E, of a newtype of super-cooled engine when operating at a certain temperature, T.e Give an interpretation of the value of b you calculated in part d.HintThink about what happens when the value of T increases by 1. Wheninterpreting coefficients, refer in your answer to the context given in the question.5 The time, t m s, needed for a computer algorithm todetermine whether a number, n, is prime is recordedfor different values of n. A scatter graph of t againstn is drawn.1.21.523468Efficiency, E95.531.40.80.40.2a By plotting an appropriate scatter diagram, verify that this relationshipis valid for the data given.b By drawing a suitable line on your scatter diagram and finding itsequation, estimate the values of a and b.c Give a reason why the model will not predict the efficiency of theengine when the temperature is 0 C.The data are coded using the changes of variabley log t and x log n. The regression line ofy on x is found to be y 0.301 0.6x.b Find an equation for t in terms of n, givingyour answer in the form t an k, where a andk are constants to be found.On6 Data are collected on the number of units (c) of a catalyst added to a chemical process, and therate of reaction (r).1.2 Measuring correlationYou can calculate quantitative measures for the strength and type of linear correlation between twovariables. One of these measures is known as the product moment correlation coefficient.The data are coded using x log c and y log r. It is found that a linear relationship existsbetween x and y and that the equation of the regression line of y on x is y 1.31x 0.41. The product moment correlation coefficient describes the linear correlation between twovariables. It can take values between 1 and 1.Notation The product moment correlationIf r 1, there is perfect positive linear correlation.Use this equation to determine an expression for r in terms of c.If r 1, there is perfect negative linear correlation.7 The heights, h cm, and masses, m kg, of a sample of Galapagos penguins are recorded. The dataare coded using y log m and x log h and it is found that a linear relationship exists betweenx and y. The equation of the regression line of y on x is y 0.0023 1.8x.Find an equation to describe the relationship between m and h, giving your answer in the formm ahn, where a and n are constants to be found.8 The table shows some data collected on the temperature, t C, of a colony of insect larvae andthe growth rate, g, of the population.Temp, t ( C)Growth rate, g1317212526285.378.4413.2920.9123.4229.38The data are coded using the changes of variable x t and y log g. The regression line of y on xis found to be y 0.09 0.05x.a Given that the data can be modelled by an equation of the form g abt where a and b areconstants, find the values of a and b.(3 marks)4Temp, T ( C)It is thought that the relationship between E and t is of the form E aT b.t (m s)a Explain why a model of the form t a bn isunlikely to fit these data.E/P(1 mark)coefficient, or PMCC, for a sample of data isdenoted by the letter r.The closer r is to 1 or 1, the stronger the negativeor positive correlation, respectively.HintIf r 0 (or is close to 0) there is no linear correlation.In this case there might still be a non-linearrelationship between the variables.yOyxr –1Oline.yxr –0.8OFor r 1, the points all lie on a straightyxr 0Oyxr 0.3Oxr 1You need to know how to calculate the product moment correlation coefficient for bivariate datausing your calculator.5
Chapter 1Regression, correlation and hypothesis testingExample3 In a training scheme for young people, the average time taken for each age group to reach acertain level of proficiency was measured. The table below shows the data.2From the large data set, the daily mean windspeed, w knots, and the daily maximum gust, g knots,were recorded for the first 10 days in September in Hurn in 1987.Day of a16171819202122232425Average time, y (hours)12111091189768a Use your calculator to find the value of the product moment correlation coefficient for thesedata.23b Use your answer to part a to describe the correlation between the age and average time takenbased on this sample. Crown Copyright Met Officea State the meaning of n/a in the table above.E/Pb Calculate the product moment correlation coefficient for the remaining 8 days.c With reference to your answer to part b, comment on the suitability of a linear regression modelfor these data.4 The number of atoms of a radioactive substance, n, is measured at various times, t minutes afterthe start of an experiment. The table below shows the data.Time, tAtoms, na Data on daily maximum gust is not availablefor these days.12457231411772log nThe data is coded using x t and y log n.OnlineUse your calculator tocalculate the PMCC.b r 0.9533c r is close to 1 so there is a strong positivecorrelation between daily mean windspeedand daily maximum gust. This means thatthe data points lie close to a straight line,so a linear regression model is suitable.a Copy and complete the table showing the values of log n.r measures linear correlation. The closer r is to 1or 1, the more closely a linear regression modelwill fit the data.The equation of the regression line of y on x is found to be y 2.487 0.320x.d Find an expression for n in terms of t, giving your answer in the form n ab t,where a and b are constants to be found.by(1 mark)c With reference to your answer to b, state whether an exponential model is a good fitfor these data.(2 marks)(3 marks)Hint1 Suggest a value of r for each of these scatter diagrams:a(2 marks)b Calculate the product moment correlation coefficient for the coded data.1BExerciseAge, x (years)cyFor part b enter correspondingvalues of t and log n into your calculator.yE/P5 The width, w cm, and the mass, m grams, of snowballs are measured. The table below shows thedata.Width, w346811Mass, m234080147265log wxOOxO2 The following table shows 10 observations from a bivariate data 012060a State what is measured by the product moment correlation coefficient.b Use your calculator to find the value of the product moment correlation coefficient betweenv and m.6xlog mThe data are coded using x log w and y log m.a Copy and complete the table showing the values of log w and log m.b Calculate the product moment correlation coefficient for the coded data.(3 marks)(1 mark)c With reference to your answer to b, state whether a model in the form y kxn wherek and n are constants is a good fit for these data.(2 marks)d Determine the values of k and n.(3 marks)7
Chapter 1ERegression, correlation and hypothesis testing6 From the large data set, the daily mean air temperature, t C, and the rainfall, f mm, wererecorded for Perth on seven consecutive days in August 2015.Temp, t18.016.415.315.013.710.212.0Rainfall, f3.013.04.632.028.063.022.0For a two-tailed test use: Crown Copyright Met Officea Calculate the product moment correlation coefficient for these data.(1 mark)b With reference to your answer to part a, comment on the suitability of a linear regressionmodel for these data.(2 marks)E/P7 From the large data set, the daily total rainfall, x mm, and the daily total sunshine, y hours, wererecorded for Camborne on seven consecutive days in May 2015.Rainfall, x2.2tr1.44.4tr0.20.6Sunshine, y5.27.75.60.35.10.18.9If you want to test whether the population PMCC, ρ, is not equal to zero you need to use a two-tailedtest: Crown Copyright Met Officea State the meaning of ‘tr’ in the table above.(1 mark)b Calculate the product moment correlation coefficient for these 7 days, stating clearly how youdeal with the entries marked ‘tr’.(2 marks) H0 : ρ 0, H1 : ρ 0You can determine the critical region for r for your hypothesis test by using the table of critical valueson page 192. This table will be given in the Mathematical Formulae and Statistical Tables booklet inyour exam. The critical region depends on the significance level of the test and the sample ct moment 83430.58220.66640.74980.7977c With reference to your answer to part b, comment on the suitability of a linear regressionmodel for these data.(2 marks)Samplesize456789For a sample size of 8 you see fromthe table that the critical value ofr to be significant at the 5% levelon a one-tailed test is 0.6215. Anobserved value of r greater than0.6215 from a sample of size 8would provide sufficient evidenceto reject the null hypothesis andconclude that ρ 0. Similarly,an observed value of r less than 0.6215 would provide sufficientevidence to conclude that ρ 0.ChallengeExampleData are recorded for two variables, x and y.x3.15.67.18.69.410.7y3.24.85.76.56.97.6By calculating the product moment correlation coefficients for suitablycoded values of x and y state, with reasons, whether these data aremore closely modelled by a relationship of the form y ab x or arelationship of the form y kxn , where a, b, k and n are constants.3A scientist takes 30 observations of the masses of two reactants in an experiment. She calculates aproduct moment correlation coefficient of r 0.45.The scientist believes there is no correlation between the masses of the two reactants. Test, at the10% level of significance, the scientist’s claim, stating your hypotheses clearly.H0 : ρ 0, H1 : ρ 0Sample size 301.3 Hypothesis testing for zero correlationYou can use a hypothesis test to determine whether the product moment correlation coefficient, r,for a particular sample indicates that there is likely to be a linear relationship within the wholepopulation.Notation r denotes the PMCC for a sample. ρ denotes the PMCC fora whole population. It is the Greek letter rho.If you want to test for whether or not the population PMCC, ρ, is either greater than zero or less thanzero you can use a one-tailed test:For a one-tailed test use either: H0 : ρ 0, H1 : ρ 0 or H0 : ρ 0, H1 : ρ 08Significance level in each tail 0.05From the table, critical values of r for a 5%significance level with a sample size of 30are r 0.3061, so the critical region isr 0.3061 and r 0.3061. 0.45 0.3061. The observed value of rlies within the critical region, so reject H0.There is evidence, at the 10% level ofsignificance, that there is a correlationbetween the masses of the two reactants.You need to test for either positive or negativecorrelation, so use a two-tailed test.Halve the significance level to find the probability Year 1, Section 7.4in each tail.Use the table of critical values on page 192 tofind the critical region for a two-tailed test with atotal significance level of 10%.You reject H0 if the observed value lies inside the Year 1, Section 7.2critical region.Write a conclusion in the context of the originalquestion.9
Chapter 1Regression, correlation and hypothesis 6a Find the product moment correlation coefficient for these data.You are testing for evidence of positivecorrelation, so use a one-tailed test.1 A population of students each took two different tests. A sample of 40 students was taken fromthe population and their scores on the two tests were recorded. A product moment correlationcoefficient of 0.3275 was calculated. Test whether or not this shows evidence of correlationbetween the test scores:Hint ‘Evidence of correlation’ could mean eithera at the 5% levelpositive or negative correlation, so you need to2 A computer-controlled milling machine is calibrated between 1 and 7 times a week. A supervisorrecorded the number of weekly calibrations, x, and the number of manufacturing errors, y, ineach of 7 weeks.x2317654y53556219354041a Calculate the product moment correlation coefficient for these data.b For these data, test H0 : ρ 0 against H1 : ρ 0, using a 1% significance level.11204617121015169132098171481718(3 marks)(1 mark)4 The following table shows the marks attained by 8 students in English and Mathematics atics1611201715263220a Calculate the product moment correlation coefficient.(1 mark)b Test, at the 5% significance level, whether these results show evidence of a linear relationshipbetween English and Mathematics marks. State your hypotheses clearly.(3 marks)5 A small company decided to import fine Chinese porcelain. They believed that in the long term thiswould prove to be an increasingly profitable arrangement with profits increasing proportionally tosales. Over the next 6 years their sales and profits were as shown in the table below.Year199419951996199719981999Sale in thousands165165170178178175Profits in 1000657275768083Using a 1% significance level, test to see if there is any evidence that the company’s beliefs werecorrect, and that profit and sales were positively correlated.E6 A scientific researcher collects data on the amount of solvent in a solution and the rate ofreaction. She calculates the product moment correlation coefficient between the two sets of dataand finds it to be 0.43. Given that she collected data from 15 samples, test, at the 5% level ofsignificance, the claim that there is a negative correlation between the amount of solvent and therate of reaction. State your hypotheses clearly.(3 marks)P7 A safari ranger believes that there is a positive correlation between the amount of grass persquare kilometre and the number of meerkats that graze there. He decides to carry out ahypothesis test to see if there is evidence for his claim. He takes a random sample of 10 equalsized areas of grassland, records the amount of grass and the number of meerkats grazing ineach, and finds that the correlation coefficient is 0.66.use a two-tailed test with H0 : ρ 0, H1 : ρ 0b at the 2% level.10E1CExercise78d Give an interpretation of the value 0.05 in your hypothesis test.If the observed value does not lie inside thecritical region, you do not reject the null Year 1, Section 7.2hypothesis.There is not sufficient evidence, at the10% level of significance, of a positivecorrelation between the daily maximum gustand the daily maximum relative humidity.96c Test this claim at a 0.05 significance level, stating your hypotheses clearly.Use the table of critical values on page XX to findthe critical region for a one-tailed test with asignificance level of 10%.0.1149 0.5067. The observed value of ris not in the critical region, so there is notenough evidence to reject H0.5A teacher claims that students who do well in their theoretical test also tend to do well in theirpractical test.Use your calculator.b H0 : ρ 0, H1 : ρ 0Sample size 8Significance level 0.1From the table, the critical value of r is0.5067 and the critical region isr 0.5067Marks in theoretical test, tMarks in practical test, pb Find the product moment correlation coefficient for these data, correct to 3 significant figures.(2 marks) Crown Copyright Met Officeb Test, at the 10% level of significance, whether there is evidence of a positive correlation betweendaily maximum gust and daily maximum relative humidity. State your hypotheses clearly.a r 0.1149(1 mark)Twelve students sat two Biology tests, one theoretical the other practical. Their marks are shownbelow.The table from the large data set shows the daily maximum gust, x kn, and the daily maximumrelative humidity, y%, in Leeming for a sample of eight days in May 2015.x3 a State what is measured by the product moment correlation coefficient.Given that this result provided the ranger with sufficient evidence to reject his null hypothesis,suggest the least possible significance level for the ranger’s test.11
Chapter 1PERegression, correlation and hypothesis testing8 Data on the daily maximum temperature and the daily total sunshine is taken from the largedata set for Leuchars in May and June 1987. A meteorologist finds that the product momentcorrelation coefficient for these data is 0.715. Given that the researcher tests for positivecorrelation at the 2.5% level of significance, and concludes that the value is significant, find thesmallest possible sample size.P9 An employee at a weather centre believes that there is a negative correlation between humidityand visibility. She takes a sample of data from Heathrow in August 1987.Humidity (%)9293918291100Visibility (m)250015002700290022001000(1 mark)CDEFGHIJAdditive, x (25 gm units)123456789104.04.24.34.54.54.75.25.25.15.1c Without further calculation, write down, with a reason, how the product moment correlationcoefficient for all 10 cows would differ from your answer to b.E11 Conor uses a 3D printer to produce various pieces for a model. He records the time taken,t hours, to produce each piece, and its base area, x cm2.Base area, x (cm2)1.11.31.92.22.53.7Time, t (hours)0.70.91.51.82.23.85 The following table shows the engine size (c), in cubic centimetres, and the fuel consumption( f ), in miles per gallon to the nearest mile, for 10 car models.c (cm3)1000120014001500160018002000220025003000f (mpg)46424339413735292825a Use your calculator to find the value of the product moment correlation coefficientbetween c and f.(1 mark)b Interpret your answer to part a.a Calculate the product moment correlation coefficient between log x and log t.(2 marks)Eb Use your answer to part a to explain why an equation of the form t axn, where a and n areconstants, is likely to be a good model for the relationship between x and t.(1 mark)2 The table shows some data collected on the temperature in C of a chemical reaction (t) and theamount of dry residue produced (d grams).Temperature, t ( C)385172838994Dry residue, d (grams)4.311.758.6136.7217.0318.8b Explain why this model is not reliable for estimating the amount of dry residue producedwhen the temperature is 151 C.(1 mark)3 The product moment correlation coefficient for a person’s age and his score on a memory test is 0.86. Interpret this value.6 As part of a survey in a particular profession, age, x years, and yearly salary, y thousands,were 1a Calculate, to 3 decimal places, the product moment correlation coefficient between age andsalary.(1 mark)It is suggested that there is no correlation between age and salary.b Test this suggestion at the 5% significance level, stating your null and alternative hypothesesclearly.(3 marks)The data are coded using the changes of variable x t and y log d. The regression line of yon x is found to be y 0.635 0.0334x.a Given that the data can be modelled by an equation of the form d abt where a and b areconstants, find the values of a and b.(3 marks)(2 marks)The values of x and y for a randomly selected sample of ten members of the profession are asfollows:c The regression line of log t on log x is given as log t 0.210 1.38 log x. Determine thevalues of the constants a and n in the equation given in part b.(2 marks)12Bb Use your calculator to find the value of the product moment correlation coefficient for thefirst seven cows.b Test, at the 1% level of significance, the employee’s claim. State your hypotheses clearly.(3 marks)EAa By drawing a scatter diagram or otherwise, suggest the maximum amount of additive thatshould be given to the cows to maximise yield.a Calculate the product moment correlation coefficient for these data.ECowYield, y (gallons) Crown Copyright Met OfficeMixed exercise4 Each of 10 cows was given an additive (x) every day for four weeks to see if it would improvethe milk yield ( y). At the beginning, the average milk yield per day was 4 gallons. The milkyield of each cow was measured on the last day of the four weeks. The data collected is shownin the table.E7 A machine hire company kept records of the age, X months, and the maintenance costs, Y, of one type of machine. The following table summarises the data for a random sample of10 machines.MachineABCDEFGHIJAge, X63123481511445742489Maintenance costs, Y11125411816421511454324113
Chapter 1Regression, correlation and hypothesis testinga Calculate, to 3 decimal places, the product moment correlation coefficient.(1 mark)It is believed that there is a relationship between the age and maintenance cost of these machines.b Using a 5% level of significance and quoting from the table of critical values, interpretyour correlation coefficient. Use a two-tailed test and state clearly your null and alternativehypotheses.(3 marks)ETemperature, y ( C)1400400280790390590540125068061518101614137139 The ages, in months, and the weights, in kg, of a random sample of nine babies are shown inthe table below.BabyABCDEFGHIAge, x1223334454.45.25.86.46.77.27.67.98.4Weight, yThe product moment correlation coefficient between weight and age for these babies was foundto be 0.972. By testing for positive correlation at the 5% significance level interpret this value.(3 marks)E10 An ice-cream seller believes that there is a positive correlation between the amount ofsunshine and sales of ice cream. He collects data on six days during June 2015 at his ‘pitch’ inCamborne:Sunshine (hours)4.27.913.88.76.20.7Ice-cream sales ( 100s)7.08.312.48.17.96.2a Calculate the product moment correlation coefficient for these data.(1 mark)b Carry out a hypothesis test to determine, at the 5% level, if there is significant evidence insupport of the ice-cream seller’s belief. State your hypotheses clearly.(3 marks)E11 A meteorologist believes that there is a positive correlation between daily mean windspeed anddaily maximum gust. She collects data from the large data set for 5 days during August 2015 inthe town of Hurn.Mean windspeed (knots)47785Daily maximum gust ure (hPa)10101011101299710099981002 Crown Copyright Met OfficeYou will need access to the large data set and spreadsheet software toanswer these questions.1 a Take a random sample of size 20 from the data for Heathrow in2015, and record the daily maximum air temperature and dailytotal rainfall.b Calculate the product moment correlation coefficient betweenthese variables for your sample.c Test, at the 5% level of significance, the claim that there is acorrelation between the daily maximum air temperature and thedaily total rainfall.2 a State with a reason whether you would expect to find arelationship between daily mean total cloud cover and daily meanvisibility.b Use a random sample from the large data set to test for thisrelationship. You should state clearly: Your sample size and location Your sampling method The hypotheses and significance level for your test A conclusion in the context of the questionHintYou might be ableto use the Correl orCorrelationCoefficientcommands in yourspreadsheet software tocalculate the PMCC.Summary of key points1 If y axn for constants a and n then log y log a n log x2 If y kbx for constants k and b then log y log k x log b3 The product moment correlation coefficient describes the linear correlation between twovariables. It can take values between 1 and 1.4 For a one-tailed test use either: Crown Copyright Met OfficeBy calculating the product moment correlation coefficient for these data, test at the 5% levelof significance whether there is evidence to support the meteorologist’s claim. State yourhypotheses clearly.(4 marks)14Temperature ( C)Large data setThe product moment correlation coefficient is 0.975. Use this value to test for negativecorrelation at the 5% significance level. Interpret your result in context.(3 marks)E12 The table shows data from the large data set on the daily mean air temperature and the dailymean pressure during May and June 2015
Edexcel AS and A level Mathematics. 3 Regression, correlation and hypothesis testing a When t 0, x 0, so according to the model, y 0.2215 log g 0.2215 g 10 0.2215 0.600 (3 s.f.). This growth rate is positive: the c