Transcription
CambridgeInternational AS and A Level MathematicsMechanicsSophie GoldieSeries Editor: Roger Porkess
Questions from the Cambridge International Examinations AS and A Level Mathematics papersare reproduced by permission of University of Cambridge International Examinations.Questions from the MEI AS and A Level Mathematics papers are reproduced by permission of OCR.We are grateful to the following companies, institutions and individuals who have given permissionto reproduce photographs in this book.Photo credits: page 2 Mathematics in Education and Industry; page 6 Radu Razvan – Fotolia; page 22 Iain Masterton /Alamy; page 24 photoclicks – Fotolia; page 40 DOD Photo / Alamy; page 44 Dr Jeremy Burgess / Science Photo Library; page45 Jonathan Pope / http://commons.wikimedia.org/wiki/File:Olympic Curling, Vancouver 2010 crop y/2.0/deed.en/16thJan2011; page 47 imagehit – Fotolia; page 53 NASA / Goddard Space FlightCenter / Arizona State University; page 59 Lebrecht Music and Arts Photo Library / Alamy; page 60 Mehau Kulyk / Science PhotoLibrary; page 64 Dmitry Lobanov – Fotolia; page 67 Imagestate Media (John Foxx); page 85 l Dean Moriarty – Fotolia;page 85 c Masson – Fotolia; page 85 r Marzanna Syncerz – Fotolia; page 99 Tifonimages – Fotolia; page 115 Kathrin39 –Fotolia; page 138 SHOUT / Alamy; page 153 Mathematics in Education and Industry; page 154 Image Asset Management Ltd./ SuperStock; page 175 Steve Mann – Fotolia; page 184 photobyjimshane – Fotolia; page 253 Millbrook Proving Ground Ltd;page 264 cube197 – Fotolia; page 266 l M.Rosenwirth – Fotolia; page 266 c Michael Steele / Getty Images; page 266 r NickR –Fotolia; page 280 Steeve ROCHE – Fotolia; page 295 Lovrencg – Fotolia; page 308 blueee – FotoliaPhoto credits for CD material: Exercise 14B question 11 Monkey Business – Fotolial left, c centre, r rightAll designated trademarks and brands are protected by their respective trademarks.Every effort has been made to trace and acknowledge ownership of copyright. The publishers will beglad to make suitable arrangements with any copyright holders whom it has not been possible to contact. IGCSE is the registered trademark of University of Cambridge International Examinations.Hachette UK’s policy is to use papers that are natural, renewable and recyclable products andmade from wood grown in sustainable forests. The logging and manufacturing processes areexpected to conform to the environmental regulations of the country of origin.Orders: please contact Bookpoint Ltd, 130 Milton Park, Abingdon, Oxon OX14 4SB.Telephone: (44) 01235 827720. Fax: (44) 01235 400454. Lines are open 9.00–5.00, Mondayto Saturday, with a 24-hour message answering service. Visit our website at www.hoddereducation.co.ukMuch of the material in this book was published originally as part of the MEI StructuredMathematics series. It has been carefully adapted for the Cambridge International AS and A LevelMathematics syllabus.The original MEI author team for Mechanics comprised John Berry, Pat Bryden, Ted Graham, David Holland,Cliff Pavelin and Roger Porkess.Copyright in this format Roger Porkess and Sophie Goldie, 2012First published in 2012 byHodder Education, an Hachette UK company,338 Euston RoadLondon NW1 3BHImpression numberYear543212016 2015 2014 2013 2012All rights reserved. Apart from any use permitted under UK copyright law, no part of thispublication may be reproduced or transmitted in any form or by any means, electronic ormechanical, including photocopying and recording, or held within any information storageand retrieval system, without permission in writing from the publisher or under licence fromthe Copyright Licensing Agency Limited. Further details of such licences (for reprographicreproduction) may be obtained from the Copyright Licensing Agency Limited, SaffronHouse, 6–10 Kirby Street, London EC1N 8TS.Cover photo by Imagestate Media (John Foxx)Illustrations by Pantek Media, Maidstone, KentTypeset in 10.5pt Minion by Pantek Media, Maidstone, KentPrinted in DubaiA catalogue record for this title is available from the British LibraryISBN 978 1444 14648 6This eBook does not include the ancillary media that was packaged with the printed version of the book.
ContentsKey to symbols in this bookviIntroductionviiThe Cambridge International AS and A Level Mathematics syllabus viiiM1 Mechanics 11Chapter 1Motion in a straight lineThe language of motionSpeed and velocityAccelerationUsing areas to find distances and displacements2261113Chapter 2The constant acceleration formulaeSetting up a mathematical modelThe constant acceleration formulaeFurther examples22222431Chapter 3Forces and Newton’s laws of motionForce diagramsForce and motionPulleysReviewing a mathematical model: air resistance4040475559Chapter 4Applying Newton’s second law along a lineNewton’s second lawNewton’s second law applied to connected objects646471Chapter 5VectorsAdding vectorsComponents of a vectorThe magnitude and direction of vectors written in component formResolving vectors8585879294iii
Chapter 6Forces in equilibrium and resultant forcesFinding resultant forcesForces in equilibruimNewton’s second law in two dimensions9999103114Chapter 7General motion in a straight lineUsing differentiationFinding displacement from velocityThe area under a velocity–time graphFinding velocity from accelerationThe constant acceleration formulae revisited124125127128129131Chapter 8A model for frictionA model for frictionModelling with friction138139141Chapter 9Energy, work and powerEnergy and momentumWork and energyGravitational potentional energyWork and kinetic energy for two-dimensional motionPower154154155163168175M2 Mechanics 2iv183Chapter 10Motion of a projectileModelling assumptions for projectile motionProjectile problemsFurther examplesThe path of a projectileGeneral equations184184188192202203Chapter 11Moments of forcesRigid bodiesMomentsCouplesEquilibrium revisited210211212214214
Chapter 12Centre of massComposite bodiesCentre of mass for two- and three-dimensional bodiesSliding and toppling235238241253Chapter 13Uniform motion in a circleNotationAngular speedVelocity and accelerationThe forces required for circular motionExamples of circular motion266267267271274274Chapter 14Hooke’s lawStrings and springsHooke’s lawUsing Hooke’s law with more than one spring or stringWork and energyVertical motion295296298301307314Chapter 15Linear motion under a variable forceNewton’s second law as a differential equationVariable force examples321322324AnswersIndex333356v
Key to symbols in this book? This symbol means that you may want to discuss a point with your teacher. Ifyou are working on your own there are answers in the back of the book. It isimportant, however, that you have a go at answering the questions before lookingup the answers if you are to understand the mathematics fully.!This is a warning sign. It is used where a common mistake, misunderstanding ortricky point is being described.This is the ICT icon. It indicates where you could use a graphic calculator or acomputer. Graphical calculators and computers are not permitted in any of theexaminations for the Cambridge International AS and A Level Mathematics 9709syllabus, however, so these activities are optional.This symbol and a dotted line down the right-hand side of the page indicatesmaterial which is beyond the syllabus but which is included for completeness.vi
IntroductionThis is one of a series of books for the University of Cambridge InternationalExaminations syllabus for Cambridge International AS and A Level Mathematics9709. There are fifteen chapters in this book; the first nine cover Mechanics 1and the remaining six Mechanics 2. The series also includes two books for puremathematics and one for statistics.These books are based on the highly successful series for the Mathematics inEducation and Industry (MEI) syllabus in the UK but they have been redesignedfor Cambridge International students; where appropriate new material has beenwritten and the exercises contain many past Cambridge examination questions.An overview of the units making up the Cambridge international syllabus is givenin the diagram on the next page.Throughout the series the emphasis is on understanding the mathematicsas well as routine calculations. The various exercises provide plenty of scopefor practising basic techniques; they also contain many typical examinationquestions.In the examinations of the Cambridge International AS and A Level Mathematics9709 syllabus the value of g is taken to be 10 m s 2 and this convention is used inthis book; however, in a few questions readers are introduced to a more accuratevalue, typically 9.8 m s 2.An important feature of this series is the electronic support. There is anaccompanying disc containing two types of Personal Tutor presentation:examination-style questions, in which the solutions are written out, step by step,with an accompanying verbal explanation, and test yourself questions; these aremultiple-choice with explanations of the mistakes that lead to the wrong answersas well as full solutions for the correct ones. In addition, extensive online supportis available via the MEI website, www.mei.org.uk.The books are written on the assumption that students have covered andunderstood the work in the Cambridge IGCSE syllabus. There are places wherethe books show how the ideas can be taken further or where fundamentalunderpinning work is explored and such work is marked as ‘Extension’.The original MEI author team would like to thank Sophie Goldie who hascarried out the extensive task of presenting their work in a suitable form forCambridge international students and for her original contributions. Theywould also like to thank University of Cambridge International Examinationsfor their detailed advice in preparing the books and for permission to use manypast examination questions.Roger PorkessSeries Editorvii
The Cambridge InternationalAS and A Level AS LevelMathematicsM1S1M1S2P3M1viiiS1M2A LevelMathematics
Mechanics 1M1
Motion in a straight lineM111Motion in a straight lineThe whole burden of philosophy seems to consist in this – from thephenomena of motions to investigate the forces of nature.Isaac NewtonThe language of motionThrow a small object such as a marble straight up in the air and think about thewords you could use to describe its motion from the instant just after it leavesyour hand to the instant just before it hits the floor. Some of your words mightinvolve the idea of direction. Other words might be to do with the position of themarble, its speed or whether it is slowing down or speeding up. Underlying manyof these is time.DirectionThe marble moves as it does because of the gravitational pull of the earth. Weunderstand directional words such as up and down because we experience thispull towards the centre of the earth all the time. The vertical direction is along theline towards or away from the centre of the earth.In mathematics a quantity which has only size, or magnitude, is called a scalar.One which has both magnitude and a direction in space is called a vector.Distance, position and displacementThe total distance travelled by the marble at any time does not depend on itsdirection. It is a scalar quantity.2
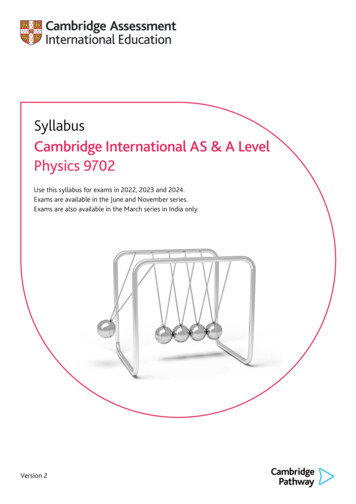
Position and displacement are two vectors related to distance: they have directionas well as magnitude. Here their direction is up or down and you decide which ofthese is positive. When up is taken to be positive, down is negative.topposition 1.25mpositivedirection1.25 mThe language of motionThe position of the marble is then its distance above a fixed origin, for examplethe distance above the place it first left your hand.M11handzero positionFigure 1.1When it reaches the top, the marble might have travelled a distance of 1.25 m.Relative to your hand its position is then 1.25 m upwards or 1.25 m.At the instant it returns to the same level as your hand it will have travelled a totaldistance of 2.5 m. Its position, however, is zero upwards.A position is always referred to a fixed origin but a displacement can be measuredfrom any position. When the marble returns to the level of your hand, itsdisplacement is zero relative to your hand but 1.25 m relative to the top.? What are the positions of the particles A, B and C in the diagram below?A–4B–3–2–10C12345xFigure 1.2What is the displacement of B(i)relative to A (ii) relative to C?Diagrams and graphsIn mathematics, it is important to use words precisely, even though they might beused more loosely in everyday life. In addition, a picture in the form of a diagramor graph can often be used to show the information more clearly.3
Figure 1.3 is a diagram showing the direction of motion of the marble andrelevant distances. The direction of motion is indicated by an arrow. Figure 1.4is a graph showing the position above the level of your hand against the time.Notice that it is not the path of the marble.Motion in a straight lineM11position(metres)AA1.25 mH21B00.51B1.5time (s)1m–1CFigure 1.3? CFigure 1.4The graph in figure 1.4 shows that the position is negative after one second(point B). What does this negative position mean?NoteWhen drawing a graph it is very important to specify your axes carefully. Graphsshowing motion usually have time along the horizontal axis. Then you have todecide where the origin is and which direction is positive on the vertical axis. In thisgraph the origin is at hand level and upwards is positive. The time is measured fromthe instant the marble leaves your hand.Notation and unitsAs with most mathematics, you will see in this book that certain letters arecommonly used to denote certain quantities. This makes things easier to follow.Here the letters used are:4 s, h, x, y and z for position t for time measured from a starting instant u and v for velocity a for acceleration.
The S.I. (Système International d’Unités) unit for distance is the metre (m), thatfor time is the second (s) and that for mass the kilogram (kg). Other units followfrom these so speed is measured in metres per second, written m s 1. 1 hen the origin for the motion of the marble (see figure 1.3) is on theWground, what is its position(i)(ii)2when it leaves your hand?at the top?Exercise 1AEXERCISE 1AM11A boy throws a ball vertically upwards so that its position y m at time t is asshown in the graph.position(m) 76543210(i)(ii)(iii)32 ttime (s)Write down the position of the ball at times t 0, 0.4, 0.8, 1.2, 1.6 and 2.Calculate the displacement of the ball relative to its starting position atthese times.What is the total distance travelled(a) during the first 0.8 s (b) during the 2 s of the motion?The position of a particle moving along a straight horizontal groove is given byx 2 t(t 3) for 0 t 5 where x is measured in metres and t in seconds.(i)(ii)(iii)(iv)41What is the position of the particle at times t 0, 1, 1.5, 2, 3, 4 and 5?Draw a diagram to show the path of the particle, marking its position atthese times.Find the displacement of the particle relative to its initial position at t 5.Calculate the total distance travelled during the motion.For each of the following situations sketch a graph of position against time.Show clearly the origin and the positive direction.(i)(ii)(iii)A stone is dropped from a bridge which is 40 m above a river.A parachutist jumps from a helicopter which is hovering at 2000 m. Sheopens her parachute after 10 s of free fall.A bungee jumper on the end of an elastic string jumps from a high bridge.5
Motion in a straight lineM115 he diagram is a sketch ofTthe position–time graph for afairground ride.(i)(ii)positionDescribe the motion, statingin particular what happens atO, A, B, C and D.What type of ride is this?ABOD timeCSpeed and velocitySpeed is a scalar quantity and does not involve direction. Velocity is the vectorrelated to speed; its magnitude is the speed but it also has a direction. When anobject is moving in the negative direction, its velocity is negative.Amy has to post a letter on her way to college. The post box is 500 m east ofher house and the college is 2.5 km to the west. Amy cycles at a steady speed of10 m s 1 and takes 10 s at the post box to find the letter and post it.Figure 1.5 shows Amy’s journey using east as the positive direction. The distanceof 2.5 km has been changed to metres so that the units are consistent.C10 m s2500 m1HP500 meastpositivedirectionFigure 1.56After she leaves the post box Amy is travelling west so her velocity is negative. Itis 10 m s 1.
The distances and times for the three parts of Amy’s journey are:position(m)1000Time500 m500 50 s10500At post box0m10 s– 500Post box tocollege3000 m3000 300 s10Home topost box0– 100050 100 150 200 250 300 350 time(s)– 1500– 2000These can be used to draw theposition–time graph using homeas the origin, as in figure 1.6.? – 2500M11Speed and velocityDistanceFigure 1.6Calculate the gradient of the three portions of this graph. What conclusions canyou draw?The velocity is the rate at which the position changes. Velocity is represented by the gradient of the position–time graph.Figure 1.7 is the velocity–time graph.NoteBy drawing the graphs below eachother with the same horizontalvelocity(m s–1)100scales, you can see how theycorrespond to each other.– 1050 100 150 200 250 300 350 time(s)Figure 1.7Distance–time graphsFigure 1.8 is the distance–timegraph of Amy’s journey. It differsfrom the position–time graphbecause it shows how far shetravels irrespective of her direction.There are no negative values.The gradient of this graphrepresents Amy’s speed rather thanher velocity.distance(m)350030002500200015001000500050 100 150 200 250 300 350 time(s)Figure 1.87
Motion in a straight lineM11? It has been assumed that Amy starts and stops instantaneously. What wouldmore realistic graphs look like? Would it make a lot of difference to the answers ifyou tried to be more realistic?Average speed and average velocityYou can find Amy’s average speed on her way to college by using the definition average speed total distance travelledtotal time takee nWhen the distance is in metres and the time in seconds, speed is found bydividing metres by seconds and is written as m s 1. So Amy’s average speed is3500 m 9.72 ms 1360 sAmy’s average velocity is different. Her displacement from start to finish is 2500 m soThe college is in thenegative direction. average velocity displacementtime taken 2500360 6.94 m s 1 If Amy had taken the same time to go straight from home to college at a steadyspeed, this steady speed would have been 6.94 m s 1.8
Velocity at an instantThe velocity is represented bythe gradient of the position–timegraph. When a position–time graphis curved like this you can find thevelocity at an instant of time bydrawing a tangent as in figure 1.9.The velocity at P is approximately0.6 2.4 ms– 10.25The velocity–time graph is shown infigure 1.10.M11position(m)2AP10.6 m0.25 s0 H0.5B1 time (s)Speed and velocityThe position–time graph for amarble thrown straight up into theair at 5 m s 1 is curved because thevelocity is continually changing.C1Figure 1.9velocity(m s–1)64H20–2–4–6PA0.51 time (s)BCFigure 1.10? What is the velocity at H, A, B and C? The speed of the marble increases after itreaches the top. What happens to the velocity?At the point A, the velocity and gradient of the position–time graph are zero. Wesay the marble is instantaneously at rest. The velocity at H is positive because themarble is moving in the positive direction (upwards). The velocity at B and at Cis negative because the marble is moving in the negative direction (downwards).9
EXERCISE 1B 1Draw a speed–time graph for Amy’s journey on page 6.2The distance–time graphshows the relationship betweendistance travelled and time fora person who leaves home at9.00 am, walks to a bus stopand catches a bus into town.Motion in a straight 5B9.309.45 timeDescribe what is happeningduring the time from A to B. The section BC is much steeper than OA; what does this tell you aboutthe motion?Draw the speed–time graph for the person.What simplifications have been made in drawing these graphs?the initial and final positionsthe total displacementthe total distance travelledthe velocity and speed for each part of the journeythe average velocity for the whole journeythe average speed for the whole journey.positionpositionposition8(m)(m)(m) 88666444222000222444(iii) 055500055510101010CFor each of the following journeys find(a)4distance(km)54321111 222 333 444 timetime(s)time(s)(s)position(ii) positionposition60(km)(km)60(km) nutes)10 2020 3030 4040 5050 6060 timetime(minutes)(minutes)(iv) 5101010555AA111 222 333 444 555 666 timetime(s)000 Atime(s)(s)111 222 333 444 555 666 5BBB202020AAABBBA plane flies from London to Toronto, a distance of 5700 km, at an averagespeed of 1280 km h–1. It returns at an average speed of 1200 km h–1. Find theaverage speed for the round trip.
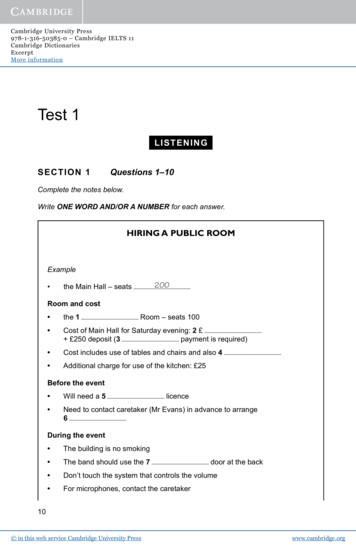
AccelerationOver a period of time average acceleration M11AccelerationIn everyday language, the word ‘accelerate’ is usually used when an object speeds upand ‘decelerate’ when it slows down. The idea of deceleration is sometimes used ina similar way by mathematicians but in mathematics the word acceleration is usedwhenever there is a change in velocity, whether an object is speeding up, slowingdown or changing direction. Acceleration is the rate at which the velocity changes.change in velocitytime takenAcceleration is represented by the gradient of a velocity–time graph. It is a vectorand can take different signs in a similar way to velocity. This is illustrated byTom’s cycle journey which is shown in figure 1.11.Tom turns on to the main roadat 4 m s 1, accelerates uniformly,maintains a constant speed andthen slows down uniformly tostop when he reaches home.Between A and B, Tom’s velocityincreases by (10 4) 6 m s 1 in6 seconds, that is by 1 metre persecond every second.speed(m s 1)15B1050CA105152025D30 time (s)Figure 1.11This acceleration is written as 1 m s 2 (one metre per second squared) and is thegradient of AB.From B to Cacceleration 0 m s 2From C to Dacceleration There is no change in velocity.(0 10) 2.5 ms 2(30 26)From C to D, Tom is slowing down while still moving in the positive directiontowards home, so his acceleration, the gradient of the graph, is negative.The sign of accelerationThink again about the marble thrown upinto the air with a speed of 5 m s 1.Figure 1.12 represents the velocity whenupwards is taken as the positive directionand shows that the velocity decreases from 5 m s 1 to 5 m s 1 in 1 second.This means that the gradient, and hencethe acceleration, is negative. It is 10 m s 2.(You might recognise the number 10 as anapproximation to g. See Chapter 2 page 28.)velocity(m s –1)5 H0–5Figure 1.12A0.51 time(s)BC11
M11Motion in a straight line? A car accelerates away from a set of traffic lights. It accelerates to a maximumspeed and at that instant starts to slow down to stop at a second set of lights.Which of the graphs below could represent(i)(ii)(iii)the distance–time graphthe velocity–time graphthe acceleration–time graph of its motion?ABCDEFigure 1.13Exercise 1C 1 (i)Calculate the acceleration for each part of the following journey.velocity(m s–1)5(a)0(b)510(c)15(d)(e)20 time(s)–5Use your results to sketch an acceleration–time graph.A particle moves so that its position x metres at time t seconds is x 2t 3 18t.(ii)2(i)(ii)(iii)(iv)3A train takes 45 minutes to complete its 24 kilometre trip. It stops for 1 minuteat each of 7 stations during the trip.(i)(ii)12Calculate the position of the particle at times t 0, 1, 2, 3 and 4.Draw a diagram showing the position of the particle at these times.Sketch a graph of the position against time.State the times when the particle is at the origin and describe the directionin which it is moving at those times.Calculate the average speed of the train.What would be the average speed if the stop at each station was reduced to20 seconds?
4 hen Louise is planning car journeys she reckons that she can cover distancesWalong main roads at roughly 100 km h–1 and those in towns at 30 km h–1.(ii)5A lift travels up and down between the ground floor (G) and the roof garden(R) of a hotel. It starts from rest, takes 5 s to increase its speed uniformly to2 m s 1, maintains this speed for 5 s and then slows down uniformly to rest inanother 5 s. In the following questions, use upwards as positive.Sketch a velocity–time graph for the journey from G to R.(i)On one occasion the lift stops for 5 s at R before returning to G.(ii) Sketch a velocity–time graph for this journey from G to R and back.(iii) Calculate the acceleration for each 5 s interval. Take care with the signs.(iv) Sketch an acceleration–time graph for this journey.6Using areas to find distances and displacementsFind her average speed for each of the following journeys.(a) 20 km on main roads and then 10 km in a town(b) 150 km on main roads and then 2 km in a town(c) 20 km on main roads and then 20 km in a townIn what circumstances would her average speed be 65 km h–1?(i)M11A film of a dragster doing a 400 m run from a standing start yields thefollowing positions at 1 second intervals.2.5 10 22.54062.590122.5160distance (m)Draw a displacement–time graph of its motion.Use your graph to help you to sketch(a) the velocity–time graph(b) the acceleration–time graph.(i)(ii)Using areas to find distances and displacementsThese graphs model the motion of a stone falling from rest.distance(m) 50speed(m s–1)5040403030202010100Figure 1.14123 time, t(s)01Figure 1.1523 time, t(s)13
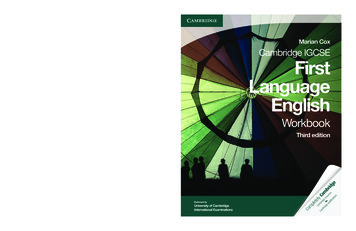
M11? Calculate the area between the speed–time graph and the time axis from(i) t 0 to 1(ii) t 0 to 2(iii) t 0 to 3.Motion in a straight lineCompare your answers with the distance that the stone has fallen, shown on thedistance–time graph, at t 1, 2 and 3. What conclusions do you reach? The area between a speed–time graph and the time axis represents thedistance travelled.There is further evidence for this if you consider the units on the graphs.Multiplying metres per second by seconds gives metres. A full justification relieson the calculus methods you will learn in Chapter 7.Finding the area under speed–time graphsMany of these graphs consist of straight-line sections. The area is easily found bysplitting it up into triangles, rectangles or trapezia.vvVTvVTt1Triangle: area VT2V2V1TttTrapezium:1area (V1 V2)T2Rectangle: area VTFigure 1.16The graph shows Hinesh’s journeyfrom the time he turns on to themain road until he arrives home.How far does Hinesh cycle?EXAMPLE 1.1SOLUTIONSplit the area under the speed–timegraph into three regions.Ptrapezium:Q rectangle:R triangle:speed(m s–1)105A0B4CQ10P51015102025RD30 time(s)Figure 1.171area 2 (4 10) 6 42 marea 10 20 200 m1area 2 10 4 20 mtotal area 262 mHinesh cycles 262 m.? 14What is the meaning of the area between a velocity–time graph and the time axis?
The area between a velocity–time graph and the time axisEXAMPLE 1.2M11Sunil walks east for 6 s at 2 m s 1 then west for 2 s at 1 m s 1. Draw(i)(iii)Interpret the area under each graph.SOLUTIONSunil’s journey is illustrated below.(i)2 mswest1(6 s)5101 ms1(2 s)15eastFigure 1.18Speed–time graph(ii)speed(m s–1)2Total area 12 2 14.This is the total distancetravelled in metres.121Using areas to find distances and displacements(ii)a diagram of the journeythe speed–time graphthe velocity–time graph.2246time (s)8Figure 1.19(iii)Velocity–time graphvelocity(m s–1)21210–1Total area 12 2 10.This is the displacementfrom the start in metres.246–28time (s)Figure 1.20 The area between a velocity–time graph and the time axis represents thechange in position, that is the displacement.When the velocity is negative, the area is below the time axis and represents adisplacement in the negative direction, west in this case.15
Estimating areasM11Motion in a straight lineSometimes the velocity–time graph does not consist of straight lines so you haveto make the best estimate you can by counting the squares underneath it or byreplacing the curve by a number of straight lines as for the trapezium rule (seePure Mathematics 2, Chapter 5).? This speed–time graph shows the motion of a dog over a 60 s period.speed(m s–1)20151050102030405060time (s)Figure 1.21Estimate how far the dog travelled during this time.On the London underground, Oxford Circus and Piccadilly Circus are 0.8 kmapart. A train accelerates uniformly to a maximum speed when leaving OxfordCircus and maintains this speed for 90 s before decelerating uniformly to stop atPiccadilly Circus. The whole journey takes 2 minutes. Find the maximum speed.EXAMPLE 1.3SOLUTIONThe sketch of the speed–time graphof the journey shows the giveninformation, with suitable units.The maximum speed is v m s 1.1The area is 2 (120 90) v 800800v 105 7.619speed(m s–1)A90 sBvareaC800 m0Figure 1.22The maximum speed of the train is 7.6 m s 1 (to 2 s.f.).16? Does it matter how long the train takes to speed up and slow down?D120 time (s)
EXERCISE 1D1 The graphs show the speeds of two cars travelling along a street.speedspeed(ms–1s–1) )(m2020M11speedspeed(ms–1s–1) s)(s)timeExercise 1D1515carBBcar101020203030time(s)(s)timeFor each car find(i)(ii)(iii)2the acceleration for each part of its motionthe total distance it travels in the given timeits average speed.The graph shows the speed of a lorry whe
Examinations syllabus for Cambridge International AS and A Level Mathematics 9709. There are fifteen chapters in this book; the first nine cover Mechanics 1 and the remaining six Mechanics 2. The series also includes two books for pure mathematics and one for statistics. These books are based on the highly successful series for the Mathematics in