Transcription
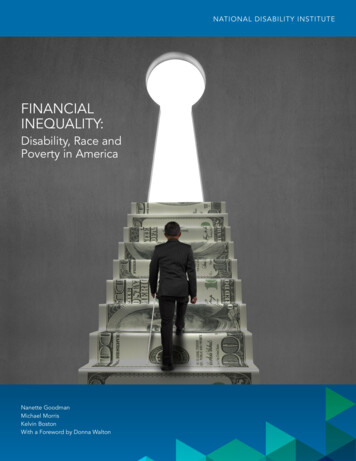
FACT SHEETAfrican AmericansCollege Majors and EarningsAfrican Americans Concentrated in Low-Paying MajorsAccess to college for African Americans has increased, but African Americans are highly concentrated in lower-payingmajors. The college major, which has critical economic consequences throughout life, reflects personal choices butalso reflects the fact that African-American students are concentrated in open-access four-year institutions thatlimited choices of majors offered. African Americans represent 12 percent of the US population, but are underrepresented in the number of degree holders in college majors associated with the fastest-growing, highest-payingoccupations - STEM, health, and business.African Americans account for only 8 percent of general engineering majors, 7 percent of mathematics majors,and only 5 percent of computer engineering majors.1 They are similarly under-represented in business: only 7percent of finance and marketing majors are African-American. In health majors, they account for 10 percent butare clustered in the lowest-earning detailed major: 21 percent are in health and medical administrative services,compared to only 6 percent in the higher-earning detailed major of pharmacy, pharmaceutical sciences, andadministration. African Americans are also highly represented in majors associated with serving the community,which tend to be low-earning - human services and community organization (20%) and social work (19%).Since 2009, there has not been significant change in the proportion of African Americans across majors. One of themost significant changes occurred within the architecture and engineering major group. The percentage of AfricanAmericans with industrial and manufacturing engineering or miscellaneous engineering technologies majorsdecreased by 4 percentage points and 3 percentage points, respectively. Also, the proportion of African Americansin majors where they were already highly concentrated saw a slight increase: social work and health and medicaladministrative services both increased by 3 percentage points.Why Majors and Earnings MatterEarnings vary greatly among various college majors. African Americans who earned a Bachelor’s degree in a STEMrelated major, such as architecture or engineering, can earn as much as 50 percent more than African Americanswho earned a Bachelor’s degree in art or psychology and social work (Figure 1).12There are 137 detailed majors grouped into 15 general categories. For example, architecture, general engineering, and electrical engineering are all specificmajors under the larger grouping of architecture and engineering.
Figure 1. Architecture and engineering is the major group with the highest median earnings for AfricanAmericans with a Bachelor’s degree.Majors with the highest medianearnings for African AmericansMajors with the lowest medianearnings for African Americans 66,206 61,998 61,868 cs, andMathematicsHealthBusiness 42,107 42,107 43,034Industrial Arts,PsychologyConsumer Services, and Socialand RecreationWorkArtsBachelor’s degree holders refer to adults between the ages of 21 and 59 with a Bachelor’s degree but no graduate degree. Earnings data are reported for workers employedfull-time, full-year. Source: Georgetown University Center on Education and the Workforce analysis of U.S. Census Bureau, American Community Survey microdata, 2010-2014.Yet, African Americans account for 12 percent of all Bachelor’s degree holders who majored in psychology andsocial work, and only 5 percent of architecture and engineering majors (Table 1).Table 1. Concentrations of African American Bachelor’s degree holders among major groupings.Major GroupPercentage African American (%)Law and Public Policy15Psychology and Social Work12Health10Business9Social Sciences9Computers, Statistics, and Mathematics9Communications and Journalism8Physical Sciences8Biology and Life Sciences7Industrial Arts, Consumer Services, and Recreation7Education7Humanities and Liberal Arts6Architecture and Engineering5Arts5Agriculture and Natural Resources3Bachelor’s degree holders refer to adults between the ages of 21 and 59 with a Bachelor’s degree but no graduate degree. Earnings data are reported for workers employedfull-time, full-year. Source: Georgetown University Center on Education and the Workforce analysis of U.S. Census Bureau, American Community Survey microdata, 2010-2014.3
Low Representation in the Nation’s Fastest Growing FieldsIn an analysis of the 137 detailed majors, African Americans who majored in pharmacy, pharmaceutical sciences,and administration have the highest median earnings at 84,000 (Table 2). Industrial/manufacturing, chemical,electrical, mechanical, computer, and civil engineering graduates follow, with median earnings ranging from 68,000 to 76,000.Table 2. National top 10 median earnings for African Americans with Bachelor’s degrees, ranked by highest tolowest earnings (with percentage African American)Detailed MajorMedian Earnings† ( )Percentage African American (%)Pharmacy, Pharmaceutical Sciences, and Administration84,0006Industrial and Manufacturing Engineering76,0005Chemical Engineering73,0005Electrical Engineering72,0006Mechanical Engineering72,0003Computer Engineering69,0005Civil Engineering68,0003Nursing66,00010General Engineering66,0008Computer Science65,0008Bachelor’s degree holders refer to adults between the ages of 21 and 59 with a Bachelor’s degree but no graduate degree. Earnings data are reported for workers employedfull-time, full-year. Source: Georgetown University Center on Education and the Workforce analysis of U.S. Census Bureau, American Community Survey microdata, 2010-2014.†Earnings at the 50th percentile, ages 25–59Table 3. National bottom 10 median earnings for African Americans with Bachelor’s degrees, ranked by lowest tohighest earnings (with percentage African American)Detailed MajorMedian Earnings† ( )Percentage African American (%)Early Childhood Education38,00010Human Services and Community Organization39,00020Area, Ethnic, and Civilization Studies39,0009Family and Consumer Sciences40,0008Drama and Theater Arts40,0005Miscellaneous Industrial Arts and Consumer Services40,0007Social Work41,00019Physical Fitness, Parks, Recreation, and Leisure41,0008Theology and Religious Vocations41,00011Philosophy and Religious Studies42,0006Bachelor’s degree holders refer to adults between the ages of 21 and 59 with a Bachelor’s degree but no graduate degree. Earnings data arereported for workers employed full-time, full-year. Source: Georgetown University Center on Education and the Workforce analysis of U.S.Census Bureau, American Community Survey microdata, 2010-2014.†4Earnings at the 50th percentile, ages 25–59
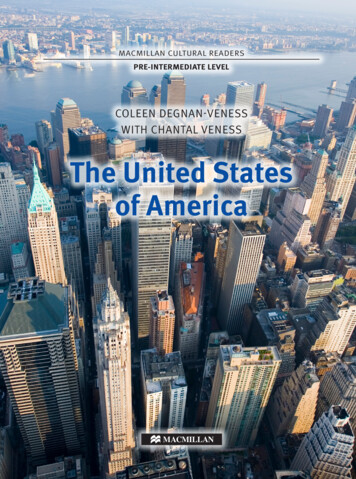
African Americans who majored in early childhood education have the lowest median earnings at 38,000 (Table3). Most of the majors on the list of lowest median earnings for African Americans with Bachelor’s degrees tend tobe part of intellectual and caring professions - that is, highly-educated workers whose earnings tend not to reflecttheir years of higher education.African Americans are most represented in health and medical administrative services, where they account for 21percent of terminal Bachelor’s degrees (Table 4). Human services and community organization has the secondhighest percentage of African Americans, and the second-lowest median earnings. In short, African Americans tendto be better represented in majors with the lowest earnings. The 10 detailed majors with the highest percentage ofAfrican Americans (Table 4) consist entirely of majors associated with earnings lower than 65,000.Table 4. African Americans tend to be over-represented in low-earning majors, ranked by percentage of AfricanAmericans (with median earnings)Percentage African American (%)Median Earnings† ( )Health and Medical Administration Services2146,000Human Services and Community Organization2039,000Social Work1941,000Public Administration1752,000Criminal Justice and Fire Protection1548,000Sociology1444,000Computer and Information Systems1463,000Human Resources and Personnel Management1451,000Interdisciplinary Social Sciences1344,000Pre-Law and Legal Studies1346,000Detailed MajorBachelor’s degree holders refer to adults between the ages of 21 and 59 with a Bachelor’s degree but no graduate degree. Earnings data are reported for workers employedfull-time, full-year. Source: Georgetown University Center on Education and the Workforce analysis of U.S. Census Bureau, American Community Survey microdata, 2010-2014.†Earnings at the 50th percentile, ages 25–59ConclusionAfrican Americans who choose majors in well-paying, growing fields are likely to be better positioned to gethigher paying jobs. This is especially important to a demographic group that historically has been deprived ofopportunities and had fewer economic assets and resources making them especially vulnerable to the familystress created by economic ups and downs. Fewer African Americans in high-paying jobs can translate to fewerpositive role models of how to be financially successful for younger generations and fewer opportunities tocontribute economically to their family and community. Careful career planning is especially crucial for AfricanAmerican students to help them avoid debt and underemployment later in life.5
APPENDIX. ALL MAJORS BY GROUP FOR AFRICAN AMERICANS WITH BACHELOR’S DEGREESBY MEDIAN EARNINGS AND DEGREE CONCENTRATIONMajors fall into two categories:1. Grouped majors are the family of specific majors.2. Detailed majors, reflect a specialization of study.For example, Nutrition Sciences, Pharmaceutical Sciences, and Nursing,these are all specific majors under the larger grouping of Health majors.Median Earnings† ( )Agricultural and Natural Resources45,000General iencesNursingPercentage African American (%)Current2009Difference633Architecture and Engineering56,000Miscellaneous Engineering Technologies912-355,000Industrial Production Technologies89-166,000General Engineering87172,000Electrical Engineering66073,000Chemical l and Manufacturing Engineering59-472,000Mechanical Engineer33068,000Civil Engineering33043,000Music76140,000Drama and Theater Arts55043,000Commercial Art and Graphic Design55045,000Fine Arts45-1990ArtsBiology and Life Sciences47,000BiologyBusiness51,000Human Resources and Personnel Management1413151,000Business Management and Administration1210253,000Miscellaneous Business and Medical Administration107352,000General Business98163,000Management Information Systems and Statistics99056,000Accounting88053,000Operations, Logistics, and E-Commerce77057,000Finance76148,000Marketing and Marketing Research77044,000Hospitality Management642Bachelor’s degree holders refer to adults between the ages of 21 and 59 with a Bachelor’s degree but no graduate degree. Earnings data are reported for workers employed full-time, fullyear. Detailed majors with less than 100 observations are not included in this analysis. Source: Georgetown University Center on Education and the Workforce analysis of U.S. Census Bureau,American Community Survey microdata, 2010-2014 and Carnevale, Strohl, and Melton, What’s It Worth?, 2011.†6Earnings at the 50th percentile, ages 25 – 59
Appendix. All Majors by Group for African Americans with Bachelor’s Degreesby Median Earnings and Degree ConcentrationMedian Earnings† ( )Communications and JournalismPercentage African American (%)Current2009Difference47,000Communications and Mass Media99046,000Journalism77047,000Advertising and Public Relations660Computer and Information Systems1413161,000Information Sciences1112-153,000Miscellaneous Computer9----65,000Computer Science89-1Computers, Statistics, and r Engineering54151,000Miscellaneous Education1110138,000Early Childhood Education1010047,000Physical and Health Education Teaching97244,000General Education99048,000Special Needs Education78-145,000Secondary Teacher Education56-144,000Elementary Education55047,000Language and Drama Education54144,000Art and Music Education44046,000Health and Medical Administrative Services2118350,000Miscellaneous Health Medical Professions1010066,000Nursing109184,000Pharmacy, Pharmaceutical Sciences, and Administration65149,000Treatment Therapy Professions660EducationHealthHumanities and Liberal Arts43,000Multi/Interdisciplinary Studies12----41,000Theology and Religious Vocations1112-139,000Area, Ethnic, and Civilization Studies98146,000Liberal Arts97246,000English Language and Literature66042,000Philosophy and Religious Studies66047,000History55044,000French, German, Latin, and Other CommonForeign Language Studies440Bachelor’s degree holders refer to adults between the ages of 21 and 59 with a Bachelor’s degree but no graduate degree. Earnings data are reported for workers employed full-time, fullyear. Detailed majors with less than 100 observations are not included in this analysis. Source: Georgetown University Center on Education and the Workforce analysis of U.S. Census Bureau,American Community Survey microdata, 2010-2014 and Carnevale, Strohl, and Melton, What’s It Worth?, 2011.†Earnings at the 50th percentile, ages 25 – 597
Appendix. All majors by group for African Americans with Bachelor’s Degreesby Median Earnings and Degree ConcentrationMedian Earnings† ( )Industrial Arts, Consumer Services, and RecreationPercentage African American (%)Current2009Difference40,000Family and Consumer Sciences88041,000Physical Fitness, Parks, Recreation, and Leisure88040,000Miscellaneous Industrial Arts and Consumer Services7----61,000Transportation Sciences and Technologies56-1Law and Public Policy52,000Public Administration1718-148,000Criminal Justice and Fire Protection1514146,000Pre-Law and Legal Studies1314-1Physical Sciences52,000Multidisciplinary or General Science1110149,000Chemistry871Psychology and Social Work39,000Human Services and Community Organization2021-141,000Social Work1916343,000Psychology1091Social y Social Sciences139449,000General Social Sciences1313046,000Criminology109150,000Political Science and Government98155,000Economics660Bachelor’s degree holders refer to adults between the ages of 21 and 59 with a Bachelor’s degree but no graduate degree. Earnings data are reported for workers employed full-time, fullyear. Detailed majors with less than 100 observations are not included in this analysis. Source: Georgetown University Center on Education and the Workforce analysis of U.S. Census Bureau,American Community Survey microdata, 2010-2014 and Carnevale, Strohl, and Melton, What’s It Worth?, 2011.†8Earnings at the 50th percentile, ages 25 – 59
African AmericansCollege Majors and Earnings Prevalence of African-AmericanBachelor’s Degree HoldersAfrican Americans tend to be overrepresented in low-earning majorsTop 10 Majors by Percentage of African-American Bachelor’s Degree Holders1 – Health and Medical Administration Services, 21%6 – Sociology, 14%2 – Human Services and CommunityOrganization, 20%7 – Computer and Information Systems, 14%3 – Social Work, 19%8 – Human Resources and PersonnelManagement, 14%4 – Public Administration, 17%9 – Interdisciplinary Social Sciences, 13%5 – Criminal Justice and Fire Protection, 15%10 – Pre-Law and Legal Studies, 13%African Americans who majored in pharmacy, pharmaceutical10 Highest-Earnings Majorsfor African Americans 84,000 76,000Pharmacy,Industrial andPharmaceutical ManufacturingSciences, andEngineeringAdministrationsciences, and administration have the highest median earningsat 84,000. 73,000 72,000 72,000 69,000 68,000 66,000 66,000 ngNursingGeneralEngineeringComputerScienceMost of the majors on the list of lowest median earnings for AfricanAmericans with Bachelor’s degrees tend to be part of intellectual andcaring professions - that is, highly educated workers whose earningstend not to reflect their years of higher education.10 Lowest-Earnings Majorsfor African Americans 38,000 39,000 39,000Early Childhood Human Services Area, Ethnic,Educationand Community and CivilizationOrganizationStudies 40,000 40,000 40,000Family andConsumerSciencesDrama andTheater ArtsMiscellaneousIndustrial ArtsAnd ConsumerServices 41,000Social Work 41,000PhysicalTheologyFitness, Parks, and ReligiousRecreation, andVocationsLeisureBachelor’s degree holders refers to adults between the ages of 21 and 59 with a Bachelor’s degree but no graduate degree. Earningsdata are reported for workers employed full-time, full-year. Source: Georgetown University Center on Education and the Workforceanalysis of U.S. Census Bureau, American Community Survey micro data, 2010-2014.To view the research this graphic is based on, download African Americans: College Majors and Earnings. 41,000 42,000Philosophyand ReligiousStudies
African Americans: College Majors and EarningsACKNOWLEDGEMENTSWe would like to express our gratitude to the individuals and organizations whose generous support has made thisreport possible: Lumina Foundation (Jamie Merisotis and Holly Zanville), The Bill & Melinda Gates Foundation (DanielGreenstein and Jennifer Engle) and The Joyce Foundation (Matthew Muench). We are honored to be partners in theirmission of promoting postsecondary access and completion for all Americans.Many have contributed their thoughts and feedback throughout the production of this publication. We are grateful for ourtalented designer, Tim Duffy and meticulous editorial advisor Tracy Thompson, whose tireless efforts were vital to our success.In addition, the dedication of Georgetown CEW’s economists, analysts, writers, communications team, and operations staffwere instrumental to production of this report, from conceptualization to completion: Jeff Strohl - research direction Hilary Strahota, Vikki Hartt – communications efforts Joe Leonard, Coral Castro – logistics and operationsThe views expressed in this publication are those of the authors and do not necessarily represent those of Lumina Foundation, theBill & Melinda Gates Foundation, the Joyce Foundation, or their officers or employees.Reprint PermissionThe Center on Education and the Workforce carries a CreativeCommons license, which permits non-commercial re-use of any ofour content when proper attribution is provided.You are free to copy, display, and distribute our work, orinclude our content in derivative works, under the CEW’sfollowing conditions:Attribution: You must clearly attribute the work to theCenter on Education and the Workforce and provide aprint or digital copy of the work to cewgeorgetown@georgetown.edu.Our preference is to cite figures and tables as follows:Source: Georgetown University Center on Education and theWorkforce, “African Americans: College Majors and Earnings.”10Noncommercial: You may not use this work forcommercial purposes. Written permission must beobtained from the owners of the copy/literary rights andfrom Georgetown University for any publication orcommercial use of reproductions.Approval: If you are using one or more of our availabledata representations (figures, charts, tables, etc), pleasevisit our website at cew.georgetown.edu/publications/reprint-permission for more information.For the full legal code of this Creative Commons license, please visitcreativecommons.org.Should you need a form to be filled out by us, please emailcewgeorgetown@georgetown.edu and we will respond in atimely manner.
African Americans: College Majors and Earnings can be accessed online atcew.georgetown.edu/africanamericanmajors.The Georgetown UniversityCenter on Education and the Workforce3300 Whitehaven Street, NW, Suite 3200Washington, D.C. 20007
The college major, which has critical economic consequences throughout life, reflects personal choices but . African Americans account for only 8 percent of general engineering majors, 7 percent of mathematics majors, . 2. Detailed majors