Transcription
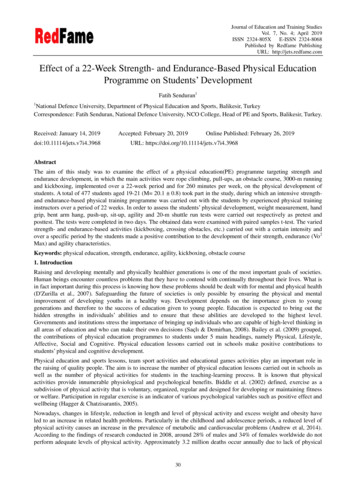
Strength Change Investigation of the Presumpscot Clay FormationA. SantamariaSanborn Head & Associates, Westford, MAN. BradleyVirginia Tech, Blacksburg, VAJ. BenoîtUniversity of New Hampshire, Durham, NHABSTRACT: The Presumpscot Formation is a soft to very soft sensitive marine clay deposit that isfound along the New Hampshire and Maine Seacoast areas. The deposit varies in thickness but itsgeotechnical properties are overall very similar from location to location. Numerous studies usingvarious in situ geotechnical tests such as the field vane, the piezocone and the flat plate dilatometer haverevealed a strength shift at depth with regards to the undrained shear strength profile. The studies,dating back to the construction of the I-95 Interchange in the mid to late-60’s, conducted in coastal areasof New Hampshire (Portsmouth, Dover and Newington) and Maine (South Portland) all show a sharpreduction in shear strength at depth followed by a gradual increase nearly parallel to the upper clayportion. A strength change of such significant magnitude is unusual and appears to be a regional changethat may exist at a common point in geologic time rather than at a specific depth or elevation. Usingspecimens collected in Dover, NH across the zone depicting the strength change, laboratory tests usinglaser light scattering techniques were used to evaluate particle size distributions. X-Ray diffractionanalyses were also used to evaluate the clay mineralogy. This paper presents the field and laboratoryresults at the various sites. The results from the particle size analyses showed clear evidence ofsignificant differences in soil composition in terms of silt and clay fractions above and below the changein undrained shear strength. Possible explanations for the discrepancy include sea level changes, partialerosion of the Presumpscot clay formation or occurrence of a significant seismic event.1 INTRODUCTION1.1 BackgroundThe New Hampshire Department ofTransportation (NHDOT) began studies for aroad network expansion in 2003 known as theSpaulding Turnpike Newington-Dover Project(Figure 1). The purpose of this project was toimprove mobility and safety along the SpauldingTurnpike (Rt. 16) between Exit 1 and the tollplaza north of Exit 6 (NHDOT, 2009). Theinterchanges, geometry, and capacity of theexisting roadways within this stretch of theturnpike were found to be insufficient to meet thecurrent and future needs of the region. Theproject involves the addition of travel lanes ineach direction, the widening and rehabilitation ofthe Little Bay Bridges, the elimination andreconfiguration of interchanges, and various otherimprovements.At the Exit 6 interchange, the NHDOTreconfigured the on ramp from Route 4 onto theSpaulding Turnpike/Route 16 South. Thisinterchange was underlain by an approximate 50foot thick layer of blue clay which is part of thePresumpscot Formation. Extensive testing wasperformed to evaluate the compressibility of thisclay. Field tests including piezocone (CPTu),dilatometer (DMT), and field vane (FVT) wereconducted at various locations. UndisturbedShelby tube samples were obtained using a pistonsampler, and one-dimensional consolidation testswere performed on specimens obtained fromthese cores.2015 Symposium on the Presumpscot Formation, Portland, ME1
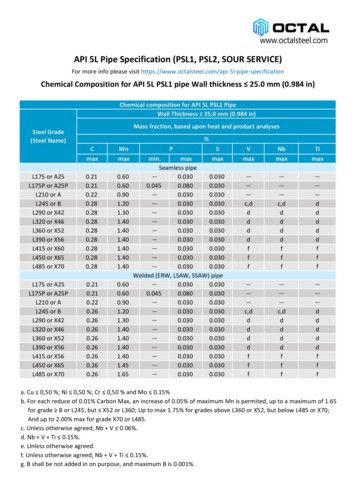
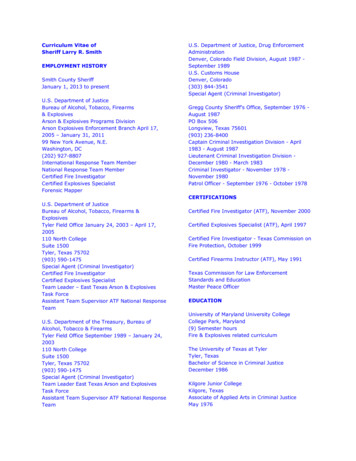
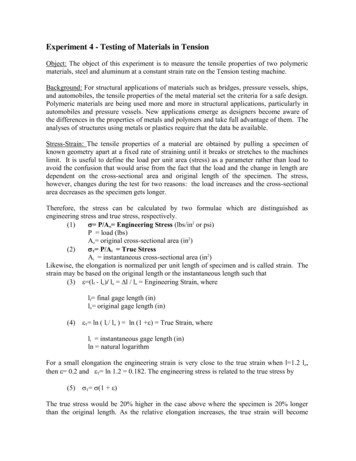
UNH (1997)ScammellBridge Sitedeposited during the retreat of the NorthAmerican ice sheet. Beginning between 65 and70 feet below ground surface is the clay of thePresumpscot formation, which exists from the topof the till layer up to approximately 10 foot depth,which is then covered by silty sand up to theground surface. The natural water content isoften near or above the liquid limit which istypical of this marine sensitive clay deposit.NHDOT11238-M Site2 REVIEW OF PREVIOUS WORK2.1 Initial findingsLadd (1972)Portsmouth SiteFindlay (1991)Pease Air ForceBase SiteFigure 1. T Geotechnical Test EmbankmentDover, NH01010020-10-2040-3050-4060Elevation (ft)Depth (ft)30-5070PLmax LLmax-6080-709002040Moisture (%)60 80 100 120 140 0Total Unit Weight (pcf)NHDOT wQ-B212 Sta. 603 29, LT 1 wNHDOT Atterberg Limit Range400 800 1200Su (psf)Q-B214 (Sta. 603 15, CL)UndisturbedQ-B214 (Sta. 603 15, CL)RemoldedFigure 2. Profile of field vane test results with laboratoryindex properties at Newington-Dover Project test site.The stratigraphy of the site at Exit 6 in Doveras shown in Figure 2 correlates well to thegeologic history of the NH Seacoast. Bedrock isoverlain by a layer of glacial till that was likelyThis study originated from findings of an unusualstrength shift observed at the Exit 6 site in Dover,NH. This shift had also been seen at several othertest sites around the NH Seacoast (Ladd, 1972;Findlay, 1991; UNH, 1997) and in SouthPortland, ME (Roche et al., 2008). Figure 3shows a soil profile and properties generated byLadd (1972) for comparison with results shownon Figure 2. Field vane (FVT), flat platedilatometer (DMT) and piezocone (CPTu) testswere conducted through the entire depth of thePresumpscot clay. The data obtained from thesetests was used in part to determine the undrainedshear strength (Su) of the soil.Field vane profiles were conducted using aGeonor H-10 Vane Borer and tests were carriedout at approximately 3-foot intervals in the clay.DMT profiles were conducted at 0.5-footintervals, and CPTu profiles were conducted“continuously” with a 2 cm/s advance rate, usinga digital Hogentogler 10 ton piezocone. All datawas obtained under free field conditions.The results in terms of undrained shearstrengths can be seen in Figure 4. The field vanedata represents the peak strength values. Thepiezocone data shown was obtained from twoseparate boreholes spaced approximately 11 feetapart. The DMT data reflects a profile performedin close proximity to the FVT and CPTu tests.At approximately 50 feet below the groundsurface, a significant reduction in values ofundrained shear strength can be observed,regardless of the test method. Across the strengthchange at approximately 50 feet, the peak FVTstrength indicates a reduction of about 25%.Undrained shear strengths obtained from thepiezocone and the flat plate dilatometer were2015 Symposium on the Presumpscot Formation, Portland, ME2
Figure 3. Soil profile, index properties and field vane strengths at experimental test section (Ladd, 1972).empirically derived and shifted to match the peakfield vane values. The CPTu strength decreasedby approximately 15% while the DMT resultsindicate a 20% reduction in strength at the 50 foottransition zone.2.2 Purpose of studyA typical profile of undrained shear strength innormally to slightly overconsolidated claysusually shows a gradual increase with depth. Atthe site, all in situ test results seem to indicate asharp reduction in strength at an approximatedepth of 50 feet suggesting some sort of anomalyor changes in stratigraphy. Once below thisapproximate depth, the strength again increaseslinearly with depth.A strength change of such significance appearsto be unusual for this deposit. If such a drasticdecrease in strength occurs at this location in thePresumpscot Formation, then it would bereasonable to assume that the change is alsogeographically manifested elsewhere in theformation. Strength data was compiled from othersites around the Seacoast of New Hampshire andcoastal Maine, and a strength decrease was alsoobserved at those other locations (Ladd, 1972;Findlay, 1991; UNH, 1997; Roche et al., 2008).Figure 4. Undrained shear strengths from in situ testing atNewington-Dover Project test site.2015 Symposium on the Presumpscot Formation, Portland, ME3
The decrease in strength at the various sites varyfrom about 16 to 25 % and occurs at varyingdepth relative to sea level.The regional pattern of reduction in Su at depthis clear but there is no common elevation atwhich the strength reduction occurs. It is morereasonable to theorize that the discontinuities inthese strength profiles originate from a commonpoint in geologic time. If there is a fundamentalchange in the strength properties of the clay at acertain time during its deposition, then someother properties of the soil may also reflect therelative change.3 TESTING PROGRAM3.1 Methods for analysisThe change in strength at the 50 foot depth at theNewington-Dover test site is not visuallyobservable from undisturbed samples obtainedabove and below that depth. Particle size analysiswas undertaken to determine whether thefundamental change in the properties of the claycould be observed at the particle level. Inaddition, X-ray diffractometer (XRD) analysiswas performed to investigate the mineralogypresent in the clay both above and below thestrength shift. Any significant changes in theparticle size distribution or clay mineralogy of theclay could provide clues for the observed changein undrained shear strength of the Presumpscotclay.Specimens were obtained through the fulldepth of sampling at approximately every 5 feet.Specimens were procured by removing 1 inch ofShelby tube at the chosen depth. Only the middleportion of the soil obtained from this inch of corewas used for testing. The soil closest to the innerwall of the Shelby tube was discarded due topotential smearing effects. After sampling,specimens were sealed in plastic containers andstored at 4 degrees Celsius.3.2 Particle size analysisParticle size analyses were completed on each testspecimen. Analysis was carried out using aMalvern Instruments Mastersizer 2000, whichuses laser light scattering techniques to measurethe particle size distribution of specimens. TheMastersizer measures particle sizes by volume.That is, the laser is scattered by the particles insuspension and the Mastersizer software returnsparticle sizes grouped into many pre-definedparticle size categories. These are used todevelop a volume-weighted particle sizedistribution.To prepare a specimen for testing,approximately 1 cubic centimeter of moist soilwas placed in a test tube and covered in 20 mL ofthe dispersant Calgon. The soil was immediatelymixed with the Calgon to form a suspension andthen allowed to soak for 24 hours. After 24 hoursof soaking with dispersant, the soil suspensionwas agitated once more to disperse particles thathad settled. The mixture was placed into theMastersizer’s dispersion unit immediately afterdispersion and distilled water was added until theobscuration of the laser reached an acceptablerange. The unit maintains a constant internalvolume, so when distilled water is added, a smallportion of the specimen is lost as waste.However, the particle size distribution should notbe affected by specimen loss because thesuspension is continually mixed by theMastersizer, meaning that equal amounts of allparticle sizes should be lost when some specimenis released from the machine.3.3 X-ray diffractionAn X-ray diffractometer (XRD) makes twomeasurements: the angle an X-ray beam makeswhen reflected off the atoms within a crystallinestructure, and the intensity of X-ray captured atthe reflected point. At certain angles thediffraction receptor will detect reflected X-rays,measure their intensity, and processes the datawhich is uploaded to a computer monitoringdevice in the form of a graph. The graph plots thediffraction intensity over the range of 2θpredefined by the user and is then compared withpreloaded known mineral standards. Generally,matching of high peaks indicates a match of themineral; however this procedure works best forpure mineral crystals of uniform size.2015 Symposium on the Presumpscot Formation, Portland, ME4
XRD was conducted on two test specimensfrom above and below the approximate point ofinterest of 50 ft below the ground surface. The T10 and T-12 specimens represent soil fromapproximate depths of 45.5 feet and 55.5 feet,respectively in an attempt to compare mineralogyabove and below the strength shift.X-ray diffractometer analysis requires thespecimen to be dry; therefore, samples were airdried and broken down into marble size clods andpulverized in a grinding chamber. The finepowder was placed on an aluminum flat plate foranalysis.4 TEST RESULTS4.1 Particle size analysis resultsTwo replicates of particle size analysis wereconducted on each specimen using theMastersizer. The results of the two replicatesshowed good agreement (Figure 5). At nearlyevery depth, the median particle size obtained inthe first replicate is within one micrometer of thatobtained in the second replicate run. Medianparticle sizes range from approximately 7 to 95micrometers (medium silt to fine sand size).The median particle sizes obtained fromspecimens below the depth of the strength changeare greater than those above the strength change.The average median particle size of the first fivespecimens above the strength change (25.3-45.4ft) is 9.03 and 8.51 μm, respectively for Runs 1and 2. The average median particle size of thefirst three specimens below the strength change(50.5-60.6 ft) is 12.27 and 13.68 μm, respectivelyfor Runs 1 and 2. One-sided heteroscedastic(two-sample unequal variance) Student’s t-Testswere conducted on the data obtained in Runs 1and 2 to determine if the median particle sizesbelow the strength change are significantlygreater than those above the strength change. TheP-values obtained from Runs 1 and 2 are,respectively, 0.0577 and 0.0396. Therefore, at asignificance level of 0.05, the median particlesizes below the strength change are likely greaterthan those above the strength change.It is also desirable to determine whether or notthere is significant variation in one or moreparticle classes (clay, silt, sand) across thestrength change. Thus, the clay, silt, and sandFigure 5. Plot of median particle size vs. depth using laserlight scattering.fractions of each specimen were determinedbased on both the Udden-Wentworth and theISO/CEN & CFEM classification systems (AlHussaini, 1977). The particle class fractions forRun 1 are plotted in Figures 6 and 7 for eachclassification system.The Udden-Wentworth classification systemdivides clay and silt at a particle size of 4micrometers and divides silt and sand at a particlesize of 63 micrometers. The variation of clay,silt, and sand fractions with depth can be seen inFigure 6. Below the strength change depth, thereis a higher fraction of silt than in the specimensabove the strength change. The clay fraction isnoticeably lower in specimens below the strengthchange compared with those above.P-values obtained from these tests are allbelow a 5% significance level. So, there isevidence to suggest that the clay fraction is lowerand the silt fraction is higher in the soil below thestrength change.ISO/CEN and CFEM scales define the clay/siltboundary at 2 micrometers and the silt/sandboundary at 60 micrometers. The variation ofclay, silt, and sand fractions with depth for theseclassification systems can be seen in Figure 7. Ina similar manner to the Udden-Wentworthparticle type fractions, the clay fraction appears tobe lower and the silt fraction appears to be higherin the specimens tested below the strengthchange.The results of one-sided heteroscedasticStudent’s t-Tests on the ISO/CEN and CFEM2015 Symposium on the Presumpscot Formation, Portland, ME5
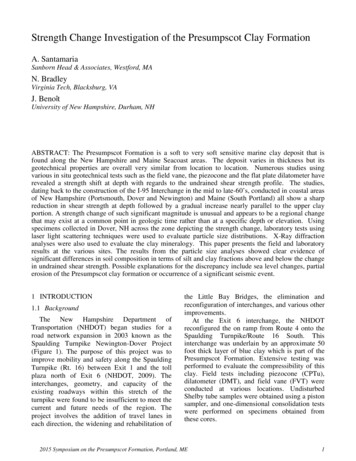
Figure 6. Plot of Udden-Wentworth Scale particle classfraction vs. depth.Figure 7. Plot of ISO/CEN and CFEM Scale particle classfraction vs. depth.particle type fractions show similar results thanfound for the Udden-Wentworth system. Themean of the first three specimens below thestrength change (T-11 to T-13) is being comparedto the mean of the five specimens directly abovethe strength change (T-6 to T-10). Three out offour of the P-values obtained from the t-tests arebelow the 5% significance level. Therefore, thereis evidence from the ISO/CEN and CFEMclassification systems to suggest that there is ahigher silt fraction and lower clay fraction in thesoil below the strength change compared to thesoil above the strength change.between 5 and 50; therefore, this range served asthe window of interest for mineral identification.The XRD results indicate the two clay samplestaken from T-10, shown in green, ( 45 ft belowground surface) and T-12 shown in black ( 55 ftbelow ground surface), are nearly identical incomposition with minor differences.For comparison, the XRD results for T-10 aresuperimposed on top of T-12 in Figure 8. Visualobservation shows the similar peak intensities atthe same respective 2-theta values, indicating thetwo samples exhibit the same crystallinestructures. Comparing the results to knownmineral standards preloaded into the software, thehigh peaks indicate a best fit with an illitecrystalline structure. Most peaks match up withthe illitic fingerprint; however, additional peakscan be observed.Numerous peaks that do not match with theillite standard indicate the sample is not purelyillitic in structure. Ultimately, more minerals arepresent within the clay sample. Comparing the 2-4.2 X-ray diffraction resultsX-ray diffraction results are plotted in Figures 8and 9. The 2 graphs plot intensity in units ofcounts over a range of two theta. In thisexperiment a 2θ range from 5-80 was used with arate of two samples per second. The majority ofthe peaks detected were observed in 2θ values2015 Symposium on the Presumpscot Formation, Portland, ME6
theta values with quartz and albite (feldspar)standards (Table 1) appears to accommodate thepreviously unexplained peaks. By this analysis,quartz and feldspar are likely to be present in theclay. Small amounts of muscovite andchlinochlore were also observed (Figure 8).To confirm the sample is primarily composedof Illite, Figure 9 compares T-12 data to aprevious study on an illitic clay sample and theillite standard. The composition matches wellwith the previous study with the exception of ahigh peak intensity at 26.6 two theta. Thedifference in intensity between the T-12 peak and100% peak for the Illite standard can be assumedto be the intensity super-positioning from thequartz mineral diffraction (Table 1).Any differences between T-10 and T-12 can beattributed to possible error in sample preparation.Variability in sample size and discrepancies in thesample surface from one specimen to the otherare two common issues that can affect thediffraction of X-rays, disturbing the level ofintensity detected.Table 1: Mineral standard percent peaks and correspondingtwo theta values for XRDMineralPeak 51Quartz10026.65Albite10028.02Figure 8. Contrast of T-10 and T-12 results compared with preloaded standard for Illite (magenta) and chlinochlore (blue)clay minerals Note: T-10 (green) is superimposed on top of T-12 (black) for visual observation and comparison.2015 Symposium on the Presumpscot Formation, Portland, ME7
Figure 9. Contrast of T-12 test (black), with previous illitic clay test (magenta), and compared with preloaded standard forIllite (indicated by vertical magenta lines)4.3 Conclusions and future workThe results of testing with the Mastersizershowed that there is evidence of a significantdifference in soil composition above and belowthe change in undrained shear strength at 50 feetdepth. Higher silt fractions and lower clayfractions could well correlate to lower undrainedstrength compared with overlying soil thatcontains higher clay fractions and lower siltfractions. Certainly, more analyses at smallerdepth intervals are needed to provide moreevidence for these findings, but these test resultsprovide a possible preliminary compositionalexplanation for the strength change.The two soil samples tested using X-raydiffraction are composed of the same mineralmakeup and appear to be illitic clay with traceamounts of quartz, albite (feldspar), andmuscovite. Therefore, clay mineralogy has noinfluence on the strength change exhibited in theclay at 50 ft below the ground surface at theDover-Newington site; however, more extensivetesting should be considered to establishmineralogy presence throughout the entireprofile. The composition found from X-raydiffraction suggests the clays are indeed part ofthe Presumpscot Formation.Another possible explanation for the existenceof the strength change involves the geologichistory of the deposition of the clay. The sealevel lowstand during deposition of thePresumpscot Formation is of particular interest inthis regard. Birch (1984) and Oakley (2000) eachstate that during the sea level lowstand, thesurface of the Presumpscot was exposed to the airand erosion occurred, producing an unconformityat the top of the formation. Oakley also states thatstudies conducted at New Meadows River in midcoast Maine showed an unconformity betweenthe erosion surface of the Presumpscot and alayer of Holocene-era mud. Perhaps the locationof the strength change could be correlated withthe erosion surface of the Presumpscot. Futurework could include an effort to correlate theregional strength data with mean sea level anddate specimens from cores to determine if thestrength change exists at elevations and time2015 Symposium on the Presumpscot Formation, Portland, ME8
period that coincide with the end of thePresumpscot deposition.The existence of the strength change could alsobe attributed to a significant seismic event. Aseismic event could have liquefied or otherwisereduced the strength of the clay beneath theelevation of the strength change and then overtime, the soil gradually regained strength due tothe deposition of the overlying soil, thixotropiceffects, cementation, or other causes. Irrespectiveof the potential explanations for the existence ofthis regional strength anomaly, it is clear thatmuch more research must be conducted beforeany confidence may be placed in any one theory.4.4 AcknowledgmentsThe support from the New HampshireDepartment of Transportation under contract11238-Q to evaluate the behavior of theNewington-Dover Test Embankment is greatlyappreciated. Samples used to perform the studydescribed in this paper were obtained as part ofthis contract.4.5 ReferencesAl-Hussaini, M. M. (1977). “Contribution to theEngineering Soil Classifications of CohesionlessSoils,” Final Report, Miscellaneous Paper S-77-21,U.S. Army Engineer Waterways ExperimentStation, Vicksburg, MS, 61 p.Birch, F.S. (1984). A Geophysical Study ofSedimentary Deposits on the Inner ContinentalShelf of New Hampshire: Northeastern Geology, v.6, pp. 206-221.Getchell, A. (2013). “Geotechnical Test Embankmenton Soft Marine Clay in Newington-Dover, NewHampshire.” Thesis Presented in PartialFulfillment of the Requirements for the Master ofScience Degree, University of New Hampshire,Durham, New Hampshire.Getchell, A., Santamaria, A.J. and Benoît, J. (2014)."Geotechnical Test Embankment Dover, NewHampshire NHDOT Project Newington-Dover11238-M In Situ and Laboratory Testing".Concord, NH: NHDOT.In Situ Geotechnical Course: CIE 961 (1997). “FieldVane and Dilatometer Testing, Scammell BridgeSite, Dover, NH. Report prepared by Stetson, K.P.and Hill, A., University of New Hampshire, 44 p.Ladd, C. C. (1972). “Test Embankment on SensitiveClay.” Proceedings of the Specialty Conference onPerformance of Earth and Earth-SupportedStructures: Part I, ASCE, 1, pp. 101-128.NHDOT (2009). Spaulding Turnpike NewingtonDover Project. New Hampshire Department ofTransportation. Web.Oakley, A. (2000). "Seismic and SedimentologicalCharacteristics of the New Meadows River, Midcoast Maine." Abstracts with Programs Geological Society of America 33.1 GeoRef.Roche, J., Rabasca, S. and Benoît, J. (2008) “In-SituTesting of Soft Sensitive Marine Clay for aLandfill Expansion Study”, Proceedings of theThird International Conference on Geotechnicaland Geophysical Site Characterization ISC-3,Taipei, Taiwan, April 1-4, pp. 517-522.Bradley, N. (2013). “Preliminary Study of StrengthChange in Presumpscot Formation in Dover Point,Dover, New Hampshire.” Thesis Presented inPartial Fulfillment of the Requirements for theBachelor of Science Degree, University of NewHampshire, Durham, New Hampshire.Findlay, R. C. (1991). “Use of the 9-Arm Self-BoringPressuremeter to Measure Horizontal In SituStress, Stress Anisotropy, and Stress-StrainBehavior in Soft Clay.” Thesis Presented in PartialFulfillment of the Requirements for the Doctor ofPhilosophy Degree, University of New Hampshire,Durham, NH, 430 p.2015 Symposium on the Presumpscot Formation, Portland, ME9
2015 Symposium on the Presumpscot Formation, Portland, ME 2. Figure 1. Locations of New Hampshire Seacoast investigations. Figure 2. Profile of field vane test results with laboratory index properties at Newington-Dover Project test site. rega. The stratigraphy of the site at Ex