Transcription
2016 Technology SurveyOlder Adults, Age 59-85 A 2016 Study Sponsored by Link ageIn cooperation with the Link age StakeholdersPrepared by Laurie M. Orlov, Founder and Principal AnalystAging in Place Technology WatchApril 2016
Who Should Read This Report?Technology platform providersTelecommunication carriersInvestors and entrepreneurs interested in the 65 marketBusinesses seeking to cater to an aging demographicService providers with an interest in serving older adultsMedia organizations that cover age-related issuesSocial service agencies and not-for-profits focused on seniorsGovernment agencies and policy makersGeriatric care managersCaregivers, seniors, and family members“I’m happy with my computer, doing e-mail, Facebook, and Google. Too late in life to goany further.” (Age 85 ) 2016 Link agePage 2
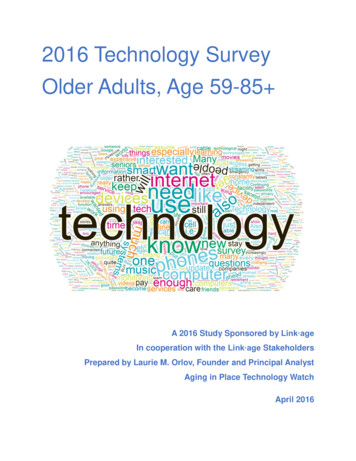
EXECUTIVE SUMMARYEvery year finds new reports published by research organizations based ondemographic segmentation. But these survey reports, from organizations like Nielsen,AARP and Pew Research, generally do limited sampling beyond age 65. Or theycombine what may be up to three or more decades of responders into a single segment.But we know that 65-year-olds and 85-year-olds have very different perspectives. Sostakeholders interested in the technology profile of the older decades have littleresearch to use to understand the needs of this population, whether they owntechnology products or whether they see their usefulness.Executive leadership of Link age in Mason, Ohio, saw the need to survey the older agedemographic in late Fall 2011. In 2012, another survey about the use of PERS deviceswas fielded to the same population, this time including online responders,that isreflected in Appendix I. And now in 2016, 401 older adults, in their 50’s up to age 85 ,completed an online survey about their ownership, usage, and interest in technology.Stakeholder organizations of Link age were the resource for reaching the participants inall three surveys.The 2016 Link age Technology Survey provides guidance to vendors and stakeholdersabout where seniors are today in terms of their varied utilization of technologies, theirinterest in having technologies they don’t currently own, and what they expect to pay forthem. Comments included in this document were free-form entries provided by theresponders. Their complete comments were also used to generate the word cloudpresented on the cover of the document.We are in a new world of growing longevity. For those living to age 65,average life expectancy for women is now 88.8 and for men, 86.6 – one-fourth of thosewill live past the age of 90. This is an era in which men and women aged 85 representthe fastest growing demographic. As in 2011, retailers, service providers, and productmanufacturers don’t understand enough about how our increasingly older adult societythinks and wants to interact with technology, as evidenced by the slow growth ofsmartphone usage among the oldest. The Link age Technology Survey expands theresearch library of resources that underpin decision-making by organizations servingour aging society. 2016 Link agePage 3
The Link age Survey 2016 Responders [n 401]Age59 or younger60 to 6465 to 6970 to 7475 to 7980 to 8485 or olderAnnual Income 0- 24.9K 25K- 49.9K 50K- 74.9K 75K Prefer not to answerHousingOwn a condo or houseRent an apartment, condo or houseOwn a condo or house in SLCAssisted living resident in SLCNursing care resident in SLC0%5%10% 2016 Link age15%20%Page 425%30%35%40%
Within the past few years, remarkable changes in technology have permeated society,driven by smaller, cheaper core technologies, slick designs, and must-have information,reinforcing the importance of the following:The Internet is a path to connections and engagement. Adequate accessto online information is a basic prerequisite to keeping up with change. The federalgovernment has encouraged individuals to apply for Social Security and Medicarebenefits online; and numerous coupons and discounts are only available online. TheInternet provides the ability to connect with family members, find new friends, locate ahealth care provider, learn about a new medical discovery, and buy lower-cost goodsand services online.Within the older age cohorts, access and interest is still limited butgrowing. Pew Research studies reinforce the digital dividing line for Internet access(regardless of device), finding that 50% of the 75 population indicated that they goonline. This represents a remarkable change over the past fifteen years, when 93% ofthose aged 75 were not online in 2000.Why not a greater percentageonline? The digital divide amongolder seniors is not surprising, giventhe complex process and cost toobtain: First, a senior must obtainboth an Internet service plan(average price 60/month) and arelatively current device: a PC, tabletor smartphone fast enough to usewith today’s graphics-rich websites. Itmust be customized for the user’sindividual needs. Training in deviceuse and ongoing support helpsnewcomers. A few senior-specialtyvendors simplify complexity withsenior-focused products or services,but most technology innovation isdesigned by the young for the young.Age 75 non-Internet usesince 74%77%78%82%88%88%89%93%93%Base 1157148213702771Figure 2Source: Pew Research as of April, 2015 2016 Link agePage 5
KEY FINDINGSLink age responders recognize technology benefits, but note issues.In addition to their greater tech adoption than those surveyed in 2011, the 401 individualLink age responders in 2016, which included 35 responders under the age of 60, hadconcerns about technology’s rapid pace of change, the baffling variety of device userinterfaces, and worries about privacy. Younger responders, as well as older, offeredskeptical observations:Communication wn itTabletInterested in itLaptopSmart TVNot interested in iteReader (such Internet Accessas a Kindle)WirelessNetworkDon't know enough about it to have an opinionFigure 3“Standardize, standardize, standardize.” (Age 70-74)“Big brother is coming.” (Age 60-64)“Technology is good and frightening to me.” (Age 65-69)“Many programs assume that I know what to do if my laptop brings me to a dead endwhen I am trying to access something new. I am quite old and new technologicalgadgets seem to be programmed by young people who grew up with computers and,consequently, assume that the user will know what to do when in a confusing situation.My friends often mention how frustrating this is.” (Age 85 ) 2016 Link agePage 6
The oldest responders are unimpressed with smartphones. Forcellphone versus smartphone, as age rises, ownership of smartphones drops. Thosewho commented voiced both hope and annoyance, and not just with their own devices –but the inattention of others using smartphones. Examination of the data showed thatthere are no statistically significant differences in smartphone ownership among any ofthe first 5 age bands ( 60 through 75 to 79). For further details see Appendix II.Phone type by age100%90%80%70%60%50%40%30%20%10%0%60 to 6465 to 6970 to 74Land lineCell phone75 to 7980 to 8485 and olderSmart phoneFigure 4“People who constantly swipe their smart phones are going to develop arthritis in theirthumbs from overuse, much younger than necessary, because the thumb is the firstjoint to be damaged.” (Age 80-84)“It’s the future.I have not wanted to be left behind.” (Age 85 )“Facebook, Twitter and Instagram are having negative effects on civility andaccountability.” (Age 85 )“I am learning technology as I need it according to the devices I buy, which issometimes daunting. Previously when you bought a device, instructions came with it.Now you have to buy instructions, i.e. Microsoft for Dummies.” (Age 75-79) 2016 Link agePage 7
About your %30.0%20.0%10.0%1.5%0.5%0.0%I have a land lineI own a cell phoneI own a senior-specific I own a smart phonecell phone (like a(like an Android orJitterbug)iPhone)I have no phoneFigure 5Landline ownership also does not depend on income level. Mostresponders have landlines and cell phones, with just over 40% owning a smartphone.There was no correlation between income and the retention of a land-line. 2016 Link agePage 8
“Love to get rid the landline.” (Age 70-74).Smartphone %0%Under 6060 to 6465 to 6970 to 7475 to 7980 to 8485 or olderFigure 6“Life is NOT a constant emergency. With navigation systems, no one has any ideawhere they are in relation to the world.” (Age 80-84)“Our smart phones (she has Galaxy, I have iPhone) give us a great deal of capacity.We're impressed how much can be done out of one hand-held device.” (Age 75-79)“In spite of all of the advances and advantages out there, it is virtually ruining ouryouths' manners. They always have their noses deep in their "smartphones." (Age 80 84) 2016 Link agePage 9
Tablet %20%10%0%Under 6060 to 6465 to 6970 to 7475 to 7980 to 8495%93%85 or olderFigure 7Internet 10%0%Under 6060 to 6465 to 6970 to 7475 to 7980 to 8485 or olderFigure 8Most have Internet access, tablets not so much. In 2011, only 33% reported havingInternet access – but in 2016, all but those aged 85 are online. Tablet ownership dropsoff at age 70 and in this survey, at least, has yet to catch the eye of the 85 .“Love it! I have 2 iPads, an iPhone, a MBP [Mac Book Pro] laptop, and two iMacs! Andan iWatch. They are all wonderful when they work. I try to stay up-to-date.” (Age 75-79)“You asked nothing about internet phones, which is what we have in lieu of a land line.We also have gigabyte internet service. We have an HD antenna and stream Netflix andAmazon Prime on our Smart TV. Your questions seem to assume a rather low level oftech awareness.” (Age 70-74) 2016 Link agePage 10
Television service by age80%70%60%50%40%30%20%10%0% 60Cable60 to 64Satellite65 to 6970 to 74Provided by community/condo75 to 79TV with antenna80 to 8485 No TV/serviceFigure 9For those with cable television, 36% own a house, another 37% own a condo or a homein a senior living community. Seventy-six percent of people with satellite own a condo ora house, but only 6% of those with a condo or a house reside in a senior livingcommunity. Of those with cable television, 82% also have a landline. For those withsatellite TV, only 67% have a landline. Younger individuals (60-69) are more likely tohave satellite, with the percentage dwindling to 2-4% at 70.“One key salient feature of internet vs cable is that I am in full control of what I watch. Iam on the national do not call list by choice, and report violators.” (Age 70-74) 2016 Link agePage 11
Family member/friend can pay for Yes, but I would not wantthem to do soFigure 10Benefits of communication technologiesLog on to my Social Security accountManage financial, retail accountsParticipate in online social interest forumsUse the Internet for news, entertainment andinformationRead and send email messagesView and send photographsPhone or video chat w/ family members0I do this50Interested100No interest150200250300350Don't knowFigure 11Older adults do not see their family members as the path to obtaining new technologies– or for that matter, asking them to use them. And as the updated version shows, healthand wellness technology use by older adults has yet to happen – not surprising,because the general population is not yet fully convinced of their benefit.1 2016 Link agePage 12
Health and wellnessCongestive Heart Failure (CHF) weight scale.Diabetes monitor.Internet-connected blood pressure cuff.Chronic disease management with nursemonitoring.Fitness tracker (counts steps with app)Fitness tracker (counts steps)050Do not know enough about it to give an opinion100150Not interested200250Interested in it300Own itFigure 12The survey responders indicated that they own fitness trackers, but no apps related tothe trackers – however it is an indicator of interest previously noted in the 2015 AARPresearch, with its recommendation about making fitness trackers more usable for olderadults.2 And as with the 2011 survey, most responders are unwilling to pay for healthand wellness technologies.3Willingness to pay for health and wellnessI already have it12.7% 100.0 or more / month0.3% 50.00 to 99.99 /month0.9% 30.00 to 49.99 / month0.9% 20.00 to 29.99 / month2.2% 10.00 to 19.99 / month4.3% 0.00 to 9.99 / month17.3%Nothing61.3%0%20%40%60%Figure 13 2016 Link agePage 1380%100%
OPPORTUNITIES FOR STAKEHOLDERSThe survey echoes conclusions in another AARP report, Healthy@Home from 2008 thatpreceded the growth of free, online applications – responders are not willing to pay forhealth and wellness technology.4Connected seniors see the benefits. For those seniors able to afford highspeed connections, Internet access links them to families, enables them to learn aboutand find resources, take advantage of streaming services, and enables them to shoponline – versus driving around -- for good deals. What should stakeholders do?Carriers should promote senior-friendly service plans. Having a senior-friendly planis a good start.5 Offering a plan to low-income seniors is progress. Promoting/marketingit, along with available (and free) training at point of purchase is better.6“Technology is the primary communication we use to stay connected with out-of-statefamily members. It's like living in the same town. I love knowledge websites like Googleand Wikipedia. Also streaming music sites and on line purchasing sites, especiallyAmazon.com. They're convenient and less expensive that retail stores for just aboutanything.” (Age 70-74)New device upgrades frustrate – training/support are enablers. Somecarrier and tech reseller organizations see a market for serving older populations andencouraging purchase of new smartphones – critically important because their youngermarket segments are saturated – and it is fast becoming a chore to get current ownersto purchase costly upgrades.7Publicize and deliver more training opportunities. Some organizations have longbeen offering free online and in-person training for older adults (for example, AARP TEKand SeniorNet).8 Some of these have partnerships with carriers, identified, as withOATS, on the sponsorship portion of the websites.9“With so much technology there is no support. Technology changes so quickly thatcomputers, phones, etc. become obsolete resulting in new purchases. As a senior, Idon't want to have to upgrade every two years or so. Money does become an object. Ihave continued to upgrade, but getting to the point, enough is enough.” (Age 65-69)Create and market online/telephone support services. If the future isonline, then service should be there as well. Assume that over time, seniors will migrateaway from special purpose technology and be more likely to acquire standard devices(designed for all), customizing to their specific needs through software.10“I would simply like my access to be trustworthy and of adequate size – so I candownload and upload files that I am interested in.” (Age 70-74) 2016 Link agePage 14
How the Survey Was ConductedThe Link age survey population encompasses individuals residing in one of thefollowing: low income housing, independently owned homes, continuing care retirementcommunities, assisted living communities, and skilled nursing centers. The survey waswritten in an electronic format and the link was provided to the Link·age Stakeholders(Senior Living Providers), to distribute among the older population they serve. Therewere 401 surveys completed and returned. A customized memo describing theirpurpose was prepared and communicated to each organization, emphasizing theimportance and anonymity of responses. The comments you will read throughout thisreport are direct quotes and a sampling of more than 80 comments that were provided.For questions regarding this survey or Link age Stakeholders, please contact Link ageat 4605 Duke Drive, Suite 110, Mason, OH 45040, or see www.linkageconnect.com.For information about Aging in Place Technology Watch, seewww.ageinplacetech.com.AcknowledgementsThe team of Link age and Aging in Place Technology Watch would like to thank theStakeholder organizations of Link age and all of the participants in the survey. Withouttheir commitments and willingness, this report would not have been possible. 2016 Link agePage 15
Appendix I: Link age Survey FromNext Generation Response Systems 2013The paper survey was distributed to 3782 older adults aged 55-100 .11 Another 233(29%) completed it online. A total of 1114 individuals responding during the 4-weeksurvey window: 76% were women, 67% were over the age of 70, 70% of theresponders reported they live alone, and 57% of the responders had annual incomesunder 25,000. Those who responded via paper were more likely to live alone, have aPERS device and be older than those who responded online. Sixty percent were livingin senior housing communities.DO YOU OWN A MOBILE PHONE?Yes67%No33%WHAT TYPE OF PHONE?Cell phone74%Smartphone with Internet and email15%Senior cell phone11%PROVIDER 27%I don't know27%Other 2016 Link age19%Page 16
DO YOU OWN A COMPUTER?Yes45%No55%YOUR WEEKLY USAGE? 1 hour16%1 to 5 hours6 to 9 hours29%19%10 hours37%HELPED WITH PURCHASING DECISIONS?Yes55%No 2016 Link age45%Page 17
Appendix II:Smartphone OwnershipAgenOwn 60351660 to 64382265 to 69412570 to 74522875 to 79723880 to 84832285 8015Total401% Own46%58%61%54%53%27%19% 3%80:8427%27%27%27%27%85 19%19%19%19%19%The table above identifies any significant differences between data values in Figure 6.In the 65 to 69 age band row, 25 (Own 25) of the 41 (n 41) responders indicatedsmartphone ownership. Calculate 25/41*100. % Own 61%. Moving to the right inthe same row, there are no statistically significant % Own rate differences except for theoldest age bands (95% confidence level, p 0.05). Blank cells indicate no statisticallysignificant difference between the % Own cell.The 80 to 84 responders indicated 27% smartphone ownership, and the 85 groupindicated 19% ownership. A red font indicates a lower ownership rate as compared tothe % Own column. A green font indicates a greater ownership rate than the % Owncolumn.There are no statistically significant differences in smartphone ownership among any ofthe first 5 age bands ( 60 through 75 to 79).Finally, there is no statistically significant difference between the smartphone ownershiprates in the 80 to 84 (27%) and the 85 (19%) age groups. 2016 Link agePage 18
ships/caregiving/info-03-2008/healthy tems 2016 Link agePage 19
2016 Technology Survey Older Adults, Age 59-85 . “Facebook, Twitter and Instagram are having negative effects on civility and . instructions came with it. Now you have to buy instructions, i.e. Microsoft for Dummies.” (Age 75-79) 0% 10% 20% 30% 40% 50% 60% 70% 80% 90% 100% 60 to 64 6
