Transcription
Exercises in Signals, Systems, and TransformsIvan W. SelesnickLast edit: January 28, 2019Contents1 Discrete-Time Signals and Systems1.1 Signals . . . . . . . . . . . . . . . .1.2 System Properties . . . . . . . . .1.3 More Convolution . . . . . . . . .1.4 Z Transforms . . . . . . . . . . . .1.5 Inverse Systems . . . . . . . . . . .1.6 Difference Equations . . . . . . . .1.7 Complex Poles . . . . . . . . . . .1.8 Frequency Responses . . . . . . . .1.9 Summary Problems . . . . . . . . .1.10 Simple System Design . . . . . . .1.11 Matching . . . . . . . . . . . . . .1.12 More Problems . . . . . . . . . . .22491417182335606465742 Continuous-Time Signals and Systems2.1 Signals . . . . . . . . . . . . . . . . . .2.2 System Properties . . . . . . . . . . .2.3 Convolution . . . . . . . . . . . . . . .2.4 Laplace Transform . . . . . . . . . . .2.5 Differential Equations . . . . . . . . .2.6 Complex Poles . . . . . . . . . . . . .2.7 Frequency Response . . . . . . . . . .2.8 Matching . . . . . . . . . . . . . . . .2.9 Simple System Design . . . . . . . . .2.10 Summary . . . . . . . . . . . . . . . .77777884899093101128129131.3 Fourier Transform1373.1 Fourier Transform . . . . . . . . . . . . . . . . . . . . . . . . . . . . . . . . . . . . . . . . . . . . . . . 1373.2 Fourier Series . . . . . . . . . . . . . . . . . . . . . . . . . . . . . . . . . . . . . . . . . . . . . . . . . . 1453.3 Modulation . . . . . . . . . . . . . . . . . . . . . . . . . . . . . . . . . . . . . . . . . . . . . . . . . . . 1474 The Sampling Theorem1491
11.1Discrete-Time Signals and SystemsSignals1.1.1 Make an accurate sketch of each of the discrete-time signals(a)x(n) u(n 3) 0.5 u(n 1)(b)x(n) δ(n 3) 0.5 δ(n 1)(c)x(n) 2n · δ(n 4)(d)x(n) 2n · u( n 2)(e)x(n) ( 1)n u( n 4).(f)x(n) 2 δ(n 4) δ(n 2) u(n 3)(g)x(n) X4 δ(n 3 k 1)k 0(h)x(n) X( 1)k δ(n 3 k)k 1.1.2 Make a sketch of each of the following signals(a)x(n) X(0.9) k δ(n k)k (b)x(n) cos(π n) u(n)(c)x(n) u(n) 2 u(n 4) u(n 8)1.1.3 Sketch x(n), x1 (n), x2 (n), and x3 (n) wherex(n) u(n 4) u(n),x2 (n) x(5 n),x1 (n) x(n 3),x3 (n) nXx(k)k 2
1.1.4 Sketch x(n) and x1 (n) wherex(n) (0.5)n u(n),nXx1 (n) x(k)k 1.1.5 Sketch x(n) and x1 (n) wherex(n) n [δ(n 5) δ(n 3)],nXx1 (n) x(k)k 1.1.6 Make a sketch of each of the following signals(a)f (n) Xk( 0.9) δ(n 3 k)k 0(b)g(n) X( 0.9) k δ(n 3 k)k (c)x(n) cos(0.25 π n) u(n)(d)x(n) cos(0.5 π n) u(n)1.1.7 Plotting discrete-time signals in MATLAB.Use stem to plot the discrete-time impulse function:n -10:10;f (n 0);stem(n,f)Use stem to plot the discrete-time step function:f (n 0);stem(n,f)Make stem plots of the following signals. Decide for yourself what the range of n should be.f (n) u(n) u(n 4)g(n) r(n) 2 r(n 5) r(n 10)(1)where r(n) : nu(n)(2)x(n) δ(n) 2 δ(n 4)(3)y(n) (0.9)n (u(n) u(n 20))(4)v(n) cos(0.12 πn) u(n)(5)3
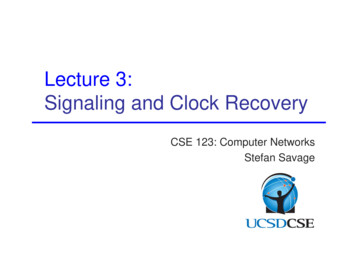
1.2System Properties1.2.1 A discrete-time system may be classified as follows: memoryless/with memory causal/noncausal linear/nonlinear time-invariant/time-varying BIBO stable/unstableClassify each of the following discrete-times systems.(a)y(n) cos(x(n)).(b)y(n) 2 n2 x(n) n x(n 1).(c)y(n) max {x(n), x(n 1)}Note: the notation max{a, b} means for example; max{4, 6} 6.(d) y(n) x(n)when n is evenx(n 1) when n is odd(e)y(n) x(n) 2 x(n 1) 3 x(n 2).(f)y(n) X(1/2)k x(n k).k 0That is,y(n) x(n) (1/2) x(n 1) (1/4) x(n 2) · · ·(g)y(n) x(2 n)1.2.2 A discrete-time system is described by the following ruley(n) 0.5 x(2n) 0.5 x(2n 1)where x is the input signal, and y the output signal.(a) Sketch the output signal, y(n), produced by the 4-point input signal, x(n) illustrated below.32x(n)21-2-101423456n
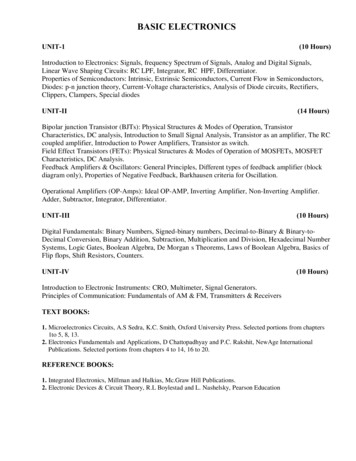
(b) Sketch the output signal, y(n), produced by the 4-point input signal, x(n) illustrated below.32x(n)21-2-10123456n(c) Classify the system as:i. causal/non-causalii. linear/nonlineariii. time-invariant/time-varying1.2.3 A discrete-time system is described by the following rule(x(n),when n is an even integery(n) x(n), when n is an odd integerwhere x is the input signal, and y the output signal.(a) Sketch the output signal, y(n), produced by the 5-point input signal, x(n) illustrated below.32x(n)21-2-101123456n(b) Classify the system as:i. linear/nonlinearii. time-invariant/time-varyingiii. stable/unstable1.2.4 System classification:classNL5
1.2.5 A discrete-time system is described by the following ruley(n) ( 1)n x(n) 2 x(n 1)where x is the input signal, and y the output signal.(a) Accurately sketch the output signal, y(n), produced by the input signal x(n) illustrated below.32x(n)1-2-1011(b) Classify the system as:i. causal/non-causalii. linear/nonlineariii. time-invariant/time-varying1.2.6 Predict the output of an LTI system:623456n
1.2.7 The impulse response of a discrete-time LTI system ish(n) 2 δ(n) 3 δ(n 1) δ(n 2).Find and sketch the output of this system when the input is the signalx(n) δ(n) 3 δ(n 1) 2 δ(n 2).1.2.8 Consider a discrete-time LTI system described by the ruley(n) x(n 5) 1x(n 7).2What is the impulse response h(n) of this system?1.2.9 The impulse response of a discrete-time LTI system ish(n) δ(n) 2 δ(n 1) δ(n 2).Sketch the output of this system when the input isx(n) Xδ(n 4 k).k 01.2.10 The impulse response of a discrete-time LTI system ish(n) 2 δ(n) δ(n 4).Find and sketch the output of this system when the input is the step functionx(n) u(n).1.2.11 Consider the discrete-time LTI system with impulse responseh(n) n u(n).(a) Find and sketch the output y(n) when the input x(n) isx(n) δ(n) 2 δ(n 5) δ(n 10).(b) Classify the system as BIBO stable/unstable.7
1.2.12 Predict the output of an LTI system:1.2.13 The impulse response h(n) of an LTI system is given by n2h(n) u(n).3Find and sketch the output y(n) when the input is given by(a) x(n) δ(n)(b) x(n) δ(n 2)1.2.14 For the LTI system with impulse responseh(t) cos (πt) u(n),find and sketch the step response s(t) and classify the system as BIBO stable/unstable.1.2.15 Consider the LTI system with impulse responseh(n) δ(n 1).(a) Find and sketch the output y(n) when the input x(n) is the impulse train with period 6,x(n) Xδ(n 6k).k (b) Classify the system as BIBO stable/unstable.1.2.16 An LTI system is described by the following equationy(n) kX1k 03x(n k).Sketch the impulse response h(n) of this system.1.2.17 Consider the parallel combination of two LTI systems.8
-h1 (n)? l -x(n)-y(n)6h2 (n)You are told thath1 (n) u(n) 2 u(n 1) u(n 2).You observe that the step response of the total system iss(n) 2 r(n) 3 r(n 1) r(n 2)where r(n) n u(n). Find and sketch h2 (n).1.2.18 The impulse response of a discrete-time LTI system is given by 1 if n is a positive prime numberh(n) 0 otherwise(a) Is the system causal?(b) Is the system BIBO stable?1.2.19 You observe an unknown LTI system and notice thatu(n) u(n 2)-S-δ(n 1) 14δ(n 4)Sketch the step response s(n). The step response is the system output when the input is the step function u(n).1.2.20 For an LTI system it is known that input signalx(n) δ(n) 3 δ(n 1)produces the following output signal: n1y(n) u(n).2What is the output signal when the following input signal is applied to the system?x2 (n) 2 δ(n 2) 6 δ(n 3)1.3More Convolution1.3.1 Derive and sketch the convolution x(n) (f g)(n) where(a)f (n) 2 δ(n 10) 2 δ(n 10)g(n) 3 δ(n 5) 3 δ(n 5)9
(b)f (n) δ(n 4) δ(n 1)g(n) 2 δ(n 4) δ(n 1)(c)f (n) δ(n 2) δ(n 1) δ(n)g(n) δ(n) δ(n 1) δ(n 2)(d)f (n) 4g(n) δ(n) 2 δ(n 1) δ(n 2).(e)f (n) δ(n) δ(n 1) 2 δ(n 2)g(n) δ(n 2) δ(n 3).(f)f (n) ( 1)ng(n) δ(n) δ(n 1).1.3.2 The impulse response of a discrete-time LTI system ish(n) u(n) u(n 5).Sketch the output of this system when the input isx(n) Xδ(n 5 k).k 01.3.3 The signal f is given by π f (n) cosn .2The signal g is illustrated.g(n)-2-111014-1-1Sketch the signal, x(n), obtained by convolving f (n) and g(n),x(n) (f g)(n).105n
1.3.4 The signals f and g are given byf (n) 2, n1g(n) u(n).2Sketch the signal, x(n), obtained by convolving f (n) and g(n),x(n) (f g)(n).1.3.5 The signals f (n) and g(n) are shown:f(n)33221102 4 31 2 10n1234g(n)32210 1 2 1 4 3 1 2 10n123Sketch the convolution x(n) f (n) g(n).1.3.6 Sketch the convolution of the discrete-time signal x(n)32x(n)21-2-1012with each of the following signals.(a) f (n) 2δ(n) δ(n 1)(b) f (n) u(n)(c) f (n) 0.5113456n4
(d) f (n) Xδ(n 5k)k 1.3.7 Discrete-time signals f and g are defined as:f (n) an u(n)g(n) f ( n) a n u( n)Find the convolution:x(n) (f g)(n)Plot f , g, and x when a 0.9. You may use a computer for plotting.1.3.8 The N -point moving average filter has the impulse response 1/N0 n N 1h(n) 0otherwiseUse the Matlab conv command to computey(n) h(n) h(n)for N 5, 10, 20, and in each case make a stem plot of h(n) and y(n).What is the general expression for y(n)?1.3.9 The convolution of two finite length signals can be written as a matrix vector product. Look at the documentationfor the Matlab convmtx command and the following Matlab code that shows the convolution of two signals by(1) a matrix vector product and (2) the conv command. Describe the form of the convolution matrix and whyit works. x [1 4 2 5]; h [1 3 -1 2]; convmtx(h’,4)*x’ans 1713921-110 conv(h,x)’ans 1713921-11012
1.3.10 The convolution y h g, where h and g are finite-length signals, can be represented as a matrix-vector product,y Hg where H is a convolution matrix. In MATLAB, a convolution matrix H can be obtained with thecommand convmtx(h(:), K).Given finite-length sequences h and x, defineH convmtx(h(:), M)where M is such that the matrix-vector product H T x is defined, where H T denotes the transpose of H.In terms of convolution, what does the matrix-vector product H T x represent?Write a MATLAB function to compute H T x using the function conv and without creating the matrix H. Theinput to your function should be vectors, h and x.1.3.11 MATLAB conv functionLetf (n) u(n) u(n 5)g(n) r(n) 2 r(n 5) r(n 10).where r(n) : n u(n).In MATLAB, use theconv function to compute the following convolutions. Use the stem function to plot theresults. Be aware about the lengths of the signals. Make sure the horizontal axes in your plots are correct.(a) f (n) f (n)(b) f (n) f (n) f (n)(c) f (n) g(n)(d) g(n) δ(n)(e) g(n) g(n)Comment on your observations: Do you see any relationship between f (n) f (n) and g(n) ? Compare f (n) withf (n) f (n) and with f (n) f (n) f (n). What happens as you repeatedly convolve this signal with itself?Use the commands title, xlabel, ylabel to label the axes of your plots.1.3.12 Convolution of non-causal signals in MATLABNote that both of these signals start to the left of n 0.f (n) 3 δ(n 2) δ(n 1) 2 δ(n 3)(6)g(n) u(n 4) u(n 3)(7)First, plot the signals f , g, and f g by hand, without using MATLAB. Note the start and end points.Next, use MATLAB to make plots of f , g, and f g. Be aware that the conv function increases the length ofvectors.To turn in: The plots of f (n), g(n), x(n), and your Matlab commands to create the plots.1.3.13 Smoothing data by N -point convolution.Save the data file DataEOG.txt from the course website. Load the data into Matlab using the command loadDataEOG.txt Type whos to see your variables. One of the variables will be DataEOG. For convenience, renameit to x by typing: x DataEOG; This signal comes from measuring electrical signals from the brain of a humansubject.Make a stem plot of the signal x(n). You will see it doesn’t look good because there are so many points. Makea plot of x(n) using the plot command. As you can see, for long signals we get a better plot using the plotcommand. Although discrete-time signals are most appropriately displayed with the stem command, for longdiscrete-time signals (like this one) we use the plot command for better appearance.13
Create a simple impulse response for an LTI system:h ones(1,11)/11;Compute the convolution of h and x:y conv(x, h);Make a MATLAB plot of the output y.(a) How does convolution change x? (Compare x and y.)(b) How is the length of y related to the length of x and h?(c) Plot x and y on the same graph. What problem do you see? Can you get y to “line up” with x?(d) Use the following commands:y2 y;y2(1:5) [];y2(end-4:end) [];What is the effect of these commands? What is the length of y2? Plot x and y2 on the same graph. Whatdo you notice now?(e) Repeat the problem, but use a different impulse response:h ones(1,31)/31;What should the parameters in part (d) be now?(f) Repeat the problem, but useh ones(1,67)/67;What should the parameters in part (d) be now?Comment on your observations.To turn in: The plots, your Matlab commands to create the signals and plots, and discussion.1.4Z Transforms1.4.1 The Z-transform of the discrete-time signal x(n) isX(z) 3 z 2 2 z 3Accurately sketch the signal x(n).1.4.2 Define the discrete-time signal x(n) asx(n) 0.3 δ(n 2) 2.0 δ(n) 1.5 δ(n 3) δ(n 5)(a) Sketch x(n).(b) Write the Z-transform X(z).(c) Define G(z) z 2 X(z). Sketch g(n).1.4.3 The signal g(n) is defined by the sketch.14
1.4.4 Let x(n) be the length-5 signalx(n) {1, 2, 3, 2, 1}where x(0) is underlined. Sketch the signal corresponding to each of the following Z-transforms.(a) X(2z)(b) X(z 2 )(c) X(z) X( z)(d) X(1/z)1.4.5 Sketch the discrete-time signal x(n) with the Z-transformX(z) (1 2 z) (1 3 z 1 ) (1 z 1 ).1.4.6 Define three discrete-time signals:a(n) u(n) u(n 4)b(n) δ(n) 2 δ(n 3)c(n) δ(n) δ(n 1)Define three new Z-transforms:D(z) A( z),E(z) A(1/z),F (z) A( 1/z)(a) Sketch a(n), b(n), c(n)(b) Write the Z-transforms A(z), B(z), C(z)(c) Write the Z-transforms D(z), E(z), F (z)(d) Sketch d(n), e(n), f (n)1.4.7 Find the Z-transform X(z) of the signal n n12x(n) 4u(n) u(n).331.4.8 The signal x is defined asx(n) a n Find X(z) and the ROC. Consider separately the cases: a 1 and a 1.15
1.4.9 Find the right-sided signal x(n) from the Z-transformX(z) 2z 1z 2 56 z 161.4.10 Consider the LTI system with impulse response n2h(n) 3u(n)3Find the output y(n) when the input x(n) is n1x(n) u(n).21.4.11 A discrete-time LTI system has impulse response n1u(n)h(n) 25Find the output signal produced by the system when the input signal is n1x(n) 3u(n)21.4.12 Consider the transfer functions of two discrete-time LTI systems,H1 (z) 1 2z 1 z 2 ,H2 (z) 1 z 1 z 2 .(a) If these two systems are cascaded in series, what is the impulse response of the total system?x(n)- H1 (z)- H2 (z)-y(n)(b) If these two systems are combined in parallel, what is the impulse response of the total system?- H1 (z)x(n)- H2 (z)1.4.13 Connected systems:16? j - y(n)6
1.4.14 Consider the parallel combination of two LTI systems.h1 (n)-? l -x(n)6h2 (n)-y(n)You are told that the impulse responses of the two systems are n1u(n)h1 (n) 32andh2 (n) 2 n1u(n)3(a) Find the impulse response h(n) of the total system.(b) You want to implement the total system as a cascade of two first order systems g1 (n) and g2 (n). Findg1 (n) and g2 (n), each with a single pole, such that when they are connected in cascade, they give the samesystem as h1 (n) and h2 (n) connected in parallel.x(n)g1 (n)--g2 (n)-y(n)1.4.15 Consider the cascade combination of two LTI systems.x(n)-SYS 1-SYS 2The impulse response of SYS 1 ish1 (n) δ(n) 0.5 δ(n 1) 0.5 δ(n 2)and the transfer function of SYS 2 isH2 (z) z 1 2 z 2 2 z 3 .(a) Sketch the impulse response of the total system.(b) What is the transfer function of the total system?1.5Inverse Systems1.5.1 The impulse response of a discrete-time LTI system is n1h(n) δ(n) 2u(n).2(a) Find the impulse response of the stable inverse of this system.17-y(n)
(b) Use MATLAB to numerically verify the correctness of your answer by computing the convolution of h(n)and the impulse response of the inverse system. You should get δ(n). Include your program and plots withyour solution.1.5.2 A discrete-time LTI systemx(n)-h(n)-y(n)has the impulse responseh(n) δ(n) 3.5 δ(n 1) 1.5 δ(n 2).(a) Find the transfer function of the system h(n).(b) Find the impulse response of the stable inverse of this system.(c) Use MATLAB to numerically verify the correctness of your answer by computing the convolution of h(n)and the impulse response of the inverse system. You should get δ(n). Include your program and plots withyour solution.1.5.3 Consider a discrete-time LTI system with the impulse responseh(n) δ(n 1) 10δ(n) δ(n 1).3(a) Find the impulse response g(n) of the stable inverse of this system.(b) Use MATLAB to numerically verify the correctness of your answer by computing the convolution of h(n)and the impulse response of the inverse system. You should get δ(n). Include your program and plots withyour solution.1.5.4 A causal discrete-time LTI systemx(n)-H(z)- y(n)is described by the difference equationy(n) 1y(n 1) x(n) 2 x(n 1).3What is the impulse response of the stable inverse of this system?1.6Difference Equations1.6.1 A causal discrete-time system is described by the difference equation,y(n) x(n) 3 x(n 1) 2 x(n 4)(a) What is the transfer function of the system?(b) Sketch the impulse response of the system.1.6.2 Given the impulse response . . .18
1.6.3 A causal discrete-time LTI system is implemented using the difference equationy(n) x(n) x(n 1) 0.5 y(n 1)where x is the input signal, and y the output signal. Find and sketch the impulse response of the system.1.6.4 Given the impulse response . . .1.6.5 Given two discrete-time LTI systems described by the difference equations1r(n 1) x(n) 2x(n 1)31H2 : y(n) y(n 1) r(n) 2r(n 1)3H1 : r(n) let H be the cascade of H1 and H2 in series.x(n)H1r(n)19H2y(n)
Find the difference equation of the total system, H.Suppose H1 and H2 are causal systems. Is H causal? Is H stable?1.6.6 Two causal LTI systems are combined in parallel:H1x(n)f (n) H2y(n)g(n)The two systems are implemented with difference equations:H1 : f (n) x(n) x(n 2) 0.1 f (n 1)H2 : g(n) x(n) x(n 1) 0.1 g(n 1)Find the difference equation describing the total system between input x(n) and output y(n).1.6.7 Consider a causal discrete-time LTI system described by the difference equationy(n) 125y(n 1) y(n 2) 2 x(n) x(n 1).663(a) Find the transfer function H(z).(b) Find the impulse response h(n). You may use MATLAB to do the partial fraction expansion. The MATLABfunction is residue. Make a stem plot of h(n) with MATLAB.(c) OMIT: Plot the magnitude of the frequency response H(ejω ) of the system. Use the MATLAB functionfreqz.1.6.8 A room where echos are present can be modeled as an LTI system that has the following rule:y(n) X2 k x(n 10 k)k 0The output y(n) is made up of delayed versions of the input x(n) of decaying amplitude.(a) Sketch the impulse response h(n).(b) What is transfer function H(z)?(c) Write the corresponding finite-order difference equation.1.6.9 Echo Canceler. A recorded discrete-time signal r(n) is distorted due to an echo. The echo has a lag of 10samples and an amplitude of 2/3. That meansr(n) x(n) 2x(n 10)3where x(n) is the original signal. Design an LTI system with impulse response g(n) that removes the echo fromthe recorded signal. That means, the system you design should recover the original signal x(n) from the signalr(n).(a) Find the impulse response g(n).(b) Find a difference equation that can be used to implement the system.(c) Is the system you designed both causal and stable?20
1.6.10 Consider a causal discrete-time LTI system with the impulse response n3 3h(n) u(n) 2 δ(n 4)2 4(a) Make a stem plot of h(n) with MATLAB.(b) Find the transfer function H(z).(c) Find the difference equation that describes this system.(d) Plot the magnitude of the frequency response H(ejω ) of the system. Use the MATLAB command freqz.1.6.11 Consider a stable discrete-time LTI system described by the difference equationy(n) x(n) x(n 1) 2 y(n 1).(a) Find the transfer function H(z) and its ROC.(b) Find the impulse response h(n).1.6.12 Two LTI systems are connected in series:-SYS 1-SYS 2-The system SYS 1 is described by the difference equationy(n) x(n) 2 x(n 1) x(n 2)where x(n) represents the input into SYS 1 and y(n) represents the output of SYS 1.The system SYS 2 is described by the difference equationy(n) x(n) x(n 1) x(n 2)where x(n) represents the input into SYS 2 and y(n) represents the output of SYS 2.(a) What difference equation describes the total system?(b) Sketch the impulse response of the total system.1.6.13 Three causal discrete-time LTI systems are used to create the a single LTI system.H2x(n)H1r(n) H3The difference equations used to implement the systems are:H1 :r(n) 2 x(n) 1r(n 1)21f (n 1)31H3 : g(n) r(n) r(n 1)4What is the transfer function Htot (z) for the total system?H2 :f (n)f (n) r(n) 21g(n)y(n)
1.6.14 Given the difference equation.1.6.15 Difference equations in MATLABSuppose a system is implemented with the difference equation:y(n) x(n) 2 x(n 1) 0.95 y(n 1)Write your own MATLAB function, mydiffeq, to implement this difference equation using a for loop. If theinput signal is N -samples long (0 n N 1), your program should find the first N samples of the outputy(n) (0 n N 1). Remember that MATLAB indexing starts with 1, not 0, but don’t let this confuse you.Use x( 1) 0 and y( 1) 0.(a) Is this system linear? Use your MATLAB function to confirm your answer:y1 mydiffeq(x1)y2 mydiffeq(x2)y3 mydiffeq(x1 2*x2)Use any signals x1, x2 you like.(b) Is this system time-invariant? Confirm this in MATLAB (how?).(c) Compute and plot the impulse response of this system. Use x [1, zeros(1,100)]; as input.(d) Define x(n) cos(π n/8) [u(n) u(n 50)]. Compute the output of the system in two ways:(1) y(n) h(n) x(n) using the conv command.(2) Use your function to find the output for this input signal.Are the two computed output signals the same?(e) Write a new MATLAB function for the system with the difference equation:y(n) x(n) 2 x(n 1) 1.1 y(n 1)Find and plots the impulse response of this system. Comment on your observations.(f) For both systems, use the MATLAB function filter to implement the difference equations. Do the outputsignals obtained using the MATLAB function filter agree with the output signals obtained using yourfunction mydiffeq? (They should!)To turn in: The plots, your MATLAB commands to create the signals and plots, and discussion.22
1.7Complex Poles1.7.1 A causal discrete-time LTI system is implemented using the difference equationy(n) x(n) y(n 2)where x is the input signal, and y the output signal.(a) Sketch the pole/zero diagram of the system.(b) Find and sketch the impulse response of the system.(c) Classify the system as stable/unstable.1.7.2 The impulse response of an LTI discrete-time system is n 12πh(n) cosn u(n).23Find the difference equation that implements this system.1.7.3 A causal discrete-time LTI system is implemented using the difference equationy(n) x(n) 4 y(n 2)where x is the input signal, and y the output signal.(a) Sketch the pole/zero diagram of the system.(b) Find and sketch the impulse response of the system.(c) Classify the system as stable/unstable.(d) Find the form of the output signal when the input signal is n1u(n).x(n) 23You do not need to compute the constants produced by the partial fraction expansion procedure (PFA)— you can just leave them as constants: A, B, etc. Be as accurate as you can be in your answer withoutactually going through the arithmetic of the PFA.1.7.4 A causal discrete-time LTI system is implemented using the difference equationy(n) x(n) 151x(n 1) y(n 1) y(n 2)228where x is the input signal, and y the output signal.(a) Sketch the pole/zero diagram of the system.(b) Find and sketch the impulse response of the system.(c) Use Matlab to verify your answers to (a) and (b). Use the command residue and zplane. Use the commandfilter to compute the impulse response numerically and verify that it is the same as your formula in (b).1.7.5 A causal discrete-time LTI system is implemented using the difference equation y(n) x(n) 2 x(n 1) x(n 2) 0.5 y(n 2)where x is the input signal, and y the output signal.(a) Find the poles and zeros of the system.(b) Sketch the pole/zero diagram of the system.(c) Find the dc gain of the system.(d) Find the value of the frequency response at ω π.23
(e) Based on parts (a),(b),(c), roughly sketch the frequency response magnitude H f (ω) of the system.(f) Suppose the step function u(n) is applied as the input signal to the system. Find the steady state behaviorof the output signal.(g) Suppose the cosine waveform cos(0.25πn)u(n) is applied as the input signal to the system. Find the steadystate behavior of the output signal.(h) Find the impulse response of the system. Your answer should not contain j.1.7.6 Consider an LTI system with the difference equationy(n) x(n) 2.5x(n 1) y(n 1) 0.7y(n 2)(8)Compute the impulse response of the system in three ways:(a) Use the MATLAB function filter to numerically compute the impulse response of this system. Make astem plot of the impulse response.(b) Use the MATLAB function residue to compute the partial fraction offirst-order terms. Then write the impulse response ash(n) C1 (p1 )n u(n) C2 (p2 )n u(n).1z H(z).Write H(z) as a sum of(9)The four values C1 , C2 , p1 , p2 are found using the residue command. For this system they will be complex!Use Equation (9) to compute in Matlab the impulse response,n 0:30;h C1*p1. n C2*p2. n;Note that even though C1 , C2 , p1 , p2 are complex, the impulse response h(n) is real-valued. (The imaginaryparts cancel out.) Is this what you find? Make a stem plot of the impulse response you have computedusing Equation (9). Verify that the impulse response is the same as the impulse response obtained usingthe filter function in the previous part.(c) Compute the impulse response using the formula for a damped sinusoid:h(n) A rn cos(ωo n θo ) u(n).(10)This formula does not involve any complex numbers. This formula is obtained from Equation (9) by puttingthe complex values C1 , C2 , p1 , p2 into polar form:C1 R1 ej α1C2 R2 ej α2p1 r1 ej β1p2 r2 ej β2 .To put a complex number, c, in to polar form in MATLAB, use the functions abs and angle. Specificallyc rejθ where r abs(c) and θ angle(c).Using MATLAB, find the real values R1 , α1 , etc. You should find that R2 R1 , α2 α1 , r2 r1 , andβ2 β1 . Is this what you find? Therefore, the formula in Equation (9) becomesh(n) R1 ej α1 (r1 ej β1 )n u(n) R1 e j α1 (r1 e j β1 )n u(n) R1 ej α1 r1n ej β1 n u(n) R1 e j α1 r1n e j β1 n u(n) R1 r1n (ej(β1 n α1 ) e j(β1 n α1 ) ) u(n) 2 R1 r1n cos(β1 n α1 ) u(n).This finally has the form of a damped sinusoid (10).Using MATLAB, compute the impulse response using Equation (10)24
n 0:30;h A * r. n .* .Verify that the impulse response is the same as the impulse response obtained using the filter functionin (a).1.7.7 Repeat the previous problem for the systemy(n) x(n) 2.5x(n 1) x(n 2) y(n 1) 0.7y(n 2)25(11)
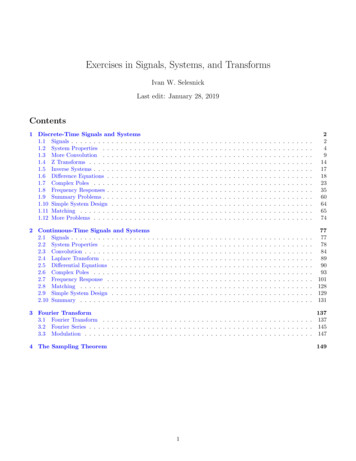
1.7.8 The diagrams on the following pages show the impulse responses and pole-zero diagrams of 8 causal discrete-timeLTI systems. But the diagrams are out of order. Match each diagram by filling out the following table.You should do this problem without using MATLAB or any other computational tools.In the pole-zero diagrams, the zeros are shown with ‘o’ and the poles are shown by ‘x’.IMPULSE RESPONSEPOLE-ZERO DIAGRAM12345678SecondOr26
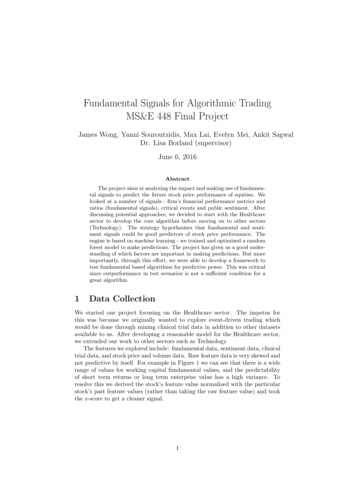
IMPULSE RESPONSE 1IMPULSE RESPONSE 21.51510.5100 0.55 100102030400IMPULSE RESPONSE 310203040304030403040IMPULSE RESPONSE SE RESPONSE 51020IMPULSE RESPONSE 61.5110.50.500 0.5 0.5 10102030400IMPULSE RESPONSE 71020IMPULSE RESPONSE 83221.51100.5 100102030400271020
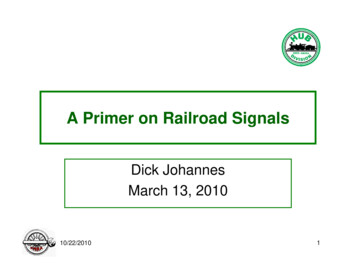
ZERO POLE DIAGRAM 1ZERO POLE DIAGRAM 2110.50.500 0.5 0.5 12 1 1 0.500.51 1ZERO POLE DIAGRAM 310.50.52 0.5 1 1 0.500.51 1ZERO POLE DIAGRAM 510.50.52 0.5 1 1 0.500.51 1ZERO POLE DIAGRAM 710.50.500 0.5 0.5 1 1 0.5000.510.5 0.500.51ZERO POLE DIAGRAM 81 1 0.50 0.5 11ZERO POLE DIAGRAM 6100.50 0.5 10ZERO POLE DIAGRAM 410 0.512 128 0.500.51
1.7.9 The diagrams on the following pages show the pole-zero diagrams and impulse responses of 8 causal discrete-timeLTI systems. But the diagrams are out of order. Match each diagram by filling out the following table.You should do this problem without using MATLAB or any other computational tools.In the pole-zero diagrams, the zeros are
Jan 28, 2019 · Sketch the step response s(n). The step response is the system output when the input is the step function u(n). 1.2.20For an LTI system it is known that input signal x(n) (n) 3 (n 1) produces the following output signal: y(n) 1 2 n u(n): What is the output signal when the following input signal is ap