Transcription
"Trend Trades".So far my forex research has been going thru lots of diferent process wich I decided not to make so public, in orderto only share relevant and usefull information here at TL.I had been interacting privately with Don on some very interesting technical issues for wich I am so greatfull.Thanks Don for such great contributions ¡¡You will notice that this thread will present a pre-elaborated concept of what I want to do, and somehow it will stillbe open for more optimizations on a near future, but I believe that what I will present here will not be very diferentto the final product of this trade.I want to trade in this occasion with the trend. I will not fool arround with counter trend trades, thought in futures Iam addicted to them, but in this case I will only focus on the trend side. so this will make the overall aproach veryclear and easy to follow.What I am going to present here its nothing new. its not rocket science, it will not amaze you. I am just going topresent diferent parts of analysis developed by other traders from other forums on diferent areas. Then I willoptimize to my taste this diferent analyisis and later put them all together in a comprehensive and simple ecuationthat I will call it "Trend Trades".Let me first start with a great issue that has been taking me some great deal of time doing some thinking andcoming to a sustainable conclusion : Weekly Targets and I know some people here do not agree in limitingprofits, and I think we made all our statements on this issue on some other threads, and I had clearly stated that Ilike to make an X fixed amount of per day scalping futures, well in forex I will aim to make a X fixed amount of per week. this has an impact in organizing my psychological setup and also the technical range frame of myaproach. its incredibly important for me to have this clear targets in mind and stick to them and trade arround thistargets. So in this case the target its going to be 20 per contract week. (low target) easy to make andpromotimg a very relaxed way of aproaching trading.The second issue was Timeframe interestingly Brownsfan took the topic the other day and really its so important onthe entire ecuation, where it marks a lot of aspects on your favor or not like : range of moves, RRR in relation toyour costs, volume, time to think, life style etc. you all know I am quite scalper in futures, well on this forexresearch I did even come down to 15 tick charts on ninjatrader. well very nice charts but not really the mostconveniant to the bussiness, so I started to look on some higher timeframes and see the benefits of looking at thismore longer charts and without going so long the 5 min time frame has made me more confortable in all thisaspects. so at this point you will notice I will be working arround this timeframe. (5 min ).What is a trend trade ?A trend trade is a trade that takes a clear trend definition and trades the dips on an UP trend and trades the rallyson a DOWN trend. simple, stupid, basic.What you need for a trend trade is all this :To open position :Trend DefinitionPullback Definition (dips and rallys)Timing Entry Definition
To Close Position :Stop DefinitionExit DefinitionWell there are thousands of this definitions outthere, some work , some dont ? why ? well its all about simplicity andoptimizationWhy some traders have an edge over others even doing the same kind of concept trend trade ? well its becausesome are very complicated in the way they defne trend for example. they need 13 indicators to establish a trend ,then to time their entry they use other 5 indicator that have to "allign" so at this point they DO have the trend tradestructure in mind BUT they have a mambo on their headSo creating a trend trade its not rocket science from a structural point of view, because actually that structure youwill find it on any TA textbook.But the science here is coming to the point of having superb simplicity.On the other hand Optimization has a great deal on giving a trend trader an edge over a diferent trend trader.optimization is taking this definitions and finding the BEST way to express them. the most unnoisy and at thesame time leading timing method for example. thats where optimization can change your life.So this trend trade I am about to present here has some of this ingredients.Trend DefinitionWe need to determine trend if we want to make trend trades, there are multiple ways of determining trend, butremember we are after simplicity and optimization.Let me tell you a little bit of history now, how I came to the trend definition I am about to present. During this entireprocess I have been interacting a lot with Don, in some point Don has showed me some threads dealing with thetopic "rainbow trading" if you would like to see some of this here I attach the links to this threads that deal withrainbows, one of the first developers on this aproach was GuppyMMA http://www.guppytraders.com/gup329.shtmlyou can get to see there some aspect on rainbows. after that a member called Linuxtroll develped something athere http://www.forexfactory.com/showthre. #post1494655 about rainbows too. now in this case he doesnt giveany hint on timing letting the traders figure that out by themselfs, wich it may work for some it may not for others.Now this rainbows are simply averages, no sofistication here, you could simply use the smallest and the largestone and get the final same output. but the interesting thing here is that plotting all this lines actually give somemore information in terms of momentum of trend wich can tell us about the quality of the trend.Now as I like to take things a little further I came up with something I believe outstanding. some guy calledBemac, who is a moderator from this forum http://www.visualtradingcharts.com/forum/index.php came up with aNEW kind of Rainbow wich I notice nobody really understanded much the value of this new indicator as it almostdid not get much response the indicator is presented here http://www.visualtradingcharts.com/f.ead.php?t 2767and works on the VT platform wich is a very nice performing platform as it is also free with streaming realtime forexdata.Now this new Rainbow indicator is based from a Variable Moving Average, as you should know VMA s do adapttheir input depending on the amount of volatilty. here is some iableMA.htm in that definition you may notice that the ChandeMomentum Oscillator (CMO) is normally used for volatilty calculation on this average, well Bemac aparently usessome form of ADX for his VMA and then creates the rainbow with emas from this VMA.
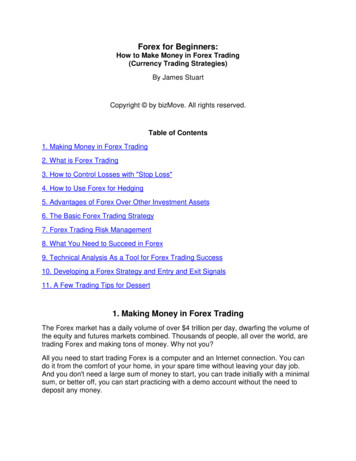
To make it simple, this rainbow looks formidable ¡¡Fig: rainbow-1.pngIt has some properties that I will try to explain gradually to you, so you can get to value this powerfull indicator.First should we talk about the normal problems trend indicators suffer.The great "Dilema" of trend indicators is whipsaws when volatilty drops, they just start performing in a way that allyour dreams of having a resting villa at Dubai goes thru the toilet and here many people if they where at some timesuccesfull, they just return all their gains back to this non friendly marketSO. SO. what to do about that ? how this complicates the challenge of having some trend definition ? for ourtrend trades.It certainly is a hard issue that has to be dwelt and has to be "optimized" thru some new modern indicators.In this case VMA s and particularly this VMA from Bemac have some properties that will help us reducedramatically the whipsaw dilema.Let me show you how this works, a normal sma has the same input thru the entire dataseries, an ema gives somemore weight on last data, but the vma literally changes its inputs depending on volatilty. so this way if things getchopy. this lines will literally get "horizontal". what is the advantage of that ? well horizontal lines normally donthave much opotunity of crossing with other lines. so things kinda halt and just dont give us false signals.Let me see if I can explain with some graphs here :
Fig: vma vs others.pngI hope you get the idea here, because understanding this it may represent you a great change on your trading life.This "horizontal performance" has the effect of bringing down noise and whipsaws in an unprecedent scale.Now when we take this and create a rainbow, things start to rock. but let me first show you some real lifeexamples of this horizontal effect :Fig: trend-trades-vma.pngOn the above chart I mark with elipses the chop areas and with arrows the trending areas. notice how during thechop the VMA (black line) literally gets horizontal, and during trending she starts to follow.
With a regular average on this chops you would been chopped in various pieces but with this one you are simply inone side of the rainbow. meditate on this. its simply powerfull yet so simple. cheers Walter.So what will be our "trend definition" for this trend trades ? simple, we will take this black line (VMA) and the lastEma of the vma the Magenta line and say:UP trend Black MagentaDOWN trend Black MagentaFig: trend-definition.pngWoooow great reasoning ¡¡¡ jejejej. but notice that thanks to the horizontal efect, the black line will have a smoothperformance in relation to the magenta line and we will rarely see whipsaws going on between both.The normal scenario on a chop situation being both average near looks like this :Fig: organized mambo.pngNotice on the above chart how we have two chop areas going on (cyan rectangles), but look how they are in twoclear trend definitions black above/below magenta. giving us some clear understanding of trend. even on thisunclear (for other traders) scenario. we had a simple bias established.
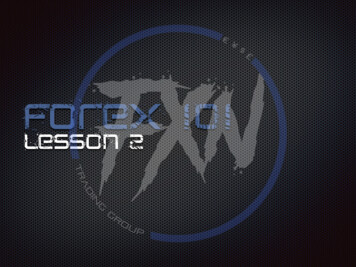
So this is our trend definition, cant get more simple. and it has embeded the great advantages of noise reductionthru the "horizontal efect" of this great tool.Momentum giving quality to our trend. (the rainbow in action )Ok. now that we have a basic trend definition with all the advantages that the VMA can give us, we are ready tointroduce the Momentum definition into our ecuation. the momentum definition will tell us the "quality" of ourtrend. is it a strong or weak trend ?. so we dont only know our trend definition but we will also know the quality ofour trend thru the momentum definition.Here is where the "Rainbow" will show its edge to the trader.Why the rainbow and not the first and last averages of the rainbow ? (black/ magenta). well you will notice that therainbow will graphically amplify the perception of momentum readings on the chart. so it will make more easy toperceive in what momentum condition we are.At this point we will have Three basic Momentum readings :Contraction/ExpansionLadder EffectComplete Rainbow above/below Magenta lineContraction/ExpansionTo start making simple this momentum definition let me give you an ilustration of a real large highway (lots of lanes)If there is small trafic you will notice there are some cars taking the 1rst and 2nd right lane (thin) as the rush hourcomes in, you will notice 1rst to 6th lane get all filled with cars (thick). so it looks thin with very few cars and it looksthick with lots of cars in it.Same with the rainbow. it looks contracted when there is small momentum and it spreads out as momentum getsstronger.
Fig: momentum.pngon the example above you can see that we are in a basic downtrend as black magenta. now during thisdowntrend we can notice there are diferent momentum definitions very clearly expressed thru the rainbow as itcontracts and expands telling us the quality of our trend.Knowing the quality of our trend its very important as to the context we will choose to make our trend trades. forexample if we have a downtrend that is weak, taking shorts may become agressive. thought we have a downtrendby basic definition, the momentum definition its not strong, making this shorts agressive.Now, if our momentum is healthy, the more confidence we will have on our trade.Ladder EffectOne interesting way momentum builds up with our Vma rainbow its the "ladder effect" normally when the black linecrosses the magenta it makes a horizontal pause and after that if there really gona be momentum, then we havethe first ladder step that will form on the direction of the desired trend.
On the below graphs I try to explain how a trend may develop or not with the "ladder effect"Fig: will party.pngFig: no party.pngSo this ladder can keep us out of this type of situations where we got a trend definition but without momentumbuildup, and also give us confidence in the case momentum starts building with a positive ladder effect.
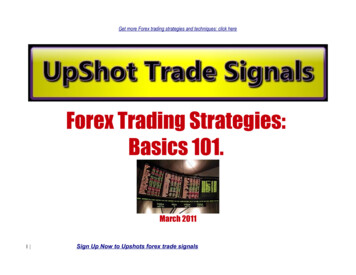
Fig: ladder effect.pngon the next post I talk about the third momentum definition Complete Rainbow above/below Magenta line .cheers Walter.and the third momentum definition :Complete Rainbow above/below Magenta linehere is another definition wich is very interesting to gauge the health of our trend. is the entire rainbowabove/below the magenta line ? remember that the magenta line is the most large average in the rainbow, andhaving all the rainbow in one side of this magenta line speeks good of our trend health, even in some cases when itis contracted.let me show you some examples :
Figs: magenta1, magenta2, magenta3.pngSo with this third momentum definition you got quite an arsenal to establish a "complete trend definition" for ourtrend trades.a trend definition that includes a cool basic trend definition thanks to the VMA performance in relation to themagenta line and a momentum definition of the trend with this three diferent readings of the VMA Rainbow.So far I could say we have a simplified and optimized "trend definition".Ok. so far I had been talking about Trend Definition with the momentum definition included there. in this post Ihave to make one clear logic warning about a scenario wich will resemble as a very strong trend as all the abovedefinitions BUT is imminent a change on the course of that trend.Should we call that "imminent strong trend exhaustion".You will have the rainbow all spread out. you will have all the averages on the same beautifull side of themagenta, you will have an "old ladder" and watch out here ¡¡ when we did such a great big move. we MUST havecaution on what may happen there, as probably market may be about to exhaust.
You can tell me we have all the trend and momentum definitions present YES. but we already did too muchtravelling and market may want to take a break at least.Fig: exhaustion.pngLet me remind you the trend trade structure how it looks (as posted before) :To open position :Trend DefinitionPullback Definition (dips and rallys)Timing Entry DefinitionTo Close Position :Stop DefinitionExit Definitionand also let me remind you that our target is "simplicity" and "optimization".now I will start with a new set of topics here as we already dealed with "trend definition", now we are ready toaboard the topic "Pullback (dips and rallys)" and "Timing Entry".This two are directly related. Timing comes right after the pullback, wich means that a pullback is the preamble ofthe timing entry in the trend trade structure.Now here we have another BIG dilema (probably the bigest, the hardest) for the trend trader. and it is the "erraticmorfology" of a pullback and its impact on "Timing".lets start with this question : what would be the ideal pullback for a trend trade ? the answer is : The ideal pullbackwould be a V shaped pullback.
Fig: v-shape-pull.pngnow this ideal is so far from reality. actually this pullbacks have an "erratic morfology", what I mean with this is thatthey are not V shaped, thought some times they do contain V s but from a morfologic stand point of view they are"erratic".Fig:erratic-pull.pngNow, having an erratic morfology on the pullbacks wouldnt bother us if we didnt need to "Time" our entries on thatmambo morfology. you see, we can say we are on a pullback very easy, BUT it gets hard when we have to do thenext step of "Timing" our entry and getting in to a position in an effective way. here is where the trader starts tofeel the frustration of knowing the trend and knowing a pullback is in place but NOT knowing when to enter andtime his trade.
Fig: wich enter.pngNow, lets analize and try to understand this "erratic" performance of a pullback. why erratic ? simple, marketduring a pullback is making a "pause" on his original direction (trend), and this pause will be a "chop" and not aperfect V. on this pause he has no rules, no time determination, no wave range, no intrascalp structure. nonothing. just "chop"The old TA school tried to organize it in some beautifull patterns like flags, pennants, triangles and rectangles, welllet me tell you if pullbacks had such nice clean morfologies we all would be multibillionaries some years agoalready. they do some times resemble this morfologies, but we have to accept the true fact that pullbacks areerratic in nature, because the market intrinsic structure gets erratic in that particular stage. its his nature, itsnatural. we cant get mad on him for being like that.SO. having this reality and with the intention of playing the dips and rallys (trend trades ) we find that our "Timing"will be precisely situated exactly on the middle of a mambo of nobodies land : the "erratic pullback"So in this "erratic pullback" scenario the trend trader is aiming to "Time" his trades. you know what ? he normallyfails. he normally gets stoped out and he gets very angry confused and frustrated.He starts blaiming the market, his broker, his costs, the fed. bla bla bla.But the true fact is that the market will always be that way, and it will be independently to your emotions.Now. let me tell you GOOD NEWS. thru optimization we can solve this dilema ¡¡Here is where VMA rainbow will show us its second power ¡¡Now, how can VMA rainbow help us out here.?Well let me remind you the "horizontal effect" of VMA and how this can really help us here.Do you remember this graph ?
Fig: vma vs others.pngwell it tell us about the property of becoming horizontal during a "chop". wow. that means that the "erratic" datacould be normalized to one simple horizontal line during chop. and guess what. when the chop finishes, the VMAcontinues on the direction of the trend.So let me show here on a graph the comparisson of an "erratic pullback" with a "horizontal effect" of vma.Fig: erratic-pull-hor-vma.pngThis information will literally resolve our dilema just about a 100%.
Now let me shift here a little bit the topic and talk to you about "trend timeframe" and smaller "very specific timingtime frames".So far I had presented "trend definition" on a 5 min time frame, and you know what, that IS our time frame, we aretaking trades out of a 5 min chart.NOW timing requires more dataseries so for that purpose we will be using a 1 min chart. I need more bars to getcalculated, I need ironically more noise to normalize with VMA so I can read more clearly the "horizontal pullbacks"and its aftermath continuations that will happen to be my "Timing Entry".So for the sake of not confusing anyone let me make this clear, we will have at this point two charts, a 5 min chartand a 1 min chart :5 min chart with VMA rainbow. for "Trend Definition" (described on above posts )1 min chart with VMA rainbow. for "Pullback" and "Timing" definitionsBoth charts will use VMA rainbow. BUT the uses will be diferent. on both charts the Vma rainbow parameters arethe same. so actually we are looking into diferent VMA rainbows giving diferent informations. one for trend (5min) the other for pullback/timing (1 min).on the next post I start showing the deployment of this arsenal to our service. cheers Walter.We are Trend Traders here. so first things first. First "Trend Definition". that task is done on the 5 min chart asexplained on previous posts.Having a trend definition on line we are ready to find "pullbacks" and "timing". this task will be done on the 1 minchart.This would be a Typical presentation of our "Trend Trades" :Fig:typical view.png
and typical real one.Fig: typical-real.pngNow without our powerfull tool let me show you lots of spots where you probably would had wondered where toenter your trade :
Fig: trades-where.pngYou can clearly see there where lots of smokes on the timing without VMA assistance .This timing tool on 1 minute chart gets as powerfull as it can get.Let me get into the specifics of pullback and timing readings of the 1 min chart on the next post. cheers Walter.Now lets get into the specifics of reading "Pullback" and "Timing" on the 1 minute chart.You can notice that we dont have the VMA (Black line ) alone. all the contrary she is accompanied by the entirerainbow. now the rainbow literally is a series of "signals" of the VMA. actually all emas all the way from 2 (firstyellow ) too 100 (magenta line).Now you can notice on the way of this emas "signals" we come thru a thick darkgreen one, I asume she is a 22ema of our VMA taking Bemac s construction description. This green Line will have some important role on ourspecific reading of "Pullback" and "Timing".
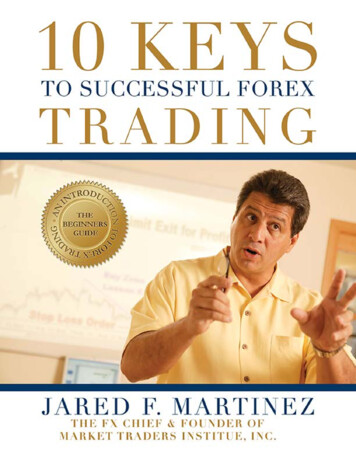
Pullback DefinitionWe will consider ourselfs in a "Pullback" condition only when we have a Down trend present (from the 5 min chart)and the black line crosses above the darkgreen line on the 1 min VMA Rainbow. thats pretty straight forward.thats our "Pullback Definition"Fig: pullback definition.png
Timing Entry DefinitionWe will consider a Timing Entry on this example when we cross back down our darkgreen line. simple.Fig: timing-definition.pngWhere is the power, where is the edge in all this pullback and timing definitions ?. well as we started this threadshowing the fact that horizontal lines just cannot make multiple crosses between them and in consecuence we canthave multiple whipsaws going on.So here the POWER gets unleashed ¡¡ you are in the midst of the mambo with a tool that is performing in a CLEANfashion giving a clear "Pullback Definition" as it also is giving a clear "Timing Entry Definition".So we have simplicity and optimization on "Pullback" and "Timing" thanks to this modern and simple tool.
promotimg a very relaxed way of aproaching trading. The second issue was Timeframe interestingly Brownsfan took the topic the other day and really its so important on . life style etc. you all know I am quite scalper in futures, well on this forex research I did even come down to 15 ti