Transcription
NOAA Technical Memorandum NWS WR- 134SOLAR RADIATIONJohn A. JannuzziWestern Region HeadquartersScientific Services DivisionSa It La ke Ci ty, UtahNovember 1978UNITED STATESDEPARTMENT OF COMMERCEJuanita M. Kreps, SecretaryINATIONAL OCEANIC ANO/NATIONAL WEATHERATMOSPHERIC orge P. Cressman, Director
This Technical Memorandum has beenreviewed and is approved forpublication by Scientific ServicesDivision, Western Region.L. W. Snel lman, ChiefScientific Services DivisionWestern Region HeadquartersSalt Lake City, Utahii
CONTENTSTables and FiguresivIntroduction . . . .1I.Solar EnergyMeasuring Solar Energy .2How Man is Putting Solar Energy to Work3A.II.Using Collectors to Gather Solar(Thermal) Energy3B.Photovoltaic Conversion4C.Bioconversion5D.Wind5E.Solar Thermal Electric6F.Ocean6Solar Dependence on Weather and ClimatologyAvailability of Solar Energy7Temperature9Wind .9Bibliography .12Appendix 1 . .31Active System - Heating and Cooling31Passive System . . . . .32Solar Hot Water Systems34iii
TABLES AND FIGURES.Table 1.Radiation Conversion Factor . ··.13Table 2.Illumination Conversion Factors .13Table 3. ·Illumination/Radiation Conversion Factors13Figure I.Normal I nciden Solar Radiation at Sea Levelon very clear days, solar spectralirradiance outside the earth's atmosphere, nd black body sp ctral irradiance curve.14The Relation Between the Average Sunshine (S)expressed as a fraction of the possibleminutes and solar radiation expressed asa ratio 6f average radiation (Q) and theaverage radiation expected on a cloudlessday (Q0 ) 15Figure 3.NOAA Solar Radiation Network, January 197816Figure 4.Sketch Shows Types of Insolation and MeasuringInstruments . . .17F i g ure 5 .S i I i con So Ia r Ce I II8Figure 6.Two Common Types of Windmil Is Used for Generation of Electricity . . . .19Artist's Conception of an Ocean ThermalEnergy Conversion Plant20Figure 8.Solar Angle as Affected by Latitude (Winter)21Figure 9a.Mean Daily Solar Radiation (Langleys) January22Figure 9b.Mean Daily Solar Radiation (Langleys) February22Figure 2.Figure 7.Figure lOa. Mean Daily Solar Radiation (Langleys) March23Figure lOb. Mean Daily Solar Radiation (Langleys) Apri I23Figure I Ia. Mean Daily Solar Radiation (Langleys) May .24Figure I lb. Mean Daily Solar Radiation (Langleys) June24Figure 12a. Mean Daily Solar Radiation (Langleys) July25Figure 12b. Mean Daily Solar Radiation (Langleys) August25iv
TABLES AND FIGURES (Continued)Figure 13a.Figure 13b.Figure 14a.Figure 14b.Mean Daily Solar Radiation (Langleys)September . . . . . . . . . .26Mean Daily Solar Radiation (Langleys)October . . . . . . · . . . . . 26Mean Daily Solar Radiation (Langleys)November . . . . . . . . . . .27Mean Daily Solar Radiation (Langleys)December . . . . . . . . .27Figure 15.Mean Daily Solar Radiation (Langleys), AnnualFigure 16a.Mean Daily Solar Radiation (Langleys)Years of Record Used . . . . . . .Figure 16b.r 28a d29Mean Daily Solar Radiation (Langleys) andYears of Record Used . . . . . . .30Appendix Figure AI. Sketch of a Double-Glazed Flat Plate.Collector . . .35Appendix Figure A2. Schematic of an Active Heating andCoo I i ng System.36. .Appendix Figure A3.Passive Solar HomeAppendix Figure A4. Schematic .of an Active Solar Hot-WaterSystem . . . . . . . . . . . . . . . . . . .v3738
SOLAR RADIATIONJohn A. JannuzziScientific Services DivisionSalt Lake City, UtahINTRODUCTIONSolar energy .is becoming increasingly emphasized as an alternative tofossil fuels as.an energy source. Since the use of solar energy is verydependent on weather and climate, the National Weather Service (NWS) isincreasingly being asked to provide solar users with various weatherrelated. information There is a lot of information on solar energyavailableandmuchusefulweatherinformationfor . theuser.Unfortunately, the information is scattered among numerous sources, notall of which have been available at National Weather Service Offices.It is the purpose of this publication to be a central source of solarinformation and a reference for weather data necessary for solar users.Many publications have· bee,n examined, and portions of them have beenincorporated here for easy reference.The paper is broken down into two main parts.Section I discussesuses and methods of use of solar energy.It is intended to give NWSpersonnel a background in solar energy so that they (we) may betterserve the (our) solar users.A person well-versed in solar energy maywant to skip .this section.Section II deals with the impact of weather and climate on solar use.Weather information necessary for the user of various solar methods isdiscussed and sources of this information are given.As an overview, this paper touches on many facets of solar energy,without going into great detail on any. One requiring further detailedinformation will find the Bibliography helpful in locating adequatesources.
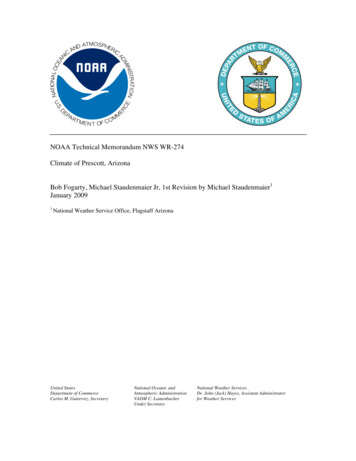
I.SOLAR ENERGYSolar energy is electromagnetic waves that travel through space atthe speed of 186,000 miles per second. These waves arrive at the top ofthe earth's atmosphere carrying energy at a near-constant rate of 444Btu's per hour for every square foot of ar a. After some of this energyis absorbed by the atmosphere, reflected by cloud cover, etc., theaverage amount over a year's time falling on a square foot of ground inthe United States is about 13% of this or 58 Btu's per hour (17 watts).Man has used solar energy throughout time; it is not new. What isnew is the various ways man is now trying to better collect, store, anduse this energy. The emphasis being placed on solar energy, as a majorenergy replacement of fossil fuels, is also new.There are various methods . of using solar energy.Some ,are directuses of the electromagnetic waves, while others are not.The direct methods use the sun's energy to heat a fluid or generateelectricity.The indirect methods take soi:ne medium that is a directresult of the sun's insolation and use it to heat a eluid or generateelectricity. The wind (direct result of differential heat ng ftqm thesun), vegetation, and an:i,mal wastes for biomass conversion (directresult of solar energy stored in plants and waste and solar energydecomposing them), ocean waves . (direct result of the wind which isgenerated by the sun), and ocean thermocline (direct result of sunheating upper layers of the ocean) are examples of indirect solarmethods.MEASURING SOLAR ENERGYSolar radiation, as all types of radiation, is measured in manydifferent units.Table 1 lists the many units used for radiation andconversion factors from one to another,One must be careful not toconfuse solar radiation with sunlight values.Sunlight is usuallymeasured in foot candles (see Table 2 for other units and conversionfactors) and is only the visible portion of the solar spectrum (Figure1). It cannot be directly converted to solar energy which includes allwavelengths of the solar spectrum. Approximate conversions may be givenfor specific conditions such as clear skies or overcast skies (see Table-2-
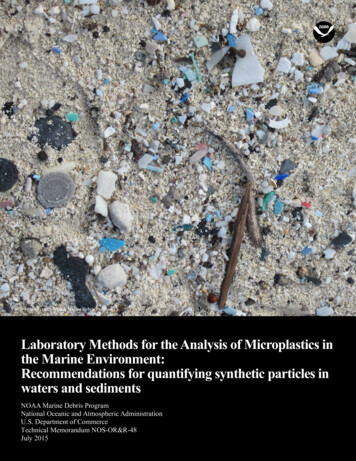
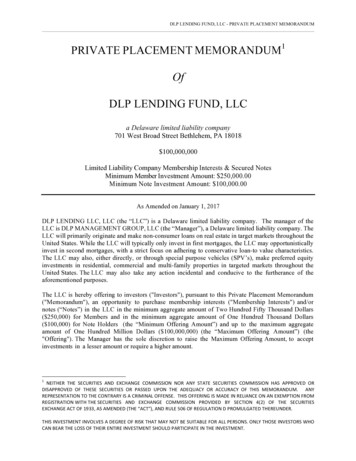
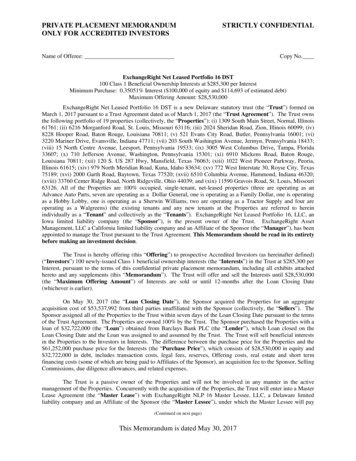
3).A graph for converting, minutes of sunshine to solar radiation isgiven in Figure 2, which is taken from the Smithsonian MeteorologicalTables.This graph may be. helpful where long-term averages are needed.Large errors may result if used on a daily basis, however, as therelationship of minutes of sunshine to total solar energy received atthe surface is very dependent on the time of day that the sunshineminutes are accumulated.Twenty minutes of sunshine at noon deliversmuch more energy than twenty minutes of sunshine near sunrise or sunset.The National Oceanic and Atmospheric Administration (NOAA) operates a38-station NWS network taking solar radiation observations at locationsshown in Figure 3.All stations now measure total radiation on ahorizontal surface with an instrument called a pyranometer (see Figure 4for sketches of solar radiation measuring instruments).Soon, allstations will also monitor the radiant energy coming from just the sun'sdisk and its immediate vicinity, called direct radiation.This isaccomplished by a pyrheliometer which tracks the sun with a telescopelike tube.Additionally, 10 stations shown on the map (Figure 3) operate apyranometer with rings that shade the instrument from the direct rays ofthe sun.These observations measure the diffused or scattered solarradiation.The sum of the direct and diffuse radiation is the total orglobal radiation.HOW MAN IS PUTTING SOLAR ENERGY TO WORKSolar energy, although largely used to provide heat via a collector, isused in many other ways.It can also involve photovoltaic energy, thedirect conversion of the sun's energy into electricity; bioconversion,solar decomposition of agricultural or municipal wastes to provide fuel;wind, harnessing wind energy to generate electricity or drive pumps;solar thermal electric, concentrating the sun's rays to obtain hightemperatures and thus generate electric power; and ocean-stored energy,utilizing temperature differences between the surface waters and oceandepths or using ocean waves. These various means are discussed below.A.Using Collectors to Gather Solar (Thermal) Energy.By using collectors, large amounts of energyand used in one smaller location. If largeare used, this energy can be saved and usedthrough extended periods of cold weatherconditions.Normally, it is too costly to-3-can be gatheredstorage devicesto produce heatand/or overcastprovide storage
facilities to handle the rare, extended, very cold periods.Thus, solar energy does not usually supply all the necessary.energy.Backup heating facilities are then used tosupplement these solar systems (the average system is 70%solar, 30% backup}.The typical solar collector is an insulated box which usessolar energy to heat a fluid (liquid or g s).(See FigureAl.)The fluid can be the medium that is to be heated, orit can be an intermediate fluid that will later transferheat to the desired medium. The selected fluid is one whichhas a large heat capacity (able· to hold a lot of heat),A system that collects heat and stores it until it is neededis an active system.One that merely best utili;;:o;es solarenergy when it s available and collects and stores it inone location is a passive system.Active systems aregenerally able to provide a larger percentage of the usersenergy needs, but are more costly to ins tall.These twosystems are explained in more detail and diagramed. inAppendix 1.The collecting fluid used in many collectors is water. For.this reason, solar energy can additionally be used to heatculinary water for residential and commercial use. This isa very efficient use of solar energy, and is presently themost cost-effective use.A typical water heating system isoutlined in Appendix 2.B.Photovoltaic ntoelectricity.AJ3 with flat-plate thermal collectors, thismethod works only when the sun is shining and receives mostenergy under direct lighting and at solar noon on a clearday.For off-peak use, battery storage is required withregulators to keep a steady flow of electricity.The basic solar cell is diagramed in Figure 5. A siliconsolarcellhasathin n-layer(phosphorous-silicon)overlaying a thin junction and p-layer (boron-silicon).When sunlight delivers energy to the p-layer, electrons areknocked out of some of the silicon atoms, leaving 11holes 11 inthe electronic structure.These free and energeticelectrons move across the junction to the n-layer and thenthrough the wire to the load, where their energy is-4-
converted to useful work.The electrons then go to the player and re-enter its electronic structure at the "holes".Solar cells are very reliable and have a long life. Nothingis consumed in the cell so it doesn't wear out.It doeslose effectiveness with time, however, as the n-layergradually clouds up reducing its ability to let light passthrough to the p-layer.This lowers the cells efficiency.The factor limiting widespread photovoltaic cell use is thecost of manufacturing the cell.The expense is due to thehandcrafting process to fabricate it.A single crystal cif extremely pure silicon is artificiallygroWn in the form of an ingot. Wafers are then cut from theingot and are polished and trimmed.The impurities arediffused into. the silicon in an oven.Finally electricalconnectors are added and the finished cells are mounted inarrays.These arrays or modules are combined to meet the particularsystem requirements.In 1976, solar-cell modules for land use were priced from 15 - 20 per peak watt, which is quite expensive· whencompared to other forms of electrical generation. Researchinto mass producing · these cells and possible use of othersemiconductors of lower production costs may bring the costsdown.·The Department of Energy's efforts are aimed atbringing the price down to .50 per peak watt by the mid1980's.c.Bioconversion.· Bioconversion uses nature's acid-producing bacteria and thesun's ·heat to anaerobically decompose organic material intogases and a liquid/ solid residue.The gases are methane,carbon dioxide, hydrogen, and traces of other gases.Of· these, methane is a combustible gas which can be burned to·produce. heat.·The slurry (residue) is a high nitrogencontent materia-l which makes an excellent fertilizer. Thus,the waste materials are turned into two useful products.D.Wind.Wind power is a transfer of the energy in the wind (l/2JAV3)to a generator (windmill) able to produce electricity.-5-
The windmill gathers this energy from the air with density( 5' ) over a large area (A) and uses batteries to store theenergy when conditions of light winds (V) exist.Figure 6shows two common types of windmills.E.Solar Thermal Electric.Normal solar collectors (flat, plate type) that use a liquidfluid operate at temperatures between freezing and boiling(0 C and 100 c). This allows ample heat collection withoutneedingahigh-pressuresystem to avoid damage fromexpansion and contraction. Special concentrating collectorsare designed to reach very high temperatures so that watercan be boiled. The steam from boiling water is then used ina compressor (steam engine) to generate electricity.F.Ocean.Ocean methods are largely experimental as they are quitecostly to be practical. The cost is in the retrieval of theenergy, even though the energy itself is abundant.Theocean acts as a large heat storage medium like those used inactive solar systems.This method uses convective currentstogenerateelectricity(see Figure7).Like theatmosphere, the ocean temperature changes with depth (warmabove, cool below). Though the atmosphere may have strongertemperature gradients, the ocean has much more heat readilyavailable for conversion than the atmosphere (specific heatsof water and air at 50 C cal/gram are .99829 and .2480cal/gram, respectively).The various methods described above all have certain advantages anddisadvantages to their usefulness. None have been seriously investigatedas energy-conversion methods in the past, because the cost per unit ofenergy was significantly higher than fossil fuel energy.Now, withfossil fuels becoming less available and more costly, solar methods arebecoming more cost-effective.This trend will continue as long asfossil fuel prices continue to rise.Additionally, the costs involvedin manufacturing solar collectors and heating systems are expected todecline in the future or at least stay near present levels despitegeneral economic inflation.This will be brought about by massproduction. Right now the demand (although increasing rapidly) is stilllow on solar devices, so most are made by hand.-6-
The most promising area of solar use for the future is in individualresidence heating (air and water) systems. Near-term increases in solarheating will be largely determined by government efforts to make it moreattractive.Initial costs of building a· home with active solar heating rather thanelectric or gas heating may be as much as 20,000.00 or more. Passivehomes (see Appendix 1, Passive Systems) also are more costly to buildthan conventional homes. Even though the pay-back period may be reducedto make it· cost-effec.tive, the initial funds must be available.Taxincentives and government encouragement through lending institutionswill·· determine: the .number of persons able to go this ·route.As ofNovember 1977,30 · states. had passed some type of tax-incentivelegislation for solar devices. Because of this uncertainty, outlooks tothe future are difficult.Since 20% of the Nation's energy is used toheat and cool homes, and solar devices on the average home provide about70% of the total heating demand, a maximum of 14% energy reduction couldbe achieved by solar homes alone.Another 8% of the national energyneed could be met by the year :Z020with large-scale processes to convertsolar energy to electric power. Research may bring photovoltaic or"solar" cells into economic reach at 500 per kilowatt by 1985.TheEnergy Research and Development Administration is developing a series ofwind machines with generating capacities from 100 kW to ·several mW(utility scale· generation).Effectiveness and cost will determine yagriculturalists and possibly by municipalities as part of wastetreatment.Ocean-thermal conversion and ocean-wave conversion arelargely experimental, a:nd cost may prevent it from being fully utilized.II.SOLAR DEPENDENCE ON WEATHER AND CLIMATOLOGYAVAILABILITY OF SOLAR ENERGYThe amount of solar energy received at a location on earth is dependenton the angle of the sun, the length of day, and transmissivity of theatmosphere.Figure 8 demonstrates how latitude affects the sunlightreceived. 'The sun is much lower in the sky at point A than point A1 Thus, the sun's rays are spread out over a larger area at point A andless heat per-square-foot is available to the earth's surface. To helpremedy this problem, a solar collector can be tilted to be perpendicularto the incoming rays and concentrate this energy.This doesn't solvethe problem entirely, however.The amount of air that the sunlightmust pass through is greater at point A than point A1 (segment AB is-7-
longer than A1 B1 ).Thus more sunlight is absorbed or reflected by1aerosols back to space at point A than point A The duration of sunlight is also less with increased latitude in thewinter.For example, on December 21st Phoenix, Arizona, (about· 33 Nlatitude) receives 9 hours 56 minutes of sunlight; Seattle Washington,(about 48 N) receives 8 hours 27 minutes of sunlight, and Fairbanks,Alaska, (about 65 N) receives 3 hours 42 minutes of sunlight.There are other factors altering this radiation. There can b a lot ofaerosols in the air to scatter the energy from natural dust and man-madepollutants.This causes diffuse radiation which. is more difficult tocollect (less efficient).This is especially t;rue of curved,concentrating collectors. They lose most of their effectiveness and areeven less efficient than flat plate collectors, und r diffuse radiation.Clouds and fog are other natural phenomena that scatter and reflect thisradiation so that the ground doesn't receive all that is possible To briefly summarize, solar \availability is affected by:(;1)2)3)4)Angle of the sun above the horizonLength of dayTransmissivity of the atmosphereCloud cover (a d type of).Solar users are then interested in the following information:Amount of solar radiation available (langl ys per day asin Figures 9-17) forecast amount, and daily observed amountsbroken down by hours.1)2)Length of day (available in sunrise/sunset tables).3) Minutes of sunshine (forecasts in detail 1 , daily observedamounts).4) Amount and type of cloud cover and its duration (detailedsky observations and climatologies are needed). Informationcan be found in aviation observations (SA's and LCD' s).1 Forecasters at Quebec Forecast Office have shown that acGurateforecasts of percent of possible sunshine can be made.Fordetails see Bulletin of American Meteorological Society, ay1978, pages 581-584.-8-
·5)· V-isibility and air- quality (forecasts, observations, andclima-tologies are needed--local forecasts and SA's and LCD'sare sources).TEMPERATURETemperature is ;i-mportant forsolar use is foi residentialdemand on the system.Ifcostly back-up heating must bemany reasons.Since a large portion ofheating, the temperature determines thethe system cannot meet the demand, moreplanned for and used.System efficiencies are also altered by the outside temperature.Eventhough collectors are insulated, they lose more heat as the outside airgets colder.· Active systems, that use. water as a collecting fluid, aresubject to freezing or. ·boiling under certain circumstances.Specialcare must be taken at these. times to avoid costly system damage. Hence,solar users are·interested in:1) Normal Temperatures (climatologies of maxima, minimadegree days).2)Extreme. Temperatures (climatology, annual LCD's).3)Observed Temperatures (from SA's, LCD's).4) Forecast Temperature (detailed local short-termforecasts and long-range outlooks).The. above information is available at most NWS offices . Detailed information for· all areas of the country isavailableatthe NationalClimatic Center(NCC)inAsheville, North Carolina.WINDWind information . is crucial to wind power generation. Not only isaverage wind important for system design, but the variability of thewind is needed.Since wind power is proportional to the cube of the-9-
wind speed, a wind machine will generate more electricity from a windthat averaged a certain speed but was sometimes higher and lower thanthat, than a wind of that con tant speed.The e ampie belowdemonstrates this:1/3 of dayg3 729123172a123 17281/3 of day1231/3 of day153 3375123 ,.---.-.172858325184Total day 1728The power generated in· a variable wind will be erratic and may beinadequately at the lower speeds and a surplus at the higher speeds.Wind has an additional effect of drawing heat away from and in ;lltratingan object not perfectly insulated. Solar collectors anq the area qeingheated (water volume or home surface area) lose more peat to theatmosphere, making the demand greater and the efficiency l er.Hence, the user needs:1) Average wind conditions and variability (from LCD's,aviation climatologies).2) Wind observations in detail for variability (gustiness,lulls, and averages from SA's and LCD's).3)Forecasts of average winds and variability (local forecasts).There are many, more-detailed publications available to theinterested person from government agencies and private concern::; forinformation not found in this paper. To understand where to go, a briefoutline of government agencies and their objective dealing with solarenergy are listed for further reference.1) Energy Research and Development Administration (ERDA).Purpose: To develop all energy sources, to make th Nationbasically self-sufficient in energy and to protect publichealth and welfare and the environment.-10-
2) National Solar Heating and Cooling Information Center(Operated by u.s. Department of Housing and Urban Development ,and.· U.S · :Oepartmerrt of Energy) Purpose: Provide aone-stop service facii'fty for.all information, domestic andforeign, technical and nontechnical, on any aspect of solar.hea,ting andcooling.3) Federal Energy Administration; Department of Health,Education, arid Welfare; Office of Consumer Affairs.Purpose:: Provide co'Q.sumers. with information regarding.energy systems -11-
BTl3L IOGRAPHYThe Mother Earth News Handbook of HomeJllade Power, Bant:am Book,1974.In MaySolar Energy for Heating and Cooling, GP0:197Y 0-228-433, EnergyResearch and Development Administration, Office of Public Affairs,Washington, D. C. 20545.Solar Energy and Your Home, April 1978, HUD-PDR-183(8), u. s. Departmentof Housing and Urban Development (HUD), National Solar Heating andCooling Information Center (NSHCIC), P. b. Box 1607, Rockv:i.lle, Maryland20850, Phone: 800-523-2929.What's New Under the Sun?Rockville, Maryland.February 1978, HUDrPDR-247(Z), HUD, NSHCIC,Passive Design Ideas for the Energy-Conscious Con9umer, HUD, NSHCIC,Rockville, Maryland.Solar Hot Water and Your Home, HUD, NSHCIC,Rockville, Maryl,and.Solar Energy System Consumer Tips, HUD, NSHCIC, Rockville, Maryland Practical and Do-It-YourselfNSHCIC, Rockville, Maryland.Pro ectsforReading List for Solar Energy, HUD, NSHCIC,Buying Solar· Fedexal ,Ener&. 00120-4, 1.85. SolarRoc v lle, Administration,Utilization,HUD,Maryland.June 1976, GPO 041-018-Solar Energy, ERDA, GPO 641-339/11.Western Region Technical Attachment (WRTA) No. 78-3, January 31, 1978,Dr. S. E. Taylor, National Weather S rvice Western Region, Sqlt LakeCity, Utah 84147.Energy from the Winds (EDM-812), NSHCIC, Roskville, Maryland.Guide to Solar Energy Programs, March 1978, U.Sr Department of Energy,DOE/ET-0036.Solar Radiation Data Sources, Applications and Network Design, April1978. u.s. Department of Energy, HCP/T5362-01).-12-
TABLE 1.RADIATION CONVERSION FACTORTo ConvertToMultiply byBtu ft- 22Btu ft2Btu ft- h-l-2 -1Btu fth12Btu ft- h,.Ly minBtu.calBtuJouleBtuBtu h-lkWhLy-?kW1un --1X4.283X10-l10- 24.522 X 10⁻³Wm -:2Ly s2.7133.155-17.537 X 10-522.520 X 1031.055 X 102.928 X 10-4w-1kWh m- 2 min -l2.930 X 10-l44.186 X 101.162 X 10- 2-1erg em -2 s -16.974X10Wm-24.186X10 4WmkWhm- 2 s-l2.778X10-7To getFromDivide.by-2Ly (langley)Ly minLy minLy s-2Jm-1TABLE 2.2ILLUMINATION CONVERSION FACTORSTo ConvertToMultiElY byfoot candlesLux10.76Lambert-2cd m-2cd mTo GetFrom·foot lambertTABLE 3.3.4262593.1416xl0 4Divide byILLill1INATION/RADIATION CONVERSION FACTORSAn accurate conversion is impossible but a rough conversion is possible whenthe energy source is known.To ConvertToWhenMultiElY bylangleys per minutefoot-candlescloudless day6,700langleys per minutefoot-candlescloudy day7,000langleys per minutefoot-candleslOOw light bulb16100langleys per minutefoot-candlescool white florescent21800langleys per minutefoot-candleswarm white florescent24900langleys per minutefoot-candlesdaylight florescent19800To getFromWhenDivide by-13-
0.240.220.20.18-.Outside Earth's Atmosphere(Area under curve .1353 w cm-2)0.16E::J.0.14 SeaLevel in very Clear Atmosphere(Area under curve .1111 w cm-2)Eu.!0.12Black Body at T . 5762 K(Area under curve .1353 w em -2)wuz {0.100 a:II-'.p-0.08 0.06IVi.sible0.04 pectrum 2 o, co, 0.0200 .20.40.60.81.01.21.41.61.82.02:2WAVELEN-GTH (SJm)Figure I. Normal Incident Solar Radiation at Sea· Level on Very Clear Days,Solar Spectral lrradiance Outside the Earth's Atmosphere at I AU, and BlackBody Spectra I I rrad iance Curve at T 5762 K (Norma I i zed to I AU). FromDaniels (1973).2.42.6
Solar ConstantOne solar constant is the amount of radiation striking a normally orientedsurface above the earth's atmosphere. Radiation at the ground is usuallyless than the constant.-21 solar constant* 1353.WmmW em-2w ft- 2135.3(Air mass zero)125.7-2 hr -1-1B.T.U. ft -2 sec-2erg emsec -1429.2B.T.U. ft0.11921.353xl06-1langley min-2-1cal emsechp m-2 (horsepower persq. meter)1.9370.03231.81I*Value from. solar Electromagnetic Radiation May 1971 NASA Special PublicationSP-8005. The accep ed value previous to 1971 was 3% higher than those givenabove.l . 3.6.4The relation between the average sunshine(S) expressed as a fraction of the possible minutes and solar radiation expressedas a ratio of average radiation (Q) andthe average radiation expected on a cloudless day (Qo). (Smithsonian Meteorologicaltables, 6th ed. p. 440.).z00.2.6. sFigure 2-15-.8L.
Bismark@0 LanderCity .00 BolderGrand JunctionOmahar--------- Dodge CityVegasI1-'Alblf!1-erque(j\I0 MidlandGil0GLOBALJ)J FFUSE0 -J)J-RECTIi] Fairbanks,li} Honolulu,} !sanAKJuan, P.R.HI{ ]Guam, Marianas Isl.Figure 3.NOAA Solar Radiation Network, January 1978.
I----1--MEASURES --o- GLOBAL DIRECT PLUS DIFFUSE RADIATION ON A HORIZONTAL SURFACEPYRANOMETERdc J. S DIFFUSE SCATTERED BEAM SOLAR RADIATION--f'J\E.P.S\) E.PYRANOMETER WITHSHADOW BAND-/OIRECi PARALLEL BEAM RADIATION FROM THE SUN/ l:J-PLUS SOMEc:,\) CIRCUM SOLAR. c,.'l" THAT PORTION OF SCATTERED SOLAR RADIATIONPARALLEL TO THE DIRECT BEAM-./ ·.·/.,; 1;1 ? - -/;'A L.I If\.-. \.II-'"-.JIG. '1.PYRHELIOMETERTRACKING MOUNT KEEPSINSTRUMENT ALIGNEDWITH THE SUNII,, tr--'-. vQ, c« ''''----\\ \'ATMOSPHERE. AMEASUREOF THE CLARITY OF THEATMOSPHERE TURBIDITY/\\;-- IHORIZONFigure 4. The Environmental and Resource Assessment Program has established anationwide network to measure insolation. This sketch shows types ofinsolation and measuring instruments.
--- ---Wire-·-·- .Sunligh tt. //; 1li 00ILo adN-Layer ·-\ Micron Thick--. (-I.,.P-Layer 0.,016 Inch Thickl'- .Junction ·"': ··-··.'. -.'·o· I'.-". ·.-a0\o-0.,/. 1-··''\ o,-.'0Wire0 Silicon Atom Electrono HoleFigure 5. Silicon Solar Cell.0
.II-'\.0IFigure 6.Two common types of windmills used for generation of electricity.type and right is a vertical axis wind turbine.Left is a propeller
AFTCOL WATEREXHAUSTSCOLOWATEREXHAUSTS-·· .--.---------- - - - - -c --Figure 7. --- -- .; :.:: :,Artist's Conception of an Ocean Thermal Energy Conversion-20-Plant
A,B. un's. B 1 Urys EARTHATMOSPHERESegment AB A 'B 1Figure 8.Solar Angle as Affected by Latitude (Winter).-21-
Mean Daily Soler Radiation, Monthly and AnnualFigur 9a.Figure %.-22-
Mean Daily Solar Radiation, Monthly and AnnualWeather Bureau·Figure lOb.-23-
Mean Daily Solar Radiation, Monthly and AnnualFigure I Ia.Weather Bureau·-!- .-24-
Mean Daily Solar Radiation, Monthly and AnnualFi gure 12b.-25-
Mean Daily Solar Radiation. Monthly and AnnualFigure 13b.-26-
Mun Daily· Solll' Radiation, Monthly and AnnualFigure 14b.-27-
FIGURE 15.Mean Daily Solar Radiation (Langleys), Annual.Weather Bureau!c !!. !!I:I!. 0. g. !0. c!!.IN00IThese charts and table are based on all usable so
Salt Lake City, Utah INTRODUCTION . culinary water for residential and commercial use. This is a very efficient use of solar energy, and is presently the most cost-effective use. . energy under direct lighting and at solar noon on a clear da