Transcription
IEEE JOURNAL OF BIOMEDICAL AND HEALTH INFORMATICS, VOL. XX, NO. XX, XXXX 2021Predicting the macronutrient composition ofmixed meals from dietary biomarkers in bloodAnurag Das, Bobak Mortazavi, Seyedhooman Sajjadi, Theodora Chaspari, Laura E. Ruebush, Nicolaas E.Deutz, Gerard L. Cote, Ricardo Gutierrez-OsunaAbstract— Diet monitoring is an essential interventioncomponent for a number of diseases, from type 2 diabetesto cardiovascular diseases. However, current methods fordiet monitoring are burdensome and often inaccurate. Inprior work, we showed that continuous glucose monitors(CGMs) may be used to predict the macronutrients in ameal (e.g., carbohydrates, protein, and fat) by analyzing theshape of the post-prandial glucose response. The objectiveof this new study was to examine a number of additionaldietary biomarkers in blood by their ability to improvethe prediction of meal macronutrients, compared to usingCGMs alone. As our experimental method, we conducted anutritional study where (n 10) participants consumed ninedifferent mixed meals with varied but known macronutrientamounts, and we analyzed the concentration of 33 dietarybiomarkers (including amino acids and their combinations,insulin, triglycerides, and 3 independent measures of glucose) at various times post-prandially. As our computational method, we built machine learning models to predictthe macronutrient amounts from (1) individual biomarkersand (2) their combinations. The major result from this workis that the additional blood biomarkers provide complementary information, and more importantly, achieve higherprediction performance for the three macronutrients interms of normalized root mean squared error (carbohydrates: 22.9%; protein: 23.4%; fat: 32.3%) than CGMs alone(carbohydrates: 28.9%, t(18) 1.64,p 0.060; protein: 46.4%,t(18) 5.38,p 0.001; fat: 40.0%, t(18) 2.09, p 0.025). Ourmain conclusion is that augmenting CGMs to measurethese additional dietary biomarkers improves macronutrient prediction performance, and may ultimately lead to thedevelopment of automated methods to monitor monitornutritional intake. This work is significant to biomedicalresearch as it provides a potential solution to the longstanding problem of diet monitoring, facilitating new interventions for a number of diseases.Index Terms— Continuous glucose monitors, biomarkers, diet monitoring, macronutrients, machine learningManuscript submitted on 6/14/2021. This work was supported by theNSF Engineering Research Center for Precise Advanced Technologiesand Health Systems for Underserved Populations (PATHS-UP; Award#1648451), NSF-IIS award #2014475, and a grant from the KlebergFoundation.A. Das, B. Mortazavi, S. Sajjadi, T. Chaspari and R. Gutierrez-Osunaare with the Department of Computer Science and Engineering, TexasA&M University. L. E. Ruebush and N. E. Deutz are with the Center forTranslational Research in Aging and Longevity, Texas A&M University.G. L. Cote is with the Department of Biomedical Engineering, TexasA&M UniversityI. I NTRODUCTIONPOOR diet is a major contributor to the development ofchronic diseases, from type 2 diabetes to heart disease [1].Thus, monitoring and modifying food intake is an essentialcomponent of many clinical interventions. However, conventional methods for diet monitoring rely on self-report tools(e.g., food diaries, 24-hour recall), which are problematic.For example, food diaries require manual input, which isburdensome [2] and often leads to low adherence rates [3].Further, 24-hour records suffer from memory recall, whichcan lead to severe over and under-reporting [4]. To address thisissue, various wearable sensing techniques (e.g., microphones,accelerometers) are being explored to detect eating behaviorssuch as hand-to-mouth movements and chewing/swallowing[5]–[7]. These approaches can be used to detect moments offood intake, but have limited ability to estimate the nutritional content of foods. The latter requires measuring dietarybiomarkers associated with consumption of various nutrients.As a first step in this direction, in recent work [8], [9]we proposed using continuous glucose monitors (CGMs) tomonitor food intake. CGMs generally consist of a smallelectrode inserted under the skin to measure glucose in theinterstitial fluid, and a transmitter that sends the informationto a monitoring device. Our rationale for using CGMs fordiet monitoring was based on the observation that changesin blood glucose levels after a meal, also known as thepost-prandial glucose response (PPGR), depend on the mealmacronutrients (e.g., carbohydrates, protein, fat). Though themajor determinant of post-prandial glucose is the amount ofcarbohydrates (CHO), adding protein or fat to a meal generallyyields smaller spikes and lengthier responses [10], [11]. Totest this rationale, we conducted a study in which 15 healthyparticipants consumed nine different meals over the course of2-3 weeks while wearing a CGM. Each meal had a differentbut known amount of CHO, protein, and fat. Then, we trainedseveral machine learning models to predict the macronutrientamounts (i.e., grams of CHO and protein, and milliliters offat) from the PPGRs. The best performing models were ableto predict the macronutrient amounts with a normalized rootmean squared error (NRMSE) of 22% for CHO, 47% forprotein and 40% for fat, a promising result given the largeinter-individual differences in food metabolism [12].As a logical next step, the aim of this work was to examine whether measuring additional blood biomarkers wouldimprove prediction performance for the three macronutrients,1
2IEEE JOURNAL OF BIOMEDICAL AND HEALTH INFORMATICS, VOL. XX, NO. XX, XXXX 2021when compared to using only glucose measurements fromCGMs. To answer this question, for 10 of the participants inthe abovementioned study, we also analyzed blood samples atvarious times during the post-prandial period to measure theplasma concentration of three additional types of biomarkers:insulin, triglycerides, and amino acids. Further, since CGMsmeasure glucose in interstitial fluid, we collected two additional glucose measures in venous blood for comparison,via liquid chromatography (LC) and fingerstick blood glucosemeasurement. Our working hypothesis was that the additionof amino acids and triglycerides would primarily improve theprediction performance for protein and fat, respectively. Usingextreme gradient boosted decision trees (XGBoost) [13] as theunderlying prediction model, we performed a series of computational analyses to predict meal macronutrients. These analyses consistently indicate that the additional blood biomarkersprovide complementary information to each other and, moreimportantly, achieve higher prediction accuracy for the threemacronutrients (CHO: 22.9%; protein: 23.4%; fat: 32.3%)than CGMs alone (CHO: 28.9%, t(18) 1.64,p 0.060; protein:46.4%, t(18) 5.38,p 0.001; fat: 40.0%, t(18) 2.09,p 0.025;one-tailed t-test).This work is novel in several respects. First, to our knowledge, the problem of predicting meal macronutrients fromblood biomarkers has never been examined, with the exceptionof our recent prior work [8], [9]. However, our prior workfocused on glucose responses from CGMs, whereas the presentwork evaluates 32 additional biomarkers by their ability topredict macronutrients. Second, through a series of complementary analyses, we identify (1) the most relevant individualbiomarkers, (2) the most relevant combinations of biomarkers,and (3) the most relevant regions in the postprandial responseof these biomarkers. Third, our work is related to (but distinctfrom) research on the artificial pancreas (AP) [14]. In bothcases, the goal is to infer food intake. In the artificial pancreas,this information is used to control an insulin pump, whichadministers doses of insulin according to a pre-establishedinsulin-to-carb ratio. Thus, the artificial pancreas is concernedwith estimating the amount of CHO. In contrast, our workaims to estimate not only CHO, but also fat and protein. Inaddition, being a control problem, the artificial pancreas is verysensitive to delays and lags: to prevent large glucose responsesafter a meal, an AP must make a decision based on the earlypart of the glucose response. In contrast, our work can affordto exploit information in the entire glucose response curve topredict the full macronutrient composition of a meal. Finally,our work is related to (but also distinct from) the personalizednutrition project of Zeevi et al. [12], which used machinelearning models to predict the post-prandial glucose responseof different meals; see section II-A. In contrast, we aim tosolve the inverse problem: predicting meal macronutrientsfrom post-prandial responses.Results from this work suggest that expanding the sensingcapabilities of existing indwelling or implantable CGMs [15]to measure these additional dietary biomarkers would makeit possible to monitor nutritional intake in an automatedfashion, removing burden from participants while providinga wealth of nutritional and behavioral information to themand their healthcare providers. Towards this end, our grouphas proposed an implantable barcode-like sensor the size ofa grain of rice that, once inserted, could be probed opticallywith a watch-type device and used to noninvasively monitornot only glucose but other dietary biomarkers such as the onespresented here in free living conditions [16]. These data couldthen be analyzed on the watch, or transmitted to a mobiledevice or to the cloud, to detect moments of meal intake andpredict macronutrient composition of those meals.Note that measuring these biomarkers using current standardmethods is complicated as it requires extraction of the fluid,such as either a blood draw and centrifugation to get plasma, ordialysis membrane extraction for interstitial fluid, followed bythe use of well-established but relatively sophisticated benchtop analytical instruments. Though the future barcode sensorwould facilitate the measurement of these biomarkers, development of the sensor itself is nontrivial as both the recognitionelements (e.g. aptamers, antibodies) and transduction methodsthrough tissue (e.g. fluorescence, phosphorescence lifetime)need to be determined and optimized for each biomarker.II. R ELATED WORKA. Effect of macronutrients on postprandial glucoseA number of studies have examined the effect of mealmacronutrient amount and composition on PPGRs. The maindeterminant of postprandial glucose is the amount and type ofCHO. However, other macronutrients that are present in mixedmeals also contribute to the glucose response. Specifically,adding protein, fat or dietary fiber to a meal reduces and/orslows down the glucose response [10], [11], typically due togastric emptying or endogenous secretion of insulin [17]–[19].More recent work has focused on understanding individualdifferences in food metabolism. In a landmark study, Zeeviet al. [12] used CGMs to track the glucose response of800 participants while participants kept detailed records oftheir diet. The authors found high inter-personal variabilityin the glucose response to identical meals, which puts intoquestion the utility of universal dietary recommendations. Toaddress this issue, the authors developed a machine-learningmodel that could predict the glucose response of a meal foreach participant by accounting for individual factors (e.g.,anthropometric variables, blood panels, gut microbiota). Whentested on an independent cohort of 100 participants, the modelwas able to generate personalized diets that led to reducedpostprandial hyper-glycemia.B. Diet monitoring technologyTechnology may enable automatic monitoring of food intake, reducing participant burden and avoiding errors due tomanual food tracking. Three broad types of technologies havebeen used for monitoring food intake: wearable sensors, smartutensils and computer vision. As an example, food intake canbe captured by recording chewing sounds with a microphoneand then performing acoustic analysis [5], [20]. Piezoelectricsensors have also been used for detecting food intake fromchewing [6]. After chewing, swallowing is the next step offood consumption, and a number of wearable sensors havebeen used for detecting swallowing sounds based on acoustic
AUTHOR et al.: PREPARATION OF PAPERS FOR IEEE TRANSACTIONS AND JOURNALS (FEBRUARY 2017)analysis [21]. Finally, a few studies have attempted to detectfood intake from both chewing and swallowing sounds [22],[23]. A number of smart devices, such as smart watches andsmart utensils, have also been used to detect food types andthe amount of food consumed [7], [24]. The advantage tousing smart watches with inertial sensing is that they do notinterfere with user privacy, compared to other approaches suchas microphones embedded in earbuds [25]. Smart utensils(e.g., smart forks) have also been used for identifying foodsconsumed [26], and commercial products also exist (e.g.,HAPIfork). Finally, computer vision techniques have beendeveloped to classify foods, predict food constituents andestimate food portions from images [27]–[29]. Further, agrowing number of commercial apps are using computer visiontechniques to estimate nutrition from food photographs, e.g.,Lose It!, CalorieMama, Snaq, Undermyfork, gocarb, and several software libraries for food image recognition are availablefor integration with mobile apps, e.g., bite.ai, FoodAI.C. Dietary biomarkersVarious dietary biomarkers have been associated withmacronutrients, foods and dietary components. Sugars such asglucose or fructose are associated with CHO and contribute toenergy intake. Unfortunately, sugar can be introduced througha number of processed foods and hidden sources, which makesaccounting for the amount of sugar consumed challenging.Instead, a biomarker that could estimate the amount of sugarin food would be more useful. To this end, urinary sucrose andfructose have been identified as dietary biomarkers for sugarintake [30]. For the consumption of saturated fats, blood lipidssuch as low density cholesterol (LDL) and high density cholesterol (HDL) have been identified as predictive biomarkers [31].Plasma cholesterol and triglyceride (TG) levels may also beassociated with dietary fiber intake; however, some studiesreveal conflicting results. Specific fatty acids such as monounsaturated (MUFA), poly-unsaturated (PUFA) and saturatedfatty acids (SFA) are hard to capture and current methods ofestimation are costly and time-consuming [32]. To measuredietary protein intake, urinary nitrogen has been identified as apotential biomarker [33]. Other potential biomarkers of proteinintake include creatinine, taurine, 1-methlyhistidine and 3methylhistidine [34]. These biomarkers are specific to meatintake and are excreted via urine.III. M ETHODSThis section describes the experimental dataset used forthe study, and the data preprocessing techniques to extractinformation from postprandial responses and reduce individualdifferences. Further, we describe the prediction model (XGBoost) that was used throughout all subsequent analyses, toanswer this study’s overarching question: to what extent doadditional biomarkers (i.e., beyond interstitial glucose fromCGMs) improve prediction of meal macronutrients?A. Dietary study datasetTo assess the influence of meal macronutrients on postprandial responses for glucose and other biomarkers, we recruited15 healthy participants (not diagnosed with pre-diabetes or3TABLE I: Macronutrient amounts of the 9 meals in the 53030153030603060Fat(ml)132613262652262652type 2 diabetes) between the ages of 60-85 and Body MassIndex (BMI) in the range of 25-35. Each participant took partin nine study days where they consumed a predefined mealon each day based on a randomized design. The participantwas asked to follow the same protocol on each day and theonly difference between any two days was the macronutrientsof the meal consumed. The meal was prepared as a liquiddrink mixed with a pudding base (Jell-O Vanilla, Kraft Food,IL, USA) containing 0.75 g CHO and with different levels ofprotein, CHO and fat; see Table I . In what follows, we usethe notation CxPxFx to denote the amount of macronutrientsin a meal, where x can take values 1 (low), 2 (medium) and 3(high). Whey protein (BiPro, Agropur, MN, USA) was used asthe protein nutrient, maltodextrin (Polycose, Abbott Nutrition,IL, USA) as the CHO nutrient, and sunflower oil (GreatValue, Wal-mart, AZ, USA) as the fat nutrient. Meals wereprepared early on each study day. The protein hydrolysates andmaltodextrin were dissolved in 250 ml water, mixed with thepudding base, and then thoroughly mixed with sunflower oilwithin 30 minutes of ingestion. Each participant was asked tofast for eight hours before consuming the meal, so that the firstreading captured would be their fasting biomarker levels. Afterconsuming the meal, the participant remained in a sedentarystate for the next eight hours, so that there was no effect ofphysical activity on postprandial responses. Informed consentwas obtained from all participants involved in the study. Thisstudy was approved by the Texas A&M Institutional ReviewBoard (IRB #2017-0886F; approval date 12/06/2017).On the first day of the study, an Abbott Freestyle LibrePro CGM was placed on the participant’s upper arm, and wasreplaced as needed. This CGM device takes glucose readingsevery 15 minutes for up to 14 days. The concentration ofthe remaining biomarkers was measured by first extractingblood samples via venipuncture at intervals of 15 minutesfor the first hour, 30 minutes for the second hour and 60minutes for the remainder of the study day. However, dueto budgetary constraints, blood samples were analyzed foronly 10 subjects. Additionally, the response of three mealswere missing due to experimental errors or CGM malfunction,leading to a total of data from 87 meals for analysis across the10 subjects. Table II provides a list of all biomarkers measuredin the study. The first 24 biomarkers are individual aminoacids. Biomarkers 25-27 represent different combinations ofamino acids commonly used in nutritional studies. Biomarkers31-33 represent three independent measures of glucose fromvenipuncture (LC-glucose), fingerstick (Stick-glucose) and interstitial fluid (CGM-glucose).
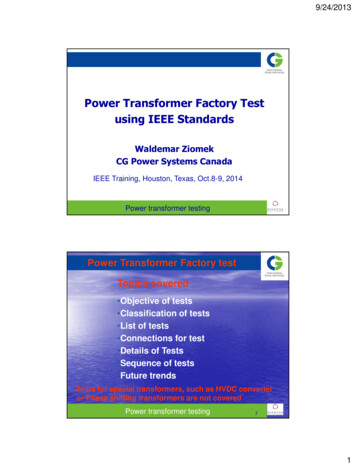
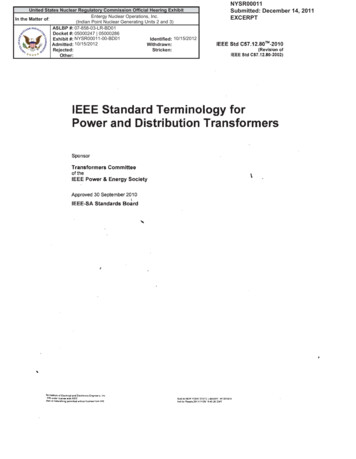
IEEE JOURNAL OF BIOMEDICAL AND HEALTH INFORMATICS, VOL. XX, NO. XX, XXXX 2021TABLE II: List of biomarkers measured in the ineOrnithineHistidineLysineTyrosineBranched Chain Amino Acids1Essential Amino Acids2Non-Essential Amino Acids3Sum Amino Acids4Liquid Chromatography (LC) insulinLC triglyceridesLC glucose (venous blood)Finger stick glucose (venous blood)CGM glucose (interstitial M-glucoseVenipuncture blood samples were collected in pre-chilled,EDTA or li-heparinized tubes (Becton Dickinson Vacutainersystem, Franklin Lakes, NJ, USA) and kept on ice. Plasmawas obtained by centrifugation of whole blood at 4 C for 10min at 3120 g, and was aliquoted with vortexing to tubescontaining either 0.1 vol of 33% (w/w) trichloroacetic acidor the residue after evaporation of 0.17 vol of 33% (w/w)5-sulfosalicylic dihydrate to denature proteins. All sampleswere frozen in liquid nitrogen and stored at -80 C untilanalysis. All venipuncture biomarker analyses were performedin plasma. Insulin was measured with an electrochemiluminescent immunoassay, and glucose and triglycerides withstandardized enzymatic assays, all assessed by LabCORP. Thefingerstick glucose readings were analysed using using reagenttest strips and a point of care testing glucometer (Accu-Chek Aviva, Roche). Plasma amino acids were analyzed batchwisewith liquid chromatography with tandem mass spectrometry(LC/MS/MS), as previously described [35].B. Feature extractionA prototypical biomarker response is shown in Figure 1; itfeatures an initial rise, reaches a peak and then finally returns1 Branchedchain amino acids are the sum of LEU, ILE and VAL.2 Essential amino acids are defined as the sum of HIS, ILE, LEU, LYS,MET, PHE, THR, TRP and VAL.3 Non-essential amino acids are defined as ASP, GLU, hPRO, ASN, GLN,CIT, SER, GLY, ARG, t-MHIS, ALA, TAU, PRO, ORN and TYR.4 Sum amino acids (SUMAA) is the sum of all amino acids in Table IIBlood glucose4TimeFig. 1: gAUC features extracted using 5 Gaussian kernels. Thered curve represents the post-prandial response of a biomarker,and the shaded curves represent a family of Gaussian kernels.Each gAUC feature is the weighted average of the biomarkerconcentration at a given time period, weighted by the kernel.to baseline. Actual biomarker responses are illustrated later–see Figure 3. To capture the shape of the response, we placea family of Gaussian kernels uniformly over time, as shownin Figure 1. Using these kernels, we then calculate the areaunder the curve (AUC) of the biomarker response, which werefer to as Gaussian area-under-the-curve (gAUC) as:Z T(t Tk )21exp(1)x(k) [b(t) b(0)] 2σk22πσk0where b(t) is the biomarker response over time, x(k) is thek-th gAUC feature computed from b(t), T is the duration ofpostprandial period (8 hours in our study), and Tk representsthe time at which the Gaussian kernel is centered with a spreadof σk2 . These gAUC features capture information related to theinitial time to peak, duration of elevated glucose level and timeof return to baseline level. For consistency with our prior work[9], we use a combination of 3 and 5 kernels to extract featuresfrom the biomarker responses, as we found this combinationled to the best performance5 . As a final pre-processing step,and following our prior work [9], we normalize the gAUCfeatures of each participant using z-score normalization, i.e.,we subtract the mean from each gAUC feature and divideby its standard deviation. Note that we also subtract thebiomarker reading prior to consuming a meal b(t 0) fromthe postprandial biomarker response of the meal. The rationalebehind using a baseline correction step is that two individualsmay have different responses to the same meal owing to theirdifferent fasting levels. A baseline correction step ensures thatthere is no effect of fasting level on the overall response. Thebiomarker response is therefore represented as relative to thefasting level instead of an absolute value.C. Macronutrient prediction modelOnce the gAUC features are generated, we predict theamount of each macronutrient by means of eXtreme GradientBoosting (XGBoost) [13], a machine learning algorithm thathas achieved state-of-the-art results on a number of domains,such as web text classification, customer behavior prediction5 Gaussian centers are placed evenly across the 8-hour period followingmeal intake, i.e., Tk {0h, 4h, 8h} for the 3-Gaussian family, and Tk {0h, 2h, 4h, 6h, 8h} for the 5-Gaussian family. To ensure that the 95%confidence interval of the Gaussian kernel aligns with these time intervals,we set the standard deviation of the Gaussian to σk σ 8/n/1.96, wheren is the number of kernels. This results in σ 82min for the 3-Gaussianfamily and σ 49min for the 5-Gaussian family.
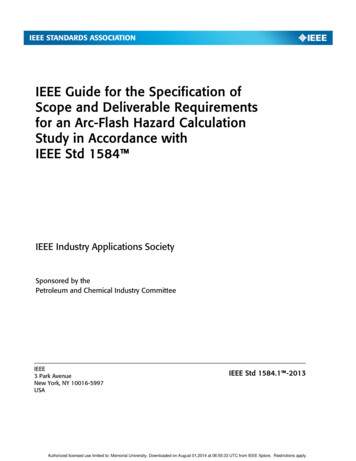
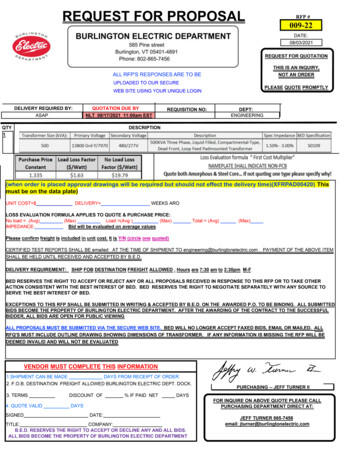
AUTHOR et al.: PREPARATION OF PAPERS FOR IEEE TRANSACTIONS AND JOURNALS (FEBRUARY 2017)and product categorization. XGBoost uses an ensemble ofweak learners (regression trees) to obtain a strong learner usingan iterative process. Starting with one regression tree trainedto model the entire data, XGBoost iteratively adds one moreregression tree to the ensemble in order to reduce the residualobtained from the previous set of trees using gradient descent.Following [13], XGBoost generates a prediction by adding theoutputs from all the trees in the ensemble:yˆi KXfk (xi )(2)k 1where yˆi is the prediction for input xi , and fk is the k thregression tree in the ensemble. The model is trained tooptimize the objective function:XXL l(yi , yˆi ) Ω(fk )(3)ikwhere l is the loss function between the ground truth yiand the prediction yˆi , and Ω is a regularization term thatpenalizes the weights of the model from becoming very large,and therefore prevents overfitting:1(4)Ω(fk ) γT λ w 22where T is the number of leaves in the tree, w representsthe scores of the leaves, and γ and λ are regularizationparameters. At each iteration t, a new regression tree ft isadded to reduce the loss:XL(t) l(yi , (yˆi (t 1) ft (xi ))) Ω(ft )(5)iWe use XGBoost for all the experiments in the manuscript.Because XGBoost is based upon decision trees, the impactof the features provided have easy-to-interpret relationshipswith the predicted regression values. We train a separate modelto predict each of the macronutrients (CHO, protein, fat). Tofurther avoid overfitting and assess the generalization capabilities of the model, we use a leave-one-subject-out procedureto evaluate the model, i.e. we train on data from 9 subjects,then test on the 10th subject. To report the performance of themodel, we use normalized root mean squared error (NRMSE)between the predicted and ground truth macronutrients:11 XN RM SE ((y ŷ)2 /y 2 ) 2(6)NFor hyperparameter tuning6 , we use the following crossvalidation procedure: given a total of 10 subjects, we use 8subjects for training, the 9th subject for validation and the10th subject for testing. A model is trained on 8 subjects andthen tested on the validation subject using all combinations ofhyperparameters. Keeping the test subject fixed, we repeat thisprocess for all combinations of train and validation subjectsand all hyperparameter combinations. The set of hyperparameters that have the lowest NRMSE across all validation subjectsis then chosen for testing. In our experiments, we optimize6 We used the XGBoost (https://xgboost.readthedocs.io) package implemented in Python. For hyperparameter tuning, we wrote our own code usingnested for loops instead of using existing packages5two hyperparameters, the maximum depth of tree (n 2, 3)and the maximum number of trees (m 20, 30), and set thelearning rate to η 0.1. We limited the depth of the trees andnumber of trees to prevent overfitting, relative to the numberof features extracted for each meal and number of meals.IV. R ESULTSA. Impact of macronutrients’ amounts on biomarkerconcentrationsIn a first analysis, we examine how increasing amountsof macronutrients affect the postprandial response for thedifferent biomarkers. Results are summarized in Figure 2.The first row shows the average AUC for venipuncture bloodglucose (LC-glucose) as we increase the amount of CHO,protein, and fat. We observe a marked increase in the AUCas the amount of CHO increases (a correlation coefficient r 0.65), and a smaller increase for proteins and fats (r 0.24and r 0.03, respectively), a result that is consistent with ourearlier studies showing predicting macronutrients from CGMsis easier for CHO than for fat and protein, in that order [8], [9].This result also confirms that LC-glucose responds maximallyto increases in consumption of CHO, as one might expect. Thesecond row in Figure 2 illustrates the corresponding effect foramino acids, in this case using Leucine (LEU) as an example.The greatest increase in AUC arises from consuming mealswith increasing amounts of protein (a correlation coefficient r 0.68), which suggests that the postprandial levels of LEU aremostly affected by intake of protein, as we had hypothesized,and only minimally by intake of CHO and fats (r 0.21 andr 0.24, respectively). The third row of Figure 2 illustratesthe average AUC of triglycerides after consuming meals withdifferent amounts of macronutrients. In this case, we note thatthe postprandial levels of triglycerides are associated mainlywith fat intake (r 0.55), but also with the amount of CHO (r 0.28) and protein (r 0.35). However, the largest increaseis seen for fats, which suggests that fat content in a meal isthe most important determinant of post-prandial triglycerides,as we had also hypothesized. Finally, the fourth row in Figure2 shows the average AUC for insulin as a function of themacronutrients. The three macronutrients have a marked effect,with CHO showing the strongest influence (as one mightalso expect). Altogether, these results suggest that the fourbiomarkers provide information that is complementary aboutthe amount of macronutrients in the meal, which providessupport for the main objective of this work.Next, we analyze the shape of the post-prandial biomarkerresponse for different amounts of macronutrients. Figure 3(a)shows the LC-glucose response (averaged across subjects) formeals with low, medium and high amount of CHO. We observethat the corresponding increases in the AUC are largely due toan increase in the time to return to baseline, but that the peak ofthe response does not change significantly. Figure 3(b) showsthe average response for Leucine as the amount of proteinis increased. In contrast with LC-glucose, the correspondingincreases in the AUC are due to the combined effect ofincreases in the peak of the response and in the time to returnto baseline. Similar results are obtained for triglycerides withrespect to increases in fat –see Figure 3(c), and for insulin with
IEEE JOURNAL OF BIOMEDICAL AND HEALTH INFORMATICS, VOL. XX, NO. XX, XXXX 2021r: 0.24*(a)r: 0.3**1000LC-insulin (uIU/dL) LC-TG (mg/dL)2000100006000400020000C2C3P1r: 0.21LEU (uM)6000400020000C1C1C2P2P3F1r: 0.68***C3P1r: 0.28*P2F2F3r: 0.24*P3F1r: 0.35**F2F3r: 0.55***08060C1C2C3P1r: 0.4***P2P3F1r: 0.26*F2F3r: 0.2140200C1C2C3P1P2P3F1F2F3Fig. 2: Area under the curve of three biomarker res
2 IEEE JOURNAL OF BIOMEDICAL AND HEALTH INFORMATICS, VOL. XX, NO. XX, XXXX 2021 when compared to using only glucose measurements from CGMs. To answer this question, for 10 of the participants in the abovementioned study, we also analyzed blood samples at var