Transcription
International Journal of Scientific & Engineering Research, Volume 6, Issue 5, May-2015ISSN 2229-5518110Application of DMAIC for Process Industry: A Case StudyVikas Kumar, M.Tech Scholar, HEC Jagadhri, Yamunanagar-135003Pardeep Kumar, Assistant Professor, ME Dept., HEC JagadhriRussi Kamboj, Assistant Professor, ME Dept., HEC JagadhriAbstractThe present work deals with application of DMAIC for minimization of sand casting defects in aprocess industry. DMAIC approach is justified when root cause of defect is not traceable. Atpresent, global and competitive environment, foundary industries need to perform efficientlywith minimum number of rejection in their manufacturing products. For better improvement inthe casting quality, first of all finding the root causes of occurrence of defects blow hole in thecasting process and taking necessary step to reduces defects and hence rejection in casting. Sixsigma is more than a quantitative statistical measure of processes; it embraces every aspect ofwork, using a disciplined, fact based approach of problem-solving.Many time defects occur due to variation in the process parameter which are very difficult todetect. In the present work the metal casting process is analysis and minimised by using DMAIC(Define, Measure, Analysis, Improve, and Control) approach. Through a case study in a mediumscale faundary, the present work formulate a comprehensive strategy of six sigma inindianfoundary. This study has significantly increase the efficiency of foundry industry andreduce scrap and waste in sand casting process which improve the production efficiency.Anumber of experiments are carried out to validate the results which indicate that the cost ofexperimentation will be less, in comparison to the gain or profit of the company.The resultsachieved shows that the rejection due to blow hole defects has been reduced from 5.83% to2.04% which saved the cost of Rs 23828/- monthly (for continuous four months), in a turnover of60 lakhs.IJSERINTRODUCTION:Present study was done at Sigmamethodology and Selection of toolsand techniques for problem solving,because the rejection rate is very high.The present case study deals withreduction of rejection due to castingdefects in a foundry industry. Theindustry is making cast iron castingsof submersible pumps componentssuch as Upper housing, Motor Pulley,Mini Chaff cutter wheel\Hand wheelin large scale and having rejection inthe form of Blow hole, Misrun, andslag inclusions.The DMAIC is both a philosophy anda methodology that improves qualityby analyzing data, to find root causeof quality problems and to emanufacturingandbusiness,processes such as product design andsupply chain management. It is abusiness improvement strategy usedto improve profitability to drive outwaste in business process and toimprove the efficiency of all operationthat meet or exceed customer’s needsand expectation. DMAIC is aIJSER 2015http://www.ijser.org
International Journal of Scientific & Engineering Research, Volume 6, Issue 5, May-2015ISSN 2229-5518customer-focused program wherecross functional teams works onproject aimed at improving customersatisfaction.LITERATURE REVIEWThe basic concept behind the DMAICapproach is to reduce product andprocess variation and conducted acase study at carriage and wagonworks. Rejection statistics of axlewere collected and critical causeswere identified for corrective actions.Then, suggestions were implementedand rejections thereafter collected andcompared with the previous rejectionsand found there were considerableimprovements. The results achievedwere demonstrated using Paretodiagrams and it was found that 5.9%of rejections were reduced.[14] The(DMAIC) quality technique was firstapplied in manufacturing operationsand rapidly expanded to differentfunctional areas such as marketing,engineering,purchasingandservicing. The company Whirlpoolhas increased its quality by 10% byadopting DMAIC technique.[12]thatDMAIC is a quality improvementprocess which solves customerproblems. It is a way to focusemployees on quality and establishinga common language across thecompany. It also creates clearlydefined performance goals.[13] Thestudy on implementing DMAIC basedsix sigma approaches in order toreduce defects and increase six sigmalevels in sand casting process. Theydefined step by step guide using111DMAIC, which describes overalldecline of defect rejection and inprocess, sigma level increased 3.32 to3.47.[1]PROBLEM FORMULATIONAll processes the smallest variationin quality of raw material, operatorbehavior, production conditions andother factors can result in acumulative variation (defects) in thequality of the finished product.DMAIC approach aims to eliminatethese variations and to establishpractices resulting in a consistentlyhigh quality product. Therefore, avital part of DMAIC work is to defineand measure variation with the intentof discovering its causes and todevelop efficient operational means tocontrol and reduce the variation. Theexpected outcomes of DMAIC effortsare faster and more robust productdevelopment, more efficient andcapable manufacturing processes, andmore confident overall businessperformance.The complete data of all three defectsare shown in table 1,2 and 3 for upperhousing, motor pulley and mini chaffcutter respectively shows that therejection due to blow holes is veryhigh. So it is very necessary to takesome action to minimize the defect inthese parts.DEFINE PHASE FOR BLOWHOLES:These are smooth walled rounded,flattered or elongated cavities in thecastings. When these cavities holesIJSERIJSER 2015http://www.ijser.org
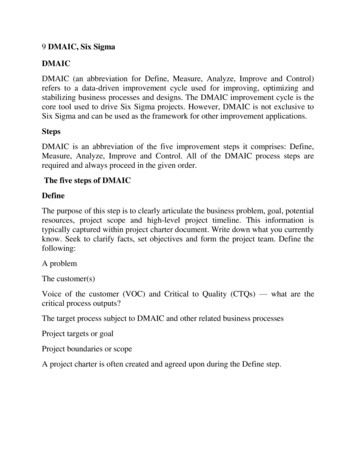
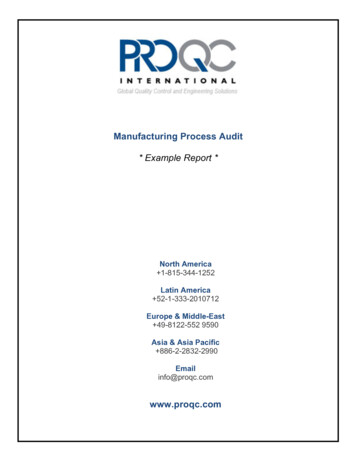
International Journal of Scientific & Engineering Research, Volume 6, Issue 5, May-2015ISSN 2229-5518inside the casting are known as Blowholes. These are caused moisture leftin the mould and core. Because of theheat of molten metal moisture isconverted into steam and entrappedinside the casting, which and up asBlow holes.MEASUREMENT PHASE FORBLOW HOLES:First to collect the data of rejection in blowholes. The data collected four months andfind out the defects in Blow holes. I havecollected four months data in industry. Ifound that the rejection in blow holes is8.46% for upper housing and total data forupper housing is given below in table 1, therejection in motor pulley is 7.63% is givenin table 2 and rejection in Mini Chaff cutterwheel / hand wheel is 5.18% is given intable 3.But the overall percentage of rejections hasbeen found as below.Total production of three parts in fourmonths 26393Total rejection pieces due to blow holes 1539Overall rejection percentage 1539/ 26393*100 5.83%It is clear that the overall rejection is veryhigh. So it is very necessary to reduce therejection in three parts.Low permeability of moulding sand.Cause-and-Effect analysis tool:A cause-and-effect, or fishbone, diagramdepicts potential causes of a problem. Theproblem (effect) displays on the right sideand the list of causes on the left side in atreelike structure. The branches of the treeare often associated with major categories ofcauses. Each branch has a listing of morespecific causes in that category. Althoughthere is no "correct" way to construct afishbone diagram, some specific types lendthemselves well too many differentsituations.After that Brain storming Sessions wereconducted with Key members of industriesfrom where root causes for the problem wastaken out for further analysis. The rootfactor which has been found to be affectingthis defect is:For blow Holes 1.High moisture content2.Low permeabilityIJSERANALYZE PHASE FOR BLOWHOLES DEFECTS:Find out the causes for Blow holes & drawthe problem with the help of fishbonediagram 7.This fig. shows that factor affecting andregion for blow hole defects.Cause for blow holesExcess moisture in molds or cores.High moisture content of mould.Inadequate venting in the mould.Insufficient evacuation of air and gas fromthe mold cavity.Insufficient mold and core permeability.112SAND CONTROL TESTS:After mapping the process AFS number ofsand is found out by performing sieveanalysis.In AFS sieve analysis size anddistribution of sand grain in sand isdetermined.A dried 50 kg sand sample is used. Thesample is placed on the top of sieve andshaken for 10 minutes. After shaking, thesand retained on each sieve and bottom panweighted and its percentage of total sampledetermined. The fig. 4 shows a sieve testingmachine which are used for sieve analysis ofsand.Two main test were conducted1Moisture content test2PermeabilitytestFollowing test were conducted to checkwhether the sand characteristic as perspecifications.Moisture content test: - In the moisturecontent test weighted amount of sand sampleand calcium carbide are placed in twoIJSER 2015http://www.ijser.org
International Journal of Scientific & Engineering Research, Volume 6, Issue 5, May-2015ISSN 2229-5518containers and allowed to mix by shakingthe container. The resulting pressure of gasgenerated is indicated on the scale which iscalibrated directly in the percentage ofmoisture and moisture was recorded 7.26%.The fig. 5 shows amoisture testing machinewhich are using ultra violet lamp drier formoisture content testing of sand.Permeability test:-In the Permeability testfirstly the sand is poured in to the sameapparatus which is used for testing thecompatibility then after ramming three timesthe sand container is kept on permeabilitytesting equipment and reading dial showspermeability. Permeability is expressed interm of permeability number which isdefined as the volume of air in cc that willpass per minute through a sand sample of1cm2 in cross section and 1 cm in height at apressure of 1gm/cm2. The fig. 6 shows theequipment for permeability test.VHPermeability number PATV volume of air in ccH height of sample in cmP Pressure of air in gm. /cm2A Cross sectional area of sample in cm2T time in minutes and recorded was 122cc/min.So it is clear from above discussion andcompare with Specification of the parametersfor molding (From BS 6615:1996) the qualityof sand was not good because moisture insand was high and permeability was less.Therefore to reduce the rejections it wasnecessary that sand characteristic should beas per specifications to achieve efficientresults.IMPROVEPHASE FOR BLOW HOLESDEFECTS:These are the following improvement whichis given below.Improvement in blow holes defects: Theroot factors for blow holes defects were highmoisture and low permeability. The industrywas using 100% of reuse sand. After113performing the test with 100 kg of sandsample, it was found that percentage ofmoisture was high and percentage ofpermeability was low. Therefore to reducethe blow holes defects it was necessary toincrease the percentage of new silica sand toreduce the moisture and adding thepermeability. The different results have beenobtained by adding the new silica sand asbelow.Moisture content has been reduced in thesand by adding new sand from 5% to 6.5%.So these results in reduction of moisturecontact and permeability have beenincreased as shown in table 5. After testingthe sand the following results were obtainedwhich were in comparison with the standardresults towards achievements of reduction ofsand casting defects.Afterimplementationoftheseimprovements, the data of the company wascollected again. The table 6 show the datacollection of upperhousing afterimprovement. Same as table 7 and 8 showsthe collection data after improvement ofmotor pulley and mini chaff cutterrespectively.CONTROL PHASE FOR BLOWHOLES DEFECTSThe main objective of control phase ismakingtoo sure that the improved processstays in control after the solution. Thecontrol stage is last and final stage ofDMAIC. After the study of Blow holesinfoundry unit the following recommendationsare made to control the reduction of Blowholes defects of submersible pumps parts.1.Control the permeability of mouldingSand.2. Control the moisture content ofmoulding sand.RESULT ANALYSISThe cost analysis of the savings in quarterlyhas been reflected in the following table.This table shows that product such as upperhousing whose rejection cost due to defectsIJSERIJSER 2015http://www.ijser.org
International Journal of Scientific & Engineering Research, Volume 6, Issue 5, May-2015ISSN 2229-5518before application of DMAICwas Rs.67230which has been reduce to Rs. 26082 afterimplementation of DMAIC.The motorpulley pervious rejection cost in Rs 35720which has been reduced to Rs.9785 and formini chaff cutter has been reduced from87864 to 31080 by implementation ofDMAIC as shown in table 12.For experimental measurement we haveadded a quantity of 6.5 kg of fresh new sandin sample of 100kg of reused sand to controlmoisture content and its permeability. Theadditional material added cost has beenshown in table 14.4. Integrate the DMAIC approach withTaguchi’s method to optimize thequality.REFERENCES1.2.CONCLUSIONSThe DMAIC approach is a viable solution totheir shop floor problems. This case studyhas substantiated the fact that many defectsof sand casting can be overcome byadopting this approach. A number ofexperiments are carried out to validate theresults which indicate that the cost ofexperimentation will be less, in comparisonto the gain or profit of the company.On the basis of the results, the followingconclusions have been drawn:1. DMAIC has been considered as anapproach to improve quality ofproduct and process.2. Reduced rejection of industry.3. The DMAIC approach provides asuitable visible road map forentirework force to achieve newknowledge.4. Accuracy of this approach is veryhigh.SCOPE FOR FUTURE WORK1. The work can be implemented onother foundry.2. The work can be apply with Leanmanufacturing and supply chainmanagement technique to achievinggood quality.3. The data can be compared andintegrated with JIT and Kaizen toimprove quality.1143.A.Kumaravadivel and U.Natarajan, “AStudy of Empirical study on employee jobsatisfaction upon implementing six sigmaDMAIC methodology in Indian foundry”,International Journal of Engineering,Vol.3, No. 4, 2011, pp. 164-184.Ahire, M. and Landeroj, P., “Total QualityManagement: A Review and Agenda forFuture Research”, Journal of Productionand Operation Management, Vol.4, No. 3,1998, pp. 227-229.Angel Rivera, “ To optimise cordis salesadministration of order and revenueprocess” Proceeding WSC 01, 2001, pp.1252-1258.Anthony, R. and Banualas, W., “Designfor Six Sigma”, Journal of ResearchTechnology and Management, Vol. 65,No. 1, 2002, pp. 23-25.A.K Sahoo M.K,Tiwarib,andA.RMileham.Six Sigma based approach tooptimize radial forging operation variablesjournalofmaterialsprocessingtechnology. Vol.202, 2008 pp.125–136.Bendell, R. and Corke, F., “SuccessfulImplementation of DMAIC BenchmarkingGeneralElectricCompanyBenchmarking”, An International Journal,Vol. 7, No. 40, 1999, pp. 260-281.Bendall, F.andMarra, T., “Six Sigma BlackBelts: What Do They Need to Know”,Journal of Quality Technology, Vol. 33,No. 4, 2005, pp.391-406.Breyfogle, F., “Featured CompanyBechtel”, ASQ Six Sigma DiscussionMagazine, Vol. 3, No. 1, 2004, pp. 4-6.Chonghun Han, “A hierarchical decisionprocedure for productivity” Computer andChemical Engineering 32 (2008), pp.1029-1041.IJSER4.5.6.7.8.9.10.IJSER 2015http://www.ijser.orgCatherwood, P., “What Different about SixSigma”, Journal of ManufacturingTechnology, Vol.8, No. 3, 2003, pp. 2-5.
International Journal of Scientific & Engineering Research, Volume 6, Issue 5, May-2015ISSN 2229-5518115David M. Ferrin, “ Six Sigma andSimulation, So. What’s the Correlation”Winter Simulation Conference, 2002.ProductionBlowRejectionPieces orel, H., “Putting Six Sigma inProspective”,QualityEngineeringMagazine”, Vol. 40, No. 10, 2001, pp. 5862.Sanders, D and Hilolo, Q., “Six Sigma onBusinessProcesses:CommonOrganizational Issue”, Journal of QualityEngineering, Vol. 12, No. 2, 2007, pp. 58.Snee, R., “Impact of Six Sigma on QualityTechnology”,JournalofQualityTechnology, Vol. 12, No. 1, 2000, pp. 2-5.IJSERTable No.1ProductionMonthPieces .2014100817875Total4140731316Table No.2IJSER 2015http://www.ijser.org
International Journal of Scientific & Engineering Research, Volume 6, Issue 5, May-2015ISSN 2229-5518Aug.20145129943Total2092415177Table No. 3Month116Table No. 4ProductionRejectionPieces ofhand 7Total2016133631046IJSERTable No.5S.NAddition ofnewMoisturePermeabilitysilica sand15%5.74 %138 cc / min25.5 %5.06 %159 cc / min36%4.68 %176 cc / minDefectsNov.2014Dec.2014Jan.201546.5 %3.82 %188 cc/ minIJSER iecesMonthBlow holesFeb. 2015TotalNo. ofdefective546pieces548BlowholesdefectsPercentage of37 rejection154117542391415395504421861615.83%1864
International Journal of Scientific & Engineering Research, Volume 6, Issue 5, May-2015ISSN 2229-5518117Table No. 6DefectsNo. ofdefectivepiecesTable No. 7Percentage ofrejectionTable .20155018307954048234103Total1213370Production onpiecesNov.2014MonthIJSERTable No. 920069Table No. 10IJSER 2015http://www.ijser.org
International Journal of Scientific & Engineering Research, Volume 6, Issue 5, May-2015ISSN 2229-5518Blow tBlow holes5.83%2.04%2.04%Table No. 11MonthType ofdefectsNov.2014Feb(2015)BlowholesNumberof defect537Percentageof defectFactorResultSuggestions2.04 %Moisture(3.5-4.6) lmoisture andpermeabilityTable No.12S.No.IJSERProductCost (Castiron)@ 56/kgWtPrevious rejectioncost in RsAfter implementationof modification(rejection cost in Rs)cost1Upper housing2.9 kg162177 x 162 2867464 x 162 103682Motor pulley1.7 kg95376 x 95 35720103 x 95 97853Mini Chaff cutterwheel / Hand wheel1.5Kg841046 x 84 87864370 x 84 3108015225651233Total costIJSER 2015http://www.ijser.org
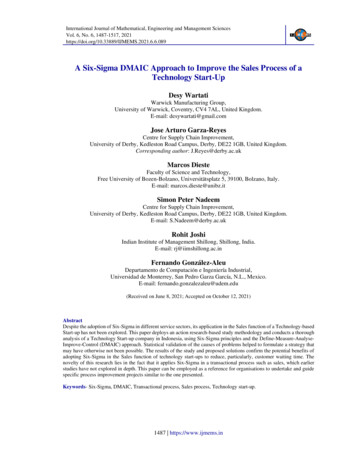
International Journal of Scientific & Engineering Research, Volume 6, Issue 5, May-2015ISSN 2229-5518Fig. No. 1119Fig. No. 2IJSERPIE CHARTOtherdefects66%Blowholes34%Fig. No. 3Fig.No. 4Fig.No. 5Fig.No. 6IJSER 2015http://www.ijser.org
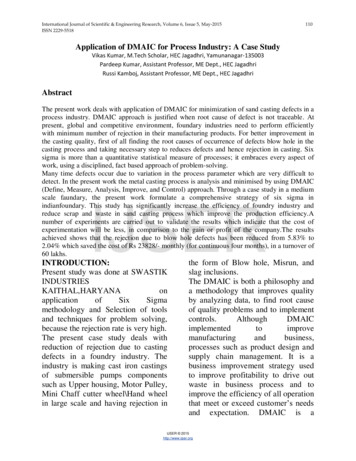
International Journal of Scientific & Engineering Research, Volume 6, Issue 5, May-2015ISSN 2229-5518UPPER HOUSING10.00%8.00%6.00%4.00%2.00%0.00%120MOTOR ONFig.No. 8Fig.No. 9HAND WHEEL10.00%BLOW %0.00%BeforeREJECTIONREJECTIONFig.No. 10Fig. No. 1IJSER 2015http://www.ijser.orgAfter
study on implementing DMAIC based . six sigma approaches in order to reduce defects and increase six sigma levels in sand casting process. They defined step by step guide using DMAIC, which describes overall decline of defect rejection and in process, sigma