Transcription
Building a 3 StatementFinancial Model in Excelcorporatefinanceinstitute.com
corporatefinanceinstitute.com
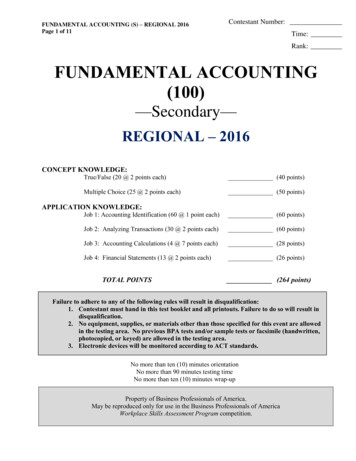
What is a financial model?“A financial model is a toolused to forecast a business’financial performance intothe future based onhistorical data andassumptionscorporatefinanceinstitute.com
Why do we build financial models?For anyone pursuing a career in corporate development, investment banking, FP&A, equity research, commercialbanking, or other areas of corporate finance, building financial models is part of the daily routine.CorporateDecisionsCompany performance,strategic planningcorporatefinanceinstitute.comProject FinanceWhether to invest in rgers &acquisitions, capitalraisingValuation, equityresearch, portfoliomanagement
Types of financial modelsOptionPricingModelThreeStatementModelDCF lsInitialPublicOffering(IPO) institute.comSum of thePartsModelLeveragedBuyout(LBO)Model
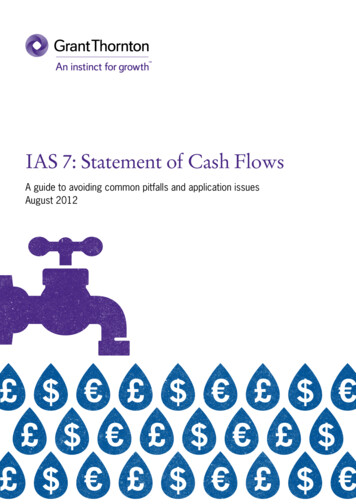
Hierarchy of financial modelingcorporatefinanceinstitute.comThree Statement ModelIncome statement, balance sheet, cashflow statementDCF AnalysisDiscounted cash flow analysis to value abusinessScenario AnalysisEstimate changes in the value of abusiness in different possible scenariosSensitivity AnalysisEvaluate how sensitive an investment isto changes in driversM&A AnalysisEvaluate the attractiveness of potentialmerger, acquisition or divestitureCapital RaisingAnalyze the pro forma impact of raisingdebt or equityLBO AnalysisDetermine how much leverage can beused to purchase a company
Financial Modeling Best Practicescorporatefinanceinstitute.com
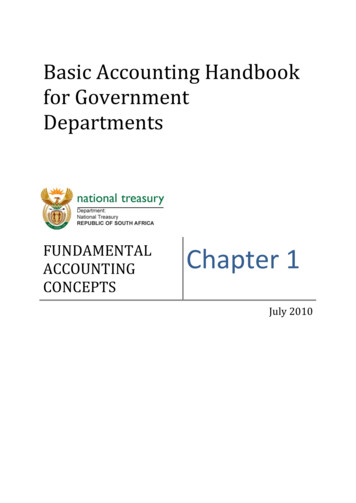
Key structure for model buildingGood models clearly separate inputs, processing, and outputs.Inputs Clearly identified Should only everbe entered onceProcessingOutputs Processing shouldbe transparent Quickly accessible Broken down intosimple steps Easy to followcorporatefinanceinstitute.com
Modeling best practices What problem is the modelmeant to solve?1. Clarifycorporatefinanceinstitute.com Who is the end user? What are users supposedto do with the model?
Modeling best practices1. Clarify2. Simplifycorporatefinanceinstitute.com What is theminimumnumber of inputsand outputs tobuild a usefulmodel?
Modeling best practices1. Clarify2. Simplify Plan how inputs andoutputs will be laidout3. Plancorporatefinanceinstitute.com Keep all inputs inone place
Modeling best practices1. Clarify2. Simplify Consider using Exceltools such as: “Datavalidation” and“Conditional formatting”corporatefinanceinstitute.com4. Integrity3. Plan
Modeling best practices1. Clarify Use test data toensure the modelworks as expected5. Model Testing4. Integritycorporatefinanceinstitute.com2. Simplify3. Plan
Modeling best practices1. Clarify5. Model Testing4. Integritycorporatefinanceinstitute.com2. Simplify3. Plan
Tension: complex vs. simple modelsComplexModels High detail Precise Hard to model Prone to ModelsKeep things as simple aspossible while providingenough detail fordecision making Basic Easy to follow Lack of precision Overly simplified
Model gOutputs
Model inputsInputsObjectives Accurate Enter each data once Reasonable data ranges Use color to differentiateinputs and outputs Easy to use Easy to understand Easy to update datacorporatefinanceinstitute.comAchieving objectives Use data validation &conditional formatting Use comments
Model processingInputsProcessingOutputsDo you try to put all your processing calculations into as few cells as possible?Do you hide your processing cells or worksheets?corporatefinanceinstitute.com
Model processingProcessingObjectivesAchieving objectives Easy to maintain Break down complex calculations Accurate processing Use comments and annotations Transparency Use formatting Calculate final figures which willgo onto the output reportscorporatefinanceinstitute.com
Model ngOutputs
Model outputsOutputsObjectives Provide key results toaid decision-making Easy to understand Unambiguouscorporatefinanceinstitute.comAchieving objectives Make outputs modular Consider creating a summarysection with only the mostimportant key model outputs
Model structure and omSingle spreadsheet
Financial forecasting frameworkAssumptions & driversIncome statementBalance sheetHistorical ratios and figures which drive the forecastSummarizes the company’s profit and lossDisplays the company’s assets, liabilities andshareholders’ equityCash flow statementReports the cash generated and spent by a companySupporting schedulesBreaks down longer calculations such as PP&E and debtschedulecorporatefinanceinstitute.com
Financial forecasting approachHistoricalForecastAssumptions & driversBCIncome statementADBalance sheetADCash flow statementADSupporting schedulesADcorporatefinanceinstitute.com
Financial modeling stepsAssumptionsand DriversIncomeStatementBalance SheetCash stitute.com
Financial modeling stepsAssumptionsand DriversIncomeStatementBalance SheetCash stitute.com1Historical data
Financial modeling stepsAssumptionsand DriversIncomeStatementBalance SheetCash stitute.com1Historical data2Assumptions and drivers
Financial modeling stepsAssumptionsand DriversIncomeStatementBalance SheetCash stitute.com1Historical data2Assumptions and drivers3Forecast revenues down to EBITDA
Financial modeling stepsAssumptionsand DriversIncomeStatementBalance SheetCash stitute.com1Historical data2Assumptions and drivers3Forecast revenues down to EBITDA4Forecast working capital
Financial modeling stepsAssumptionsand DriversIncomeStatementBalance SheetCash stitute.com1Historical data2Assumptions and drivers3Forecast revenues down to EBITDA4Forecast working capital5Forecast capital assets (PP&E, capex, depreciation, etc.)
Financial modeling stepsAssumptionsand DriversIncomeStatementBalance SheetCash stitute.com1Historical data2Assumptions and drivers3Forecast revenues down to EBITDA4Forecast working capital5Forecast capital assets (PP&E, capex, depreciation, etc.)6Forecast capital structure
Financial modeling stepsAssumptionsand DriversIncomeStatementBalance SheetCash stitute.com1Historical data2Assumptions and drivers3Forecast revenues down to EBITDA4Forecast working capital5Forecast capital assets (PP&E, capex, depreciation, etc.)6Forecast capital structure7Complete cash flow statement
Model Setup and Assumptionscorporatefinanceinstitute.com
The caseYour boss has just emailed you about about something theexecutive team would like to look at ASAPYou need to create a financial forecast for a business,with limited informationYou only have a set of historical financial statementsand some guidance from the company’s management team, aswell as a template model from a colleagueYou must link the historical financial statements andcreate a well built 5-year forecast as fast as possiblecorporatefinanceinstitute.com
Historical dataAssumptionsand DriversIncomeStatementBalance SheetCash stitute.com1Historical data
Assumptions, drivers and forecasting methodsAssumptionsand DriversIncomeStatementBalance SheetCash stitute.com1Historical data2Assumptions and drivers
Forecasting methodsBottom-UpAnalysisTop-DownAnalysis Start with totaladdressable market(TAM) Work down fromthere based onmarket share andsegments untilarriving at revenue corporatefinanceinstitute.comStart with most basicdrivers of thebusiness (units)Build up the analysisall the way torevenueRegressionAnalysis Analyze therelationship betweenrevenue and otherfactors using theregression analysis inExcelYear-over-YearGrowth Rate Most basic form offorecasting Calculate the yearover-year change inrevenue
Forecast Revenues Down To EBITDAcorporatefinanceinstitute.com
Financial modeling stepsAssumptionsand DriversIncomeStatementBalance SheetCash stitute.com1Historical data2Assumptions and drivers3Forecast revenues down to EBITDA
Forecasting operating revenues and profitsIncome statement RevenuesEBITDA Direct operating cost Indirect operating costNet income Depreciation and amortization Cost of debt Taxescorporatefinanceinstitute.com
Forecasting revenuesComplexModelsSimpleModelsFirst principlesQuick and simple Retail (bottom up) – forecast # ofstores, size, and derive revenue per sq.ft. Telco (top down) – Forecast market sizeand use current market share andcompetitor analysis to predict revenue Regression Use historic figures and trends topredict future growth (e.g. lastyear plus 5%)corporatefinanceinstitute.com
Forecasting gross margin and SG&A expensesUse historic figures ortrends to forecastfuture t of goods sold80%Gross marginGrossmargin20%20%SG&A5%Operating margin15%
Forecasting gross margin and SG&A expensesConsider factors suchas economies of scaleand learning effectsRevenue100%CostofgoodsgoodssoldsoldCost of80%(80%)Labor materials Inflation %Gross marginComplexModelscorporatefinanceinstitute.com Based on inputs Per unit20%Simple Based on a margin Models Easy to model
Forecasting gross margin and SG&A expensesForecasted as apercentage of revenueor as a fixed cost (plusan inflator)Often includesmarketing, sales,general .comRevenue100%Cost of goods sold80%Gross margin20%IndirectSG&A5%(5%)or xxOperating margins15%
Forecast Working Capital and PP&Ecorporatefinanceinstitute.com
Financial modeling stepsAssumptionsand DriversIncomeStatementBalance Sheet1Historical data2Assumptions and drivers3Forecast revenues down to EBITDA4Forecast working capital Accounts receivableCash stitute.com Inventories Accounts payable
Forecasting financial statementsHaving forecast the revenues and costs of an operation, the next step is to consider theworking capital required to generate them.AssetsLiabilities & Shareholders’ EquityCurrent assetsCurrent liabilitiesCashAccounts payableAccountspayableAccounts receivableAccountsreceivableOther InventoryLong term liabilitiesNon-current assetsShareholders’ equityOperating (non-current) assetsCommon sharesRetained earningscorporatefinanceinstitute.com
Forecasting working capitalDetailed approach“Quick and simple” approach Account/client detail Historical trends Inventory managementdetail A % of sales based on trendsHigh complexityModerate approach Receivable days Inventory days Payable dayscorporatefinanceinstitute.comLow complexity
Working capital equationsReceivable daysPayable daysInventory dayscorporatefinanceinstitute.com
Working capital equationsReceivable daysAccountsreceivable days Forecast accountsreceivable Accounts receivableSalesX 365Payable daysInventory dayscorporatefinanceinstitute.comReceivable days365X Sales
Working capital equationsReceivable daysAccounts payabledays Forecast accountspayable Accounts payableCost of salesX 365Payable daysInventory dayscorporatefinanceinstitute.comPayable days365X Cost of sales
Working capital equationsReceivable daysInventory days Forecastinventory InventoryCost of salesX 365Payable daysInventory dayscorporatefinanceinstitute.comInventory days365X Cost of sales
Financial modeling stepsAssumptionsand DriversIncomeStatementBalance SheetCash stitute.com1Historical data2Assumptions and drivers3Forecast revenues down to EBITDA4Forecast working capital5Forecast non-current capital assets PP&E Capex Depreciation Intangibles
Forecasting financial statementsAssetsLiabilities & Shareholders’ EquityCurrent assetsCurrent liabilitiesCashAccounts payableAccounts receivableOther current liabilitiesInventoryLong term liabilitiesNon-current assetsOperating(non-current)Operating (non-current)assetsassets / PP&EShareholders’ equitycorporatefinanceinstitute.comCommon sharesRetained earnings
Forecasting property, plant and equipment (PP&E)First principles approach Forecast property, plant, and equipment requirement directly (e.g. store expansion) Forecast depreciation/amortization based on stated depreciation/amortization policies. Ifdeprecation policies are not available, divide gross assets by the depreciation expense to get averageasset life.“Quick and simple” approach Forecast depreciation & amortization as a percentage of opening PP&E balance or percentage of revenue Forecast PP&E balance based on a capital asset turnover ratioHigh complexitycorporatefinanceinstitute.comLow complexity
Forecasting property, plant and equipment (PP&E)Capital Asset Turnover RatioSales / PP&E (end of period)orSales / PP&E (average)corporatefinanceinstitute.com
Forecast Capital Structurecorporatefinanceinstitute.com
Financial modeling stepsAssumptionsand DriversIncomeStatementBalance SheetCash stitute.com1Historical data2Assumptions and drivers3Forecast revenues down to EBITDA4Forecast working capital5Forecast capital assets (PP&E, capex, depreciation, etc.)6Forecast capital structure
Forecasting financial statementsThe financing structure affects both the balance sheet and the income statement(i.e. interest)AssetsLiabilities & Shareholders’ EquityCurrent assetsCurrent liabilitiesCashCashAccounts payableAccounts receivableIncome taxes payableInventoryNon-current liabilitiesLong termLongtermdebtdebtNon-current assetsShareholders’ equityOperating (non-current) assetsCommon sharesCommonsharesRetainedearningsRetained earningscorporatefinanceinstitute.com
Forecasting financial statementsCashOther Current LiabilitiesLong term LiabilitiesCommon Sharescorporatefinanceinstitute.comRetained Earnings
Approaches to modeling capital structure (debt/equity)?Do we want to model the status quo, or do wewant to model a different capital structure?Debt & Equity ValuesHeld Constantcorporatefinanceinstitute.comDebt/Equity x Ratio HeldConstantDebt/Equity Change OverTime Based on Cash Flow
Forecasting the capital structureWhat should be the split between equity and debt financing?Leverage ratiosDebtEquityCoverage ratiosEBIT Financial covenants dictate maximum leverage and minimum coverage Consider management’s willingness to take on debt Use the company’s current access to the debt and equity capital e
Compounding vs non compounding interest?Is the debt (and interest expense) compounding or not?corporatefinanceinstitute.comIF YESIF NOThere will be a circularreference in the modelThere will not be a circularreference in the model
Circular referencesOpening Debt Balance /Additions/Repayments Interest Closing Debt Balancecorporatefinanceinstitute.com
Complete Cash Flow Statementcorporatefinanceinstitute.com
Financial modeling stepsAssumptionsand DriversIncomeStatementBalance SheetCash stitute.com1Historical data2Assumptions and drivers3Forecast revenues down to EBITDA4Forecast working capital5Forecast capital assets (PP&E, capex, depreciation, etc.)6Forecast capital structure7Complete cash flow statement
Forecasting financial statementsA cash flow forecast can be derived from the balance sheet and income statementOperating activities (e.g. revenues, operating expenses)Investing activities (e.g. sale/purchase of assets)Financing activities (e.g. issuing shares, raising debt)corporatefinanceinstitute.comNet Cash Movement
Cash flows from operating activitiesNet income100Depreciation20Other non-cash items-Trade and other receivables(10)Inventory(20)Trade and other payables4515Cash from operating activitiescorporatefinanceinstitute.comFrom income statement135From balance sheetChanges in operating assetsand liabilities
Cash flows from investing activitiesFrom specific fixed asset forecastsCapital expenditures (additions to PP&E)Proceeds from disposals of fixed assets10Payments for investment in businesses0Proceeds from disposals of businesses0Cash from investing APEX
Cash flows from financing activitiesFrom balance sheet and suance of common stock100Dividends paid in the year(5)Increase/(decrease) in long-term debt15Increase/(decrease) in short-term debt(10)Cash from financing activities100
Review and Auditcorporatefinanceinstitute.com
Auditing techniquesSanity Checks(Assumptionsand Drivers)GoTo SpecialTracePrecedents andDependentsView FormulasError Messagesand AlertsExcel Settingscorporatefinanceinstitute.com
Summarycorporatefinanceinstitute.com
Final thoughts“A financial model is a toolthatrelies on a set ofassumptionscorporatefinanceinstitute.com
A modular approach to building modelsAssumptions and DriversIncome StatementBalance SheetCash Flow StatementSupporting SchedulesDiscounted Cash Flow (DCF) AnalysisSensitivity AnalysisLBO or M&Acorporatefinanceinstitute.com
DCF models, sensitivity, M&A, LBO, and moreThree Statement ModelDCF AnalysisScenario AnalysisSensitivity AnalysisM&A AnalysisCapital RaisingLBO Analysiscorporatefinanceinstitute.comBusiness Valuation ModelingCourseScenario & SensitivityAnalysis in Excel CourseAdvanced Financial Modeling(AMZN Case Study) CourseMergers & Acquisitions (M&A)Modeling CourseLeveraged Buyout LBOModeling Course
Additional Case Studycorporatefinanceinstitute.com
OverviewPractice your skillsSolution and demonstration A “real” example of somethingyou’d be asked to do at work Highlight the main steps tobuilding the threestatement model Take raw data (PDF) andblank Excel model provided Build the three financialstatements from scratch,including the historicalresults and a 5-yr forecastcorporatefinanceinstitute.com Step-by-step demonstration Add commentary aboutwhy things are modeled asthey are
Steps for building the three statement model1. Copy and paste rawdata into the blankmodel2. Format and linkhistorical subtotals3. Calculate historicalratios4. Make assumptionsbased on the guidanceprovided5. Start the incomestatement6. Start the balancesheet7. Build supportingschedules8. Build the cash flowstatement andcomplete the I/S andB/S9. Create charts,graphs, and outputscorporatefinanceinstitute.com
Practice your skills You can find these links on the attachment tab1. Download the Case Study – Financial Statements& Future Prospects for raw data and assumptions2. Open the Case Study – Three Statement Model –Blank and build a three statement modelcorporatefinanceinstitute.com
Case study wrap upcorporatefinanceinstitute.com
Business valuation modeling courseBusiness ValuationModelingDCF Analysiscorporatefinanceinstitute.com
ConclusionKey messages from this session:01.Understand the keystructure for building afinancial model in Excel04.Make sure the threestatements are properly linked02.Follow modeling best practices05.Practice your skills03.Build a model step by stepas outlined in this coursecorporatefinanceinstitute.com
FMVA Certificationcorporatefinanceinstitute.com
Financial modeling steps Income Statement Balance Sheet Cash Flow Statement 3 Forecast revenues down to EBITDA 4 Forecast working capital 5 Forecast capital assets (PP&E, capex, depreciation, etc.) 6 Forecast capital structure Supporting Schedules