Transcription
CHAPTER 2.1Charting Basics
CHARTING BASICSCharts are a forex trader’s best friend. As a Forex trader, you will mostlikely utilize your price charts more than any other available tool. Sinceyour charts are going to play such a large part in your trading, it isimperative you become familiar with them. The more comfortable you arewith your charts, the easier it will be to become a successful forex trader.To help you become acquainted with your charts and how you caneffectively use them, we will cover the following concepts:Chart setupContentsChart time framesChart types1Cornèr Bank Ltd. // Cornèrtrader // Tödistrasse 27 // 8002 Zurich SwitzerlandTel: 41 58 880 80 80 // Fax: 41 58 880 80 81 // info@cornertrader.ch // cornertrader.ch1
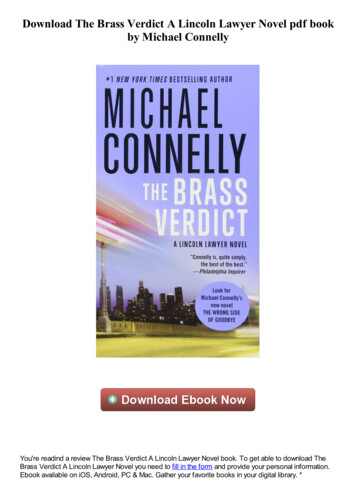
The X axis runs horizontally along the bottom of the chart providing atimeline for everything that has happened on the chart. The most recentprice action is shown on the right side of the chart and the most distantprice action is shown on the left side of the chart.CHART SETUPLet’s start from the very beginning and take a look at how a forex pricechart is set up. Once you understand the basics, you will be much moresuccessful applying more advanced concepts to your technical analysis.The Y axis runs vertically along the right side of the chart providing a pricescale for the price movement on the chart. Lower prices are shown towardthe bottom of the chart and higher prices are shown toward the top of thechart.Forex price charts are built on two axes—the X axis (horizontal axis) andthe Y axis (vertical axis).When you put the two axes together, you can see at what price a currencypair was trading at a particular time in the past. For example, you can seethat the EUR/USD was trading at 1.4000 on 20 September 2007.2Cornèr Bank Ltd. // Cornèrtrader // Tödistrasse 27 // 8002 Zurich SwitzerlandTel: 41 58 880 80 80 // Fax: 41 58 880 80 81 // info@cornertrader.ch // cornertrader.ch2
CHART TIME FRAMESCornèrtraderCornèrtrader forex charts give you the ability to analyze the pricemovement of your favorite currency pair anywhere from a minute-by-minutebasis to a month-by-month basis. You have the flexibility to choose whichtime frame is best for you.If you are a shorter-term trader, you will want to use shorter time framesfor your charts. If you are a longer-term trader, you will want to use longertime frames for your charts. For example, a trader who is looking toquickly jump in and out of trades for 10- to 20-pip profits would most likelywant to be watching a 1-minute or a 5-minute chart. A trader who islooking to hold onto trades for a longer period of time to take advantageof larger price moves would most likely want to be watching an hourly or adaily chart.Some traders even choose to use multiple time frames so they can seehow the movement of a currency pair looks from various points of view.We will discuss this concept in detail in a later section.3Cornèr Bank Ltd. // Cornèrtrader // Tödistrasse 27 // 8002 Zurich SwitzerlandTel: 41 58 880 80 80 // Fax: 41 58 880 80 81 // info@cornertrader.ch // cornertrader.ch3
To change the time frame on your chart to best match your trading style,click on the button at the top of the chart. A drop-down menu will appear,and you can select your preferred time frame.CHART TYPESCornèrtraderCornèrtrader forex charts give you the ability to analyze the pricemovement of your favorite currency pair in various formats, from linecharts to candlestick charts. You have the flexibility to choose which formatis best for you.Technical analysis is a visual, almost artistic, skill that traders develop, anddifferent traders like to practice their art on different types of charts.Some traders feel they can see and analyze support and resistance levelsbetter on a line chart, while other traders feel they get more information onprice movement on a bar chart or a candlestick chart.Technical analysts tend to gravitate toward the following three charttypes:-Line charts-Bar charts-Candlestick charts4Cornèr Bank Ltd. // Cornèrtrader // Tödistrasse 27 // 8002 Zurich SwitzerlandTel: 41 58 880 80 80 // Fax: 41 58 880 80 81 // info@cornertrader.ch // cornertrader.ch4
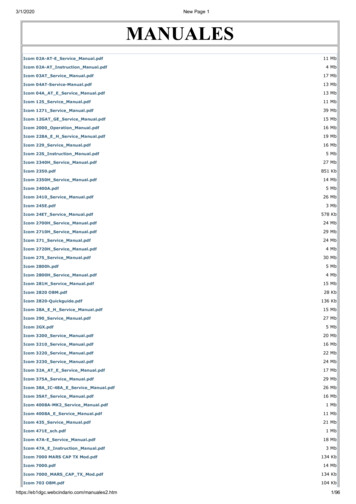
LINE CHARTSLine charts are the most basic type of chart. Technical analysts often useline charts to easily identify support and resistance levels. Line charts onlyhave basic information plotted on the chart, which means there is not a lotof other “clutter” to get in the way of your analysis.You create a line chart by plotting the closing price of each trading periodon a chart and then connecting each closing price with a line. You can seean example of a line chart below.5Cornèr Bank Ltd. // Cornèrtrader // Tödistrasse 27 // 8002 Zurich SwitzerlandTel: 41 58 880 80 80 // Fax: 41 58 880 80 81 // info@cornertrader.ch // cornertrader.ch5
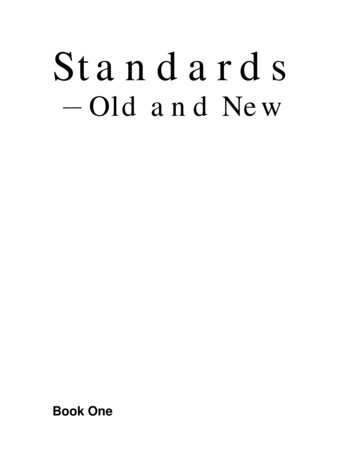
BAR CHARTSBar charts provide more information than a line chart. Technical analystsoften use bar charts to gain more information about how a currency pair’sprice moved up and down during each trading period. Whereas line chartsonly plot the closing price from each trading period, bar charts plot theopening, high, low and closing prices from each period.You create a bar chart by plotting a series of bars across the chart. Eachbar represents one trading period. To create a bar, you plot the high andlow price of a trading period and connect them with a vertical line. Next,you plot the opening price out to the left side of the vertical line you havejust drawn and connect that point to the vertical line with a horizontal line.Last, you plot the closing price out to the right side of the vertical line youhave just drawn and connect that point to the vertical line with ahorizontal line.6Cornèr Bank Ltd. // Cornèrtrader // Tödistrasse 27 // 8002 Zurich SwitzerlandTel: 41 58 880 80 80 // Fax: 41 58 880 80 81 // info@cornertrader.ch // cornertrader.ch6
Seeing where a currency pair started the trading period compared towhere it ended the trading period can help you better identify trends. Ifthe price closes higher than it opened, you know investors were bullish onthe currency pair during the trading period. If the price closes lower than itopened, you know investors were bearish on the currency pair during thetrading period.You can see an example of a bar chart to the right.7Cornèr Bank Ltd. // Cornèrtrader // Tödistrasse 27 // 8002 Zurich SwitzerlandTel: 41 58 880 80 80 // Fax: 41 58 880 80 81 // info@cornertrader.ch // cornertrader.ch7
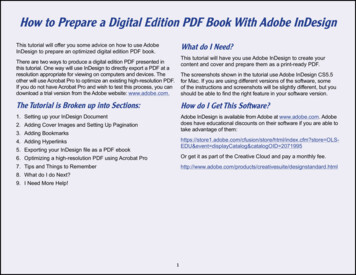
CANDLESTICK CHARTSCandlestick charts provide the same information as bar charts but in aslightly different format. Technical analysts often use candlestick chartsinstead of bar charts because it is easier to see and identify various tradingpatterns using candlestick charts. In fact, a complete line of technicalanalysis—Japanese candlestick-chart analysis—was developed aroundthese easy-to-use charts.You create a candlestick chart by plotting a series of candlesticks acrossthe chart. Each candlestick represents one trading period. To create acandlestick, you plot the high and low price of a trading period andconnect them with a vertical line. This line is called the wick of the candle.Next, you plot the opening price by drawing a horizontal line through thevertical line, or wick. After you have plotted the opening price, you plotthe closing price by drawing another horizontal line through the verticalline. Lastly, you fill in the area between the opening price and the closingprice. This area is called the body of the candlestick.8Cornèr Bank Ltd. // Cornèrtrader // Tödistrasse 27 // 8002 Zurich SwitzerlandTel: 41 58 880 80 80 // Fax: 41 58 880 80 81 // info@cornertrader.ch // cornertrader.ch8
Seeing where a currency pair started the trading period compared towhere it ended the trading period can help you better identify trends. Ifthe price closes higher than it opened, you know investors were bullish onthe currency pair during the trading period. If the price closes lower than itopened, you know investors were bearish on the currency pair during thetrading period.You can see an example of a candlestick chart to the right.9Cornèr Bank Ltd. // Cornèrtrader // Tödistrasse 27 // 8002 Zurich SwitzerlandTel: 41 58 880 80 80 // Fax: 41 58 880 80 81 // info@cornertrader.ch // cornertrader.ch9
cornertraderTrade MentorDisclaimerThe curriculum is produced for the purposes of general education.None of the information contained herein constitutes an offer to purchase or sell a financial instrument or to make any investments.Cornertrader and / or Corner Bank do not take into account your personal investment objectives or financial situation and make norepresentation, and assume no liability to the accuracy or completeness of the information provided, nor for any loss arising from anyinvestment based on a recommendation, forecast or other information supplied from any employee of Corner Bank, third party, or otherwise.Trades in accordance with the recommendations in an analysis, especially, but not limited to, leveraged investments such as foreign exchangetrading and investment in derivatives, can be very speculative and may result in losses as well as profits. You should carefully consider yourfinancial situation and consult your financial advisor(s) in order to understand the risks involved and ensure the suitability of your situation priorto making any investment or entering into any transactions. All expressions of opinion are subject to change without notice. Any opinionsmade may be personal to the author and may not reflect the opinions of Cornertrader and/ or Corner Bank. Furthermore, please refer toCorner Bank and Cornertrader full General Disclaimer.Cornèr Bank Ltd. // Cornèrtrader // Tödistrasse 27 // 8002 Zurich SwitzerlandTel: 41 58 880 80 80 // Fax: 41 58 880 80 81 // info@cornertrader.ch // cornertrader.ch106
Charts are a forex trader’s best friend. As a Forex trader, you will most . trader Trade Mentor Disclaimer The curriculum is produced for the purposes of general education. . SR1998 CT Tutorial