Transcription
1800IEEE TRANSACTIONS ON NEURAL NETWORKS, VOL. 18, NO. 6, NOVEMBER 2007Quarterly Time-Series ForecastingWith Neural NetworksG. Peter Zhang and Douglas M. KlineAbstract—Forecasting of time series that have seasonal and othervariations remains an important problem for forecasters. Thispaper presents a neural network (NN) approach to forecastingquarterly time series. With a large data set of 756 quarterlytime series from the M3 forecasting competition, we conduct acomprehensive investigation of the effectiveness of several datapreprocessing and modeling approaches. We consider two datapreprocessing methods and 48 NN models with different possiblecombinations of lagged observations, seasonal dummy variables,trigonometric variables, and time index as inputs to the NN. Bothparametric and nonparametric statistical analyses are performedto identify the best models under different circumstances andcategorize similar models. Results indicate that simpler models,in general, outperform more complex models. In addition, datapreprocessing especially with deseasonalization and detrending isvery helpful in improving NN performance. Practical guidelinesare also provided.Index Terms—Forecasting, neural networks (NNs), quarterlytime series, seasonality.I. INTRODUCTIONFORECASTING of time series that have seasonal variations remains an important problem for forecasters. Seasonality is observed in many forecasting problems in business,economics, and naturally occurring phenomena [1], [2]. In someapplications, seasonality can drive a major part of movements inthe quarterly or monthly time series [2].There are numerous models and many different ways to analyze and forecast seasonal time series. Unfortunately, no singlemodel or modeling approach is best for all seasonal time series under different conditions as suggested by a large numberof theoretical and empirical studies including the recent M3forecasting competition [3]. Traditional approaches to modelingseasonal time series such as the classic decomposition methodrequire seasonal factors be removed before other factors canbe analyzed. Seasonal autoregressive integrated moving averageManuscript received May 4, 2006; revised January 18, 2007; acceptedFebruary 7, 2007. This work was supported in part by the InternationalInstitute for Forecasters and SAS under grant to support research on principles of forecasting. The work of G. P. Zhang was supported by the J. MackRobinson College of Business, Georgia State University, Atlanta. The workof D. M. Kline was supported by the Cameron School of Business ResearchFund, University of North Carolina at Wilmington.G. P. Zhang is with the J. Mack Robinson College of Business, Georgia StateUniversity, Atlanta, GA 30303 USA (e-mail: gpzhang@gsu.edu).D. M. Kline is with the Cameron School of Business Research, Universityof North Carolina at Wilmington, Wilmington, NC 28403 USA (e-mail:klined@uncw.edu).Color versions of one or more of the figures in this paper are available onlineat http://ieeexplore.ieee.org.Digital Object Identifier 10.1109/TNN.2007.896859(SARIMA) models also require that the data be seasonally differenced first to achieve stationarity. This practice of seasonaladjustment or removal is due to the belief that seasonal fluctuations may dominate the remaining variations in a time series,causing difficulty in effectively dealing with other time-seriescomponents. On the other hand, the seasonal adjustment approach has been cautioned or criticized by several researchers inrecent years [4], [5]. Ghysels et al. [6] suggest that seasonal adjustment might lead to undesirable nonlinear properties in univariate time series. Ittig [7] shows that the traditional methodfor generating seasonal indexes is biased when there is a trendcomponent. In addition, different forms of the trend can impact the estimate of the seasonal components and affect thelevel of overestimation in the seasonal variation [8]. Hyndman[9] argues that the interaction between trend and seasonality isbuilt into many seasonality models, which multiplies the taskof choosing the correct model form, and can further confoundthe selection of seasonal methodologies. Furthermore, severalempirical studies find that seasonal fluctuations are not alwaysconstant over time and at least in some time series, seasonalcomponents are not independent of nonseasonal components,and thus may not be separable. The difficulty in distinguishingseasonal from nonseasonal fluctuations is the major motivationbehind the recent development of seasonal unit root models andperiodic models that take explicit consideration of seasonal variations [5]. de Gooijer and Franses [10] point out that “althoughseasonally adjusted data may sometimes be useful, it is typicallyrecommended to use seasonally unadjusted data.”As a consequence of these conflicting results and recommendations, the practical issues of how to best deal with seasonaltime series and which seasonal model is the most appropriatefor a given time series are largely unsolved. In fact, adjustmentfor systematic events including seasonality is considered to bean area that still has a strong need for further research in developing and advancing forecasting principles [11].This paper aims to provide some evidence on the effectiveness of neural network (NN) models on forecasting seasonaltime series. More specifically, we explicitly investigate the practical issue of how to best use NNs to forecast quarterly time series using a large set of data from the M3 competition. Our research is motivated by the following observations. First, duringthe last decade, NNs have received enormous attention fromboth practitioners and academics across a wide range of disciplines. They are found to be a viable contender to various linearand nonlinear time-series models [12]–[14]. NNs, being nonlinear and data-driven in nature, may be well suited to modelseasonality interacting with other components, and may relievethe practical burden of a priori model selection. Although thereare several studies focusing on seasonal time-series forecasting,1045-9227/ 25.00 2007 IEEE
ZHANG AND KLINE: QUARTERLY TIME-SERIES FORECASTING WITH NEURAL NETWORKSfindings are mixed. For example, among the major studies ofNNs used for seasonal time series, Sharda and Patil [15] findthat NNs are able to directly model seasonality, and preseasonaladjustment of data is not necessary. Nelson et al. [16], however,conclude just the opposite and NNs trained on deseasonalizeddata perform significantly better than those with raw data. Considering both seasonal and trend components in real time series,Zhang and Qi [17] find that not only preadjustment of seasonality is important, but a combined approach of detrending anddeseasonality is most effective in forecasting performance.Second, most published NN studies use monthly data. Quarterly data have characteristics that are different from monthlydata. Little systematic studies have been conducted on quarterly time series with NNs. Swanson and White [18], [19] investigate the performance of NNs in modeling and forecastingnine quarterly seasonally adjusted U.S. macroeconomic time series and report positive results with NN models. However, thesestudies focus on the model selection issue and do not consider anumber of modeling issues such as seasonality and trend treatment. Callen et al. [20] report a study on NN forecasting of quarterly accounting earnings and conclude that “NN models are notnecessarily superior to linear time-series models even when thedata are financial, seasonal, and nonlinear.” This paper uses theseasonally unadjusted data and does not consider alternative approaches to dealing with both trend and seasonal components inthe data, which may explain the negative findings toward NNsas recent studies tend to indicate that properly modeling seasonality is the key to the improved forecasting performance.1Third, previous studies are either application specific or limited in scope and size (i.e., the number of data sets) and no systematic effort has been devoted to studying the general issue ofhow to use NNs to best model and forecast seasonal time series. That is, these studies focus on either a single application oron data sets that are relatively homogeneous. Therefore, findings from them may not be generalizable. For example, Alonet al. [21] and Chu and Zhang [22] consider forecasting issueswith one aggregate retail sales time series. Swanson and White[18] use nine macroeconomic time series such as unemployment rate, industrial production index, gross national product,and net exports of goods and services, etc. In [17], ten aggregateeconomic time series in retail sales, industrial production, andhousing starts are employed. In [20], a large sample size of 296time series is used, but all of the same type of accounting earnings. Although in [14]–[16] relatively large sample sizes fromthe M- and M3-competitions are used, these studies are limitedwith regard to the number of models considered and the numberof issues in dealing with seasonal and trend time series. In thispaper, we aim to provide a more comprehensive and systematicstudy on how NNs can be used for quarterly time series withmany more models and data sets from diverse areas.Last, we would like to evaluate the effects of incorrectly estimating NN models for quarterly time series. Since there are numerous approaches to building NNs to deal with different timeseries, some approaches may not be appropriate. For example,if a time series contains a trend component, an NN structure thatdoes not take this into consideration may not be the best model.1We have attempted to replicate their study. However, we were not able toobtain the data sets after a few contacts with the authors.1801On the other hand, an NN model that has a seasonal lag inputmay not be the best for nonseasonal time series.The rest of this paper is organized as follows. In Section II, wereview several relevant studies in the NN literature on modelingand forecasting quarterly or monthly time series. In Section III,we describe the research methodology used in our empirical investigation. Results are reported in Section IV. Section V provides the summaries and conclusions.II. FORECASTING SEASONAL TIME SERIES WITH NNSA large body of literature exists in seasonal time-seriesanalysis and forecasting. Some of the recent developments inseasonality modeling can be found in [4], [5], and [23]. Inthis section, our focus is on recent research efforts in seasonaltime-series modeling using the NNs.In an early effort of using NNs for seasonal time-series forecasting, Sharda and Patil [15] conduct a comparative study between NNs and ARIMA models. Among the 111 time seriesselected from the M-competition [24], 13 are annual series, 20are quarterly, and 68 are monthly. They use a direct modelingapproach without considering any specific issue of seasonalitymodeling. Results show that for quarterly and monthly timeseries, the performance of NNs is similar to that of ARIMAmodels. Thus, they conclude that NNs are able to “incorporateseasonality automatically.”Hill et al. [12] use a very similar set of quarterly and monthlytime series used in [15] and obtains much better results withNNs in terms of statistical significance when compared with thetraditional models. This difference in performance between twostudies may be attributed to the prior seasonal adjustment or deseasonalization before NN model building, indicating the importance of removing seasonality in improving NN forecastingperformance. However, only one NN architecture is consideredand employed in [12] for all quarterly or monthly time series.In [20], a sample of 296 quarterly accounting earnings seriesis used to compare the performance of NNs with that of severallinear time-series models. Although the size of the data set isquite large, all the time series are quite short, containing 89 datapoints. It is found that on average, linear models are significantlybetter than NNs with a rolling sample approach of 40 quarterseach in length for model building. However, as discussed earlier, Callen et al. [20] do not consider ways to handle seasonalvariations and raw data are directly modeled in NNs, which mayexplain the inferiority of NNs. In addition, the use of a relativelysmall portion of sample for NN training may cause instabilityin model estimation especially when considering the direct seasonality modeling approach.A recent study [25] using a sample of 283 quarterly earningsseries from a wide range of industries suggests that results reported in [20] can be dramatically improved. Although each series in this paper is still short with only 40 observations andthe direct seasonal modeling approach is used, the authors areable to obtain significantly better forecasting results with NNsthan those with linear time-series models, especially when fundamental accounting variables, such as accounts receivables, inventory, and capital expenditures, are incorporated in the NNmodeling.
1802In [26], a case study is presented for NNs in modelingand forecasting the well-known airline series popularized by[27]. The airline data contain 12 years of monthly totals ofinternational airline passengers and have a clear upward trendwith distinctive multiplicative seasonal patterns. This timeseries is well studied and documented with linear seasonaltime-series methods and thus provides a good benchmark forNNs. The focus of [26] is to use a variety of in-sample modelselection criteria including Akaike information criterion (AIC)and Bayesian information criterion (BIC) to select the bestneural model for the raw data. The seasonality is modeled byconsidering appropriate input lag such as lag 12 in the modeling process. The results indicate that NNs in general do notperform better than the Box–Jenkins model in out-of-sampleforecasting, even with the “best” NN models selected and several variations of modeling process including using logarithms,removing trend, and applying first and seasonal differencingfor data preprocessing.Swanson and White [18], [19] conduct several comparativeforecasting experiments between NNs and linear econometricmodels on nine macroeconomic time series. Although the dataare quarterly, most of them are seasonally adjusted and/or logdifferenced. Thus, their studies do not deal with seasonality directly. However, it is worth pointing out that they report positiveresults with NNs compared to other linear models examined.In [30], 24 time series of annual change in monthly industrialproduction in three European countries are used for a comparative study between NNs and linear autoregressive models. Unlike in [18] and [19], where seasonally adjusted data are used inNN modeling, Heravi et al. [30] choose to use seasonally unadjusted series due to the concern of potential nonlinearity inducedby the seasonal adjustment procedure. Although this direct seasonality modeling approach yields positive results with NNsin terms of the prediction of direction changes, linear modelsgenerally outperform NNs judging by root-mean-squared (rms)error.Terasvirta et al. [31] examine a number of linear andnonlinear models including NNs for forecasting 47 monthlymacroeconomic variables in seven developed economies. Forthose series that are not seasonally adjusted, monthly dummyvariables and 12 lags of observations are used in the linearmodels and NNs, respectively, to model seasonality. The resultsfor NNs are mixed with the model using Bayesian regularization having better forecasting accuracy than other models.Nelson et al. [16] focus on the issue whether the data shouldbe deseasonalized first in time-series forecasting using NNs.The study uses the 68 monthly series as in [12] and [15]. Forecasting performance is compared between NNs built on priordeseasonalized data and those with raw data. The results clearlyshow the advantages of prior deseasonalization in improvingNN performance. Thus, [16] points out that previous mixed results in seasonal time-series forecasting may be “due to inconsistent handling of seasonality”.Two studies [21], [22] report comparative results betweenNNs and a variety of linear models in forecasting monthlyaggregate retail sales. In [21], NNs are used to directly modelseasonal variation by using 12 lags of observations as inputvariables. Using two out-of-sample periods, they find that NNsIEEE TRANSACTIONS ON NEURAL NETWORKS, VOL. 18, NO. 6, NOVEMBER 2007perform the best in the first period which is characterized asmore volatile in terms of supply push inflation, recessions, andhigh interest and unemployment rates and the Box-Jenkinsmodels slightly outperform NNs in the second period whichis more stable in terms of the macroeconomic factors. In contrast, [22] considers a variety of ways of modeling seasonalityincluding deseasonalizing the time series and using seasonaldummies and trigonometric functions. Using five movingout-of-samples, they find that the overall best forecasting performance is achieved with a NN built on deseasonalized data.Zhang and Qi [17] provide some further evidence on the effectiveness of prior seasonal adjustment in NN forecasting improvement based on both simulation and real-data results. Itfinds that NNs are not able to deal with seasonality and trendeffectively with raw data and either deseasonalization or detrending can reduce forecasting errors dramatically. Furthermore, a combined approach of both detrending and deseasonalization is the most effective approach for NN modeling.From the aforementioned review of the relevant literature, wemake the following observations. First, mixed results have beenreported on the relative merits of NNs in modeling and predicting seasonal time series. Different ways to deal with seasonality and/or model building can have dramatic impact on theperformance of NNs. Second, no comprehensive studies havebeen performed with regard to large data set and various modeling considerations for seasonality. Third, a majority of studiesuse monthly data and only a few have focused on quarterly timeseries. Finally, deseasonalization is very effective. In almost allstudies that report significantly better results with NNs, data aretypically deseasonalized first before fitting an NN model.III. RESEARCH METHODOLOGYIn order to have a comprehensive understanding of the effect of NN modeling on the forecasting ability of NNs, we haveconducted a large-scale empirical study. A large set of quarterlytime series from M3-competition is used in this investigationalong with a large number of NN model structures. In addition,we examine the impact of several different data preprocessingapproaches on NN performance. Several research questions areof interest to us as follows.1) Is there an overall best way to model quarterly time serieswith NNs?2) Are NNs able to directly model seasonality in quarterlytime series? Given that NNs are data-driven and can modelarbitrary functional forms, it is theoretically possible thatan NN could directly model seasonality. However, theremay be practical limitations, notably data sufficiency andnonlinear optimization issue that could make this approachunsuccessful.3) Given the controversies around the seasonal adjustment approach, should the data be seasonally adjusted first? Shouldthe data be preprocessed first, removing all significant patterns such as seasonality and trend?4) Is inclusion of seasonality information such as seasonaldummy variables or trigonometric variables in NN modeling helpful in improving forecasting performance? Traditional seasonal methods utilize the information about seasonality regarding which season the data points are in.
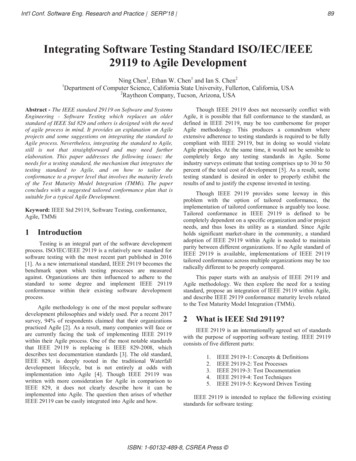
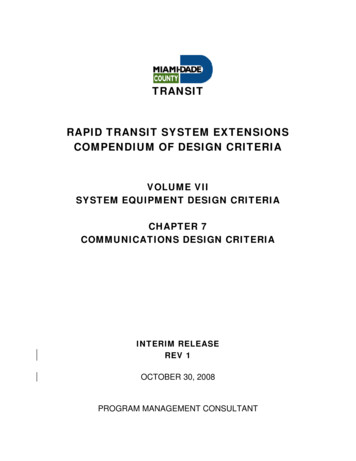
ZHANG AND KLINE: QUARTERLY TIME-SERIES FORECASTING WITH NEURAL NETWORKS1803TABLE ICHARACTERISTICS OF QUARTERLY TIME SERIES FROM M3-COMPETITIONNNs are known to be parameter-heavy. Including additional variables in an NN model can greatly increase thenumber of parameters in the model and cause data insufficiency. However, the added information may simplify theproblem, and thus, they require fewer hidden nodes to approximate the underlying functional form. It is unclear howthese concerns will play out in practice.A. DataIn this paper, we use the 756 quarterly time series from the M3forecasting competition [3]. The M3 competition data set is wellstudied, contains time series of various lengths and differenttypes, and exhibits linear and nonlinear patterns [32]. Thus, thedata set provides a sufficient test bed on which various modelscan be built and compared, and general conclusions may be obtained. Table I provides a summary of sample characteristics forthe data set with regard to the frequency and size for each typeof time series. It is clear that most series are macroeconomic(44%) and microeconomic variables (27%) and the sample sizevaries from 16 to 64 with the median length of 44 observations.In fact, 44 is not only the median, but also the mode of the dataset with 249 time series having this length (33%).For each series, we consider two data preprocessing approaches. One is the application of the natural logarithm to eachobservation, which we call “log,” for the data transformationmethod and the other is the detrending and deseasonalization inaddition to the log transformation, for which we call the “full”transformation method. For detrending, we fit a linear trend,and then subtract the estimated trend component from the rawdata. For deseasonalizing, we employ the method of seasonalindex based on centered moving averages, following the classicadditive decomposition. The parameters for the detrendingand deseasonalization are calculated with only the in-sampledata. The estimated seasonal index is then used for seasonaladjustment of the time series and for out-of-sample forecasting.Note that there are other methods to remove seasonality. Forexample, Atiya et al. [33] subtract the time series from theseasonal average to obtain seasonally adjusted series. A novelalgorithm based on Fourier transformation to deal with theseasonality is also proposed in [33].In addition to these transformations, all data are scaled tobe withinbefore presenting to the NN. We make thedistinction between a data transformation that is performed toaddress characteristics of a particular time series, and a datascaling that is applied to facilitate NN training. After NN modeling, the data are rescaled back following the reverse of thedata transformation and scaling, and all the performance measures are calculated based on the original scale of the data.In summary, we consider the following three data types: rawunprocessed data (raw), log-transformed data (log), and fullytransformed data (full).We also realize that although all 756 time series are quarterly,they are not necessarily all seasonal. Therefore, we try to distinguish seasonal time series from nonseasonal ones and then someinsights may be obtained to see whether some models performbetter than others on seasonal versus nonseasonal series. In thispaper, we employ the following simple rule-of-thumb [34]: If, wherethe four-period autocorrelation is greater thanis the sample size, then the series is classified as seasonal; otherwise, it is nonseasonal. Using this rule, we find that 473 timeseries are judged as seasonal and the rest are nonseasonal.The last 30% of each data series is retained as holdoutsample or out-of-sample to measure forecast accuracy of eachmodel. The remaining data set is used as the in-sample formodel building. Although all M-competitions use the practice of leaving the last eight data points for out-of-sampletesting, because of the sample size limit, we elect to choose theaforementioned rule in data splitting because the data set wehave from the M3-competition does not include the last eightpoints reserved by the competition organizer for performanceevaluation.B. ModelsWe identify 48 NN models based on different possible combinations of lagged observations, seasonal dummy variables,trigonometric variables, and time index as inputs to the NNmodel. Since one-step-ahead forecasting is the focus of thispaper, we use only one output in all NN structures. Table II summarizes the models used in this paper based on the relationshipbetween the output variableand a variety of possible inputs such as past lagged observationsandseasonal dummy variables. Models 1–6 consider six combinations of pure lagged observations as inputs to the NNs. Note thatmodels 1–3 can be treated as nonseasonal while models 4–6 areseasonal as they include the observation four quarters before.These six models serve as the base models upon which we adda few more inputs to form other models. For example, the use oftrigonometric or seasonal dummy variables may improve forecasting performance. Thus, we add seasonal dummy variablesto each base model to form models 7–12. For quarterly data, weneed only three dummy variables and quarters 1–4 are coded as(1, 0, 0), (0, 1, 0), (0, 0, 1), and (0, 0, 0), respectively. Models13–18 are similar to models 7–12, except we use trigonometricvariables ofandinstead of dummy variables. Models 19–24 add annual difference as one more input to
1804IEEE TRANSACTIONS ON NEURAL NETWORKS, VOL. 18, NO. 6, NOVEMBER 2007TABLE IIMODELS USED IN THIS PAPERthe base models. Annual difference is defined asand can be considered a rough estimate of trend [20]. Models25–30 add the time index to model the trend component.Models 31–48 are the same as models 7–24 except that, formodels 31–48, we have added time index variable.These 48 models represent a wide range of possible NNinput–output structures for modeling seasonal time series.Although there could be more possible NN structures with different input values, we believe these models are representativein practice to model and forecast quarterly time series. Some ofthem are suitable for time series without trend and/or seasonalpatterns. Some will be useful for trend or seasonal time serieswhile still others may be able to handle multiple componentssuch as trend, seasonality, and other significant patterns. Theselayered models also allow us to see whether one particulargroup of models (such as the six base models) is more effectivethan others.We use the Matlab NN toolkit for building NNs and makingforecasts. The Levenburg–Marquardt training algorithm is usedto minimize the sum of the squared errors (SSE) on each network. Training is stopped after 300 epochs, or until the algorithm stops improving the SSE. Each NN architecture is trainedfive times using different random starting weights. Then thebest one is kept based on the lowest SSE. All in-sample datapresented to the NN (inputs and targets) are scaled to betweenusing Matlab’s “premnmx” function, which returns parameters to accomplish the reverse transformation. All out-ofsample data are transformed using the in-sample parameters determined in the training stage.Our experimental design can be represented by the followingmodel:wherethe performance measure;the data series used (756 levels);the data transformation performed on the data series(three levels);the model form used for the forecast (48 levels).That is, our study generates for each series three different datasets based on whether transformation is used and if so which oneis used, and for each data set, 48 different models are built, eachwith six levels of different hidden nodes. The total number ofobservations we obtain with the best NN architecture is.The following pseudocode describes the methodology usedin training NNs.C. NNsFor each time series, NN models are built with an in-sampleselection approach. We use the standard three-layer feedforwardNNs, which is by far the most popular type of NN model fortime-series forecasting, although other types of NNs may beequally competent [35]–[37]. Node biases are used at the hiddenand output layers. A sigmoid transfer function is employed ateach hidden node and a linear transfer function is used at eachoutput node. As mentioned earlier, we use one output node forone-step-ahead forecasting. The number of input nodes is basedon the models identified in the last section. As the number ofhidden nodes is not possible to determine in advance, empiricalexperimentations are needed to determine this parameter. Because of the very small sample size for many of the series, welimit our experimentation to only six possible values of hiddennodes: 0, 1, 3, 5, 7, and 9. The value of 0 is included to havea benchmark linear autoregressive model. The best number ofhidden nodes is determined by using the original Akaike’s information criterion (AIC).22Asan early try, we used the generalized cross-validation (GCV) metric asan in-sample selection criterion [14]. GCV has a cost parameter that has to beestimated subjectively. We used 2.0 as in [14]. However, with small sample size,some technical difficulty can arise in using GCV such as the division by zeroand a small change in the parameter causing a big difference in how sensitivethe measure is to the size of the model. This is the reason we abandoned thiscriterion. A modified version of AIC was recently proposed in [38].For each data seriesFor each data transformationLinearly scale in-sample data toparameters, retainingFor each model formFor NN architectures with hidden nodes ofTrain five NNs from random starting parameterweights.Keep the best of the five based on SSELinearly scale the out-of-sample data using parametersfrom in-sample (from above)Using the best network architecture and parameterset, perform forecast on out-of-sample dataUnscale the forecastsUntransform the forecasts using the appropriateinverse transformation
ZHANG AND KLINE: QUARTERLY TIME-SERIES FORECASTING WITH NEURAL NETWORKSRecord the MAPE, RMSE, MAE on the unscaledout-of-sample forecasts and actual observationsIV. EMPIRICAL RESULTSAlthough we use a variety of performance measures in thispaper including root-mean-squared error (RMSE), mean-absolute err
1800 IEEE TRANSACTIONS ON NEURAL NETWORKS, VOL. 18, NO. 6, NOVEMBER 2007 Quarterly Time-Series Forecasting