Transcription
Trendline Analysis by Louizos Alexander Louizos, http://www.easytradeforex.com1
Trendline Analysis by Louizos Alexander Louizos, http://www.easytradeforex.comTRENDLINE ANALYSISGreat breakthroughs have surfaced with electronic trading and certain technical indicatorsare widely used. Nevertheless an affluent trader should be very skilled with trendlineanalysis in order to correctly predict Forex price movements. “Trend is my friend” iscommonly said among traders. In this chapter you will learn how to correctly applytrendline analysis, one of the most important tools in your trading analysis.Market moves following some patterns. Movement of the market is either up (upwardmarket), down (downward market) or sideways (flat or non trending market). Alwaysavoid flat markets because market is fighting to make a decision and trading signalsare cancelled because of the market sentiment. Watch bellow a real market example offlat type of movements. Remember: the longer the flat market the greater theoutbreak will be because when market decides the next direction then a new trendevolves and many traders follow this trend.Figure 1. This figure shows a flat market2
Trendline Analysis by Louizos Alexander Louizos, http://www.easytradeforex.comFigure 2 See what happened after the flat market finished. A strong uptrend evolved.Figure 3 This figure displays a downtrend market environment3
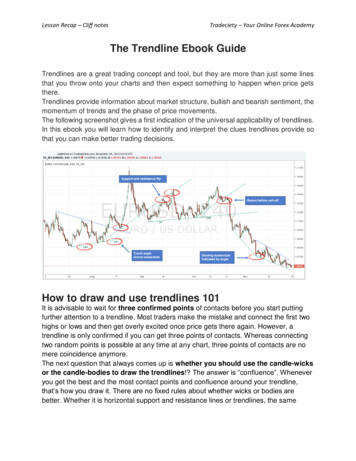
Trendline Analysis by Louizos Alexander Louizos, http://www.easytradeforex.comAlways remember: the longer the time period the most accurate your analysis willbe. Always look the longer time charts and transfer your analysis to shorter timeperiod. This last tip is something that is only referred in this book and can only beacquired through experience in trading. For example in a daily chart market may lookflat and non decisive and in 1 hour chart you may recognize a trading signal. In thisoccasion you should be very skeptical. Or worst, daily charts shows downward trend and1 hour chart shows a trading signal to get long. This way you may be caught up in thewrong direction. Continue reading to learn exactly how to avoid these traps.SUPPORT AND RESISTANCE LEVELSMarket prices move in zig zag fashion. Peaks represent the price where more people sellthan buy so market couldn’t overcome this price. These prices are called resistancelevels. The troughs on the other hand represent the price where buying pressure washigher than selling. These troughs are called support levels. Connecting consecutivepeaks a trader has a resistance line and connecting resistance levels a trader hassupport line.The first you have to learn is to draw support or resistance lines correctly and how toevaluate the significance of each line whether it is support or resistance.When you realize that the market is upward trending you should draw a resistance line.To draw a resistance line pick up two peaks and draw the line connecting these peaks.See figure below. When a third contact point occurs then trendline is confirmed.Generally currency markets maintain its direction of trend.4
Trendline Analysis by Louizos Alexander Louizos, http://www.easytradeforex.comFigure 4 A resistance line in an uptrendFollow these rules to see whether your trendline is significant:1) At least two peaks are connected. More connecting peaks confirm the trend line.2) Most significant trend lines occur around the angle of 45 degrees. Trendline atsharper angles are indicating that trend is strong. Lower level trendlines indicatethat trend is close to reversal.3) Longer period trendlines should be given increased weight. Day charts trendlinesare more significant that 1 hour charts.4) Minor trendline penetrations (as long as 1%) should and may be disregarded.When connecting two peaks never mind about a peak penetrating a bit thetrendline.5) When you draw a trendline in candlestick or bar charts and connect two peaks ortroughs and there is an intermediate shadow over the trendline this is notconsidered a break as long as the closing price is below the trendline See figure2.135
Trendline Analysis by Louizos Alexander Louizos, http://www.easytradeforex.comThe same apply for connecting two troughs although the trendline is namedsupport. Support lines are drown in downtrend marketsFigure 5 Support line is drown is a downtrend marketThe most important thing about support and resistance lines is that when aconfirmed support or resistance is broken then broken trend line is retested andsupport line becomes resistance and resistance becomes support. Notice below howthe support line when broken became resistance.6
Trendline Analysis by Louizos Alexander Louizos, http://www.easytradeforex.comFigure 6 A broken resistance line is broken then retested and became supportThis way you already have the first prediction utility of market movement. Watchcarefully market when it reaches significant support of resistance levels.Test a lot with trend line support and resistance and channel designing (see below forchannels). These are one of the most important tools you will ever use so it is very crucialto know how to use them correctly.FOREX CHANNEL LINESOne of the most important elements of trendline resistance is channels.Channels are two parallel lines that restrict price action. In order to draw a channel youshould first draw a support or resistance line.To draw a support or resistance line select an obvious trend and connect two hi or lowpoints of price action. Then draw a parallel to the first line that restricts price movements.That is the channel line. When price fails to reach support or resistance and is closerto channel line then we may see acceleration of the trend. When price fails to reach7
Trendline Analysis by Louizos Alexander Louizos, http://www.easytradeforex.comchannel line then the ongoing trend may be weakening. Channel breakout meansthat the prices retest the broken channel line. After successfully retesting of channellines we have a price target at least equal to the channel width.Channel lines act as resistance and support. When broken they are usually retested. Thistest gives us a trade entry point. If channel lines are at the same level as a Fibonacciretracement level then price reversal is imminent because Fibonacci resistance gives extrasupport to price action (you may take a look at our Fibonacci trading chapter in this booknow). Look at the figure 2.14. It is an 11-17-2006 EUR/USD chartFigure 7 Channel lines in an uptrend with Fibonacci levelsLook how the broken channel line is retested and then price action reverses. Watch theprice target or the broken channel line equal to the width of the channel. Also notice howthe channel line with added Fibonacci 50% support line restricted price action. This trade8
Trendline Analysis by Louizos Alexander Louizos, http://www.easytradeforex.comsetup may be used as a trading system. Feel free to use it and see profits come. This setupis one of the favorites for professional fund managers.TRENDLINE CHART FORMATIONSThere are chart formations indicating the reversal or continuation of a trend. Thesepatterns occur in any time frame although the higher the time frame the more significantthey are. We shall study at first trend reversal patterns. This means than when yourecognize these patterns in a chart there is a high probability that the current trend willreverse.HEAD AND SHOULDERSName of this formation is given after its shape. This formation looks like a head andshoulders. It consists of three consecutive rallies all based in the same support line namedneckline. The two shoulders should be almost equal on height and head should be thehighest. You may enter the market during retest of broken neckline. The most significanthead and shoulders pattern is in weekly or monthly or daily charts. Head and shoulderson lower time frame are unreliable. Price target is the length between top of head andneckline.9
Trendline Analysis by Louizos Alexander Louizos, http://www.easytradeforex.comFigure 8 A head and shoulders pattern in a daily chart.In real market environment head and shoulders almost never appears as clean as theschematic. Trader must be careful not to misinterpret false head and a shoulder keepingin mind that neckline is seldom a perfect horizontal line although the significant point ofthe formation should be tangential to the neckline. The same applies to inverse head andshouldersFigure 9 Inverse head and shoulder pattern.10
Trendline Analysis by Louizos Alexander Louizos, http://www.easytradeforex.comLook at the above market examples carefully. Then check the schematic below. Practicea lot. In order to recognize head and shoulders in market environment your eye should beflexible enough.Figure 10. Schematics of head and shoulders patternDOUBLE TOP AND DOUBLE BOTTOMThis formation consists of two consecutive peaks or troughs of approximately the sameheight. The more equal the height the more significant the formation. Resistance line isformed connecting the two tops.Figure 11 Schematics of double bottom and double topConsider these in order to validate the formation:1) The higher the time frame the more valid the formation11
Trendline Analysis by Louizos Alexander Louizos, http://www.easytradeforex.com2) Contact points should be tangential to the resistance line. In real marketenvironment contact points cannot be perfectly tangential. Take this into accountwhen deciding whether a formation is a valid double bottom or not.3) You should only trade upon confirmed break and retest of resistance line.Breakout confirmation consists of a closing price outside the resistance line.4) Target price is relevant to price and time symmetry and make take long to befulfilled.Figure 12 Double bottom in real market environmentTRIPLE TOP AND TRIPLE BOTTOMThe same apply to triple top and triple bottom formation. This formation is a hybridof double top or bottom and head and shoulders.TREND CONTINUATION PATTERNSThese patterns signal the continuation of the previous trend. Unlike trend reversalpatterns they consist of short consolidation periods.12
Trendline Analysis by Louizos Alexander Louizos, http://www.easytradeforex.comFLAG FORMATIONIt looks like a flag. It consists of a steep upward or downward trend (flagpole) and abrief consolidation period which tends to be sloped in the opposite direction of thetrend or it is simply flat. Consolidation is bordered by support and resistance lineswhich are parallel or mildly converging to each other. These lines give the flag. Whenprice breaks out of consolidation price target is the length of the flagpole measuredfrom the point of breakout. The higher the time period of flag formation the morevalid the signal. Beware of false breakouts from the flag.Figure 13 A bearish flag13
Trendline Analysis by Louizos Alexander Louizos, http://www.easytradeforex.comFigure 14 Another bearish flagPENNANT FORMATIONPennants are the same as flags with the difference that support and resistance lines ofconsolidation period converge much more than flags.Figure 22 A bearish pennantFigure 15 A bullish pennant14
Trendline Analysis by Louizos Alexander Louizos, http://www.easytradeforex.comTRIANGLE FORMATIONTriangles are pennants with no poles. There are four types of triangles:1) Symmetrical: it consists of two symmetrically converging resistance and supportlines with at least four significant points (eg. 2 on resistance and 2 on support).This pattern visualized the ambivalence of Forex market balance between supplyand demand and breakout may occur on either side.2) Ascending triangle: Flat resistance line and rising support line. The breakoutshould occur on the upside with price objective the width of the base of trianglemeasured above the breakout3) Descending triangle: Flat support line descending resistance. Breakout shouldoccur on the downside.4) Expanding triangle. Support and resistance lines converging towards thebeginning of the formation. Expanding triangles are rare in Forex Market.In real market environment do not expect to find absolutely flat lines. Support andresistance lines should be designed according to hi/low of the prices. Take good care indesigning these patterns.15
Trendline Analysis by Louizos Alexander Louizos, http://www.easytradeforex.comFigure 16 A descending triangleFigure 17 An ascending triangle16
Trendline Analysis by Louizos Alexander Louizos, http://www.easytradeforex.comFigure 18 A symmetrical triangleWEDGE FORMATIONSIt resembles the shape of triangles but it behaves like a pennant without a pole. It signalsonly continuation of the trend with no price objective. It is heavily sloped and breakoutoccurs to the opposite direction of the slope. There are two type of wedges: falling andrising.Figure 19 A falling wedge17
Trendline Analysis by Louizos Alexander Louizos, http://www.easytradeforex.comFigure 20 A rising wedgeRECTANGLE FORMATIONThis formation reflects a consolidation period. Breakouts may occur on either side andprice objective is the height of the triangle.18
Trendline Analysis by Louizos Alexander Louizos, http://www.easytradeforex.comALWAYS REMEMBER1) Always try to design these patterns in longer term time charts and on linecharts. If you prefer to use candlesticks use the shadows as contact point foryour resistance and support lines.2) False breakouts are common so do not be trigger-happy with your tradesuntil it becomes clearer. False breakouts tend to occur more often in the caseof continuation patterns. Valid breakout on the other side shows thecontinuation pattern we thought we designed was a reversal pattern. Designyour patterns carefully.]I hope you enjoyed this ebook. For more tutorials you could visit my site athttp://www.easytradeforex.comSincerely yours,Louizos Alexander Louizos19
Great breakthroughs have surfaced with electronic trading and certain technical indicators are widely used. Nevertheless an affluent trader should be very skilled with trendline analysis in order to correctly predict Forex price movements. “Trend is my friend” is commonly said among trade