Transcription
View metadata, citation and similar papers at core.ac.ukbrought to you byCOREprovided by Elsevier - Publisher ConnectorAvailable online at www.sciencedirect.comScienceDirectProcedia Engineering 144 (2016) 1138 – 114912th International Conference on Vibration Problems, ICOVP 2015Design of Suspension System for Formula Student Race CarSamant Saurabh Y., Santosh Kumar, Kaushal Kamal Jain, Sudhanshu Kumar Behera,Dhiraj Gandhi, Sivapuram Raghavendra, Karuna Kalita*IIT Guwahati, Guwahati, Assam-781039, India.AbstractIn this work, we presented in detail the design procedure of the front double A-arm push rod suspension system for aformula student race car. The type of suspension systems used generally are reviewed. The CAD models of thecomponents in the suspension system are made using SolidWorks and the Finite element analysis of thecomponents is done using ANSYS Workbench. Both kinematic and dynamic analysis of the designed suspensionsystem is performed. The results of vibration or ride analysis and roll steer analysis are also presented for thedesigned suspension system. The method for spring design is elucidated. This work emphasizes the method fordesigning and analyzing the suspension system for a race car in various aspects. 2016Publishedby ElsevierLtd. Ltd.This is an open access article under the CC BY-NC-ND license 2016TheTheAuthors.Authors.Publishedby lityof theorganizingcommitteeof ICOVPPeer-review underof theorganizingcommitteeof ICOVP2015 2015.Keywords: Pushrod; Pullrod; A-Arm; Caster; Camber; Toe.1. IntroductionA Formula student race car is a simplified version of Formula One race car designed and built by the universitystudents for competitions like FSAE, Supra SAE, and Formula Student etc. Suspension plays a major role duringrace car racing. Generally, in race a car, double wishbone suspension with either pullrod or pushrod is used owing toease of design and lighter components involved [1]. However, various combinations of pushrod and pullrod* Corresponding author.E-mail address:karuna.kalita@iitg.ernet.in1877-7058 2016 The Authors. Published by Elsevier Ltd. This is an open access article under the CC BY-NC-ND nd/4.0/).Peer-review under responsibility of the organizing committee of ICOVP 2015doi:10.1016/j.proeng.2016.05.081
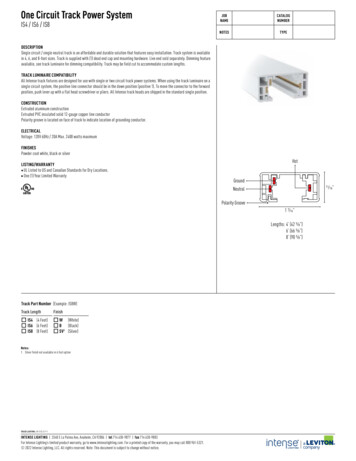
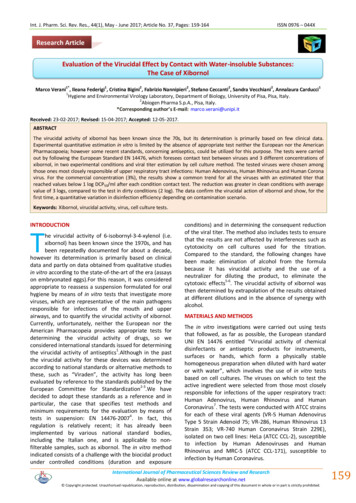
Y. Samant Saurabh et al. / Procedia Engineering 144 (2016) 1138 – 11491139suspensions have been used in the front and the rear. For example, as mentioned in [2], Formula one cars generallyuse pushrod is used in the front because with pull rod in rear. As evident from [3, 4, 5] this combination is quitepopular in formula student vehicles too. Some student formula vehicles like [6, 7, 8], have used a reversecombination i.e., pullrod in front and pushrod in rear. Many formula student cars as in [9, 10, 11] also use eitherpushrod or pullrod suspension in both front and rear. This paper presents the procedure of design and analysis (bothkinematic and dynamic) of the front double A-arm push-rod suspension system for a formula student race car.The design of suspension of a race car is complex; hence there is a need to have a procedure by following whichthe suspension system can be designed. This paper proposes a procedure which involves kinematic and dynamicanalysis followed by vibration analysis for the design of a Double A-arm pushrod suspension system. The resultsinclude kinematic position of linkages and specifications of spring-damper. These results were validated through rollsteer analysis of the suspension. In most of the literature like [12], the kinematic analysis of double wishbonesuspension is carried out by assuming the suspension geometry to be a two dimensional 4 bar mechanism. However,this analysis is an approximation because of the presence of spherical joints in the actual suspension system. Hence,in the proposed procedure, the kinematic analysis was done using three dimensional graphical method and thechange in wheel alignment was plotted with the wheel travel [13]. From the static and dynamic analyses, stiffness ofthe spring was calculated. Damping ratio was calculated by analyzing the quarter car model of the vehicle. Thecalculated values of stiffness and damping ratio were validated through roll steer analysis.2. Design2.1. Design ExpectationsThe suspension is designed so as to satisfy following design criterion:xxxxEasy to design and manufactureUsable wheel travel of at least 50.8 mm, 25.4 mm jounce and 25.4 mm) rebound.Roll centre sufficiently above ground for good lateral stability.Small variations in camber and toe angles during the desired wheel travel.2.2. Design ExpectationsxxxxxCo-ordinates of mounting points and dimensions of A-arms and pushrod.Height of roll centre from the ground and wheel alignment (caster, camber and toe angle) at car’s standstillposition with a 75 kg person seated inside.Dimensions of the knuckle.Co-ordinates of mounting point and dimensions of the bell crank.Spring constant and damping ratio of the spring-damper.2.3. Design ProcedureHeight of the roll centre was decided to be 50mm from the ground. Generally race car prefers negative camber inorder to have lateral force and toe out due to ease while turning. The values of camber, caster and toe angles weredecided to be -1o, 5o and 1o [13]. These values would be attained when the vehicle is in a standstill position with a75 kg person seated inside. Taking these design decisions as constraint, an iterative design procedure was followedto make the rest of the design decisions. The first decision to be made was the coordinates of mounting points anddimensions of the A-arms. From the survey of commercially available knuckles, the King Pin inclination of 7o andvertical distance between mounting points of lower and upper A-arms of 205mm along with a track width of1200mm was chosen for the first iteration. The coordinate system shown in Fig.1 was followed throughout theprocedure.
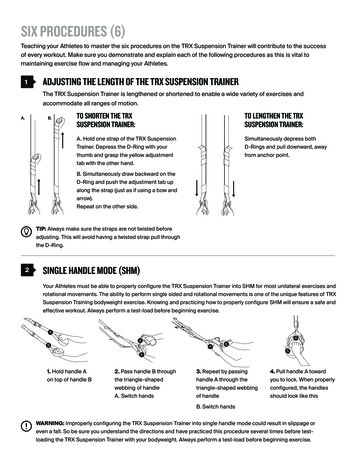
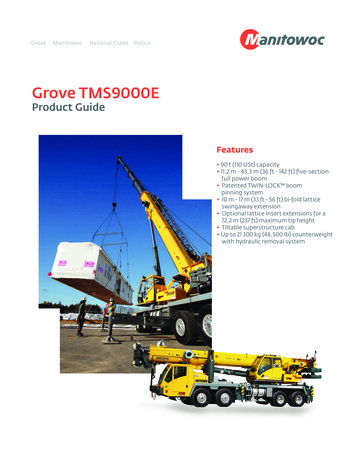
1140Y. Samant Saurabh et al. / Procedia Engineering 144 (2016) 1138 – 1149Figure 1. Coordinate System and CAD Model of the Final Suspension DesignThe mounting points of the A-arms on chassis were labelled as shown in Fig. 2. Keeping the length CD fixed,lengths AB, BC and AD were varied and graphs were plotted for variations in the wheel alignment with the wheeltravel, using the kinematic analysis carried out in section 2. The geometry with minimum variation in wheelalignment with wheel travel was finalized.Figure 2. Front Suspension (a) Isometric view (b) Front view with labellingThe next decision to be made was the coordinates of mounting points and dimensions of pushrod and bell crank.One end of the pushrod was mounted on the lower A-arm at point E. Due to the space constraints on the chassis, themaximum length of spring (IG) was fixed and the maximum compression of the spring was decided to be 25.4mm.Thus the final problem was the maximum and minimum angles of line HG for 25.4mm movement of the spring.The maximum and minimum angles of line AE was also known for 25.4mm jounce and 25.4mm rebound. Thus, itwas a problem of four bar mechanism in which the length of central link (HA) was fixed and the range of angles forinput link (GH) and output link (AE) known. The problem was solved by geometrical constructions to find the pointF as the mounting point of push rod on bell crank. Thus the shape of bell crank was decided. After deciding thegeometry, the finite element analysis of each link and the performance of suspension (ride, roll and pitch analysis)were carried out using dynamic analysis demonstrated in section 4. An iterative procedure was carried out untilsatisfactory kinematic and dynamic results were obtained.3. Kinematic Analysis3.1. AimThe kinematic analysis of the suspension was carried out to:x Evaluate the change in wheel alignment i.e. Caster, Camber and Toe angles during the wheel travel of75mm (37.5mm jounce and 37.5mm rebound) and steering.
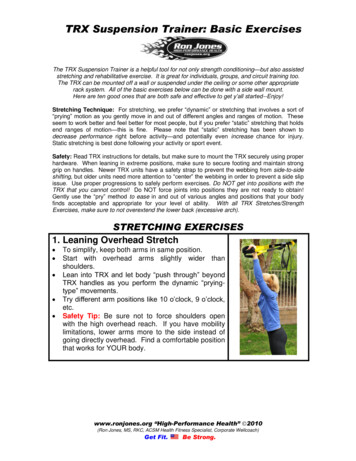
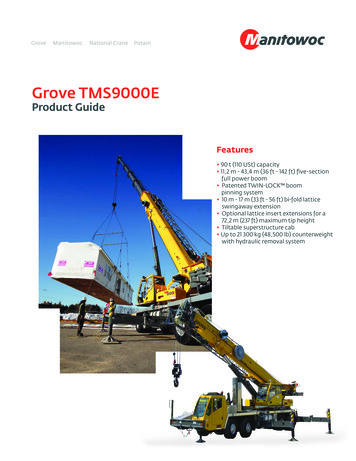
1141Y. Samant Saurabh et al. / Procedia Engineering 144 (2016) 1138 – 1149x Check the maximum and minimum length of the spring during wheel travel.The minimum and maximum length of the spring were directly measured from SOLIDWORKS software bykeeping the wheel at lowest (max jounce) and highest point (max rebound). Hence the kinematic analysis wascarried out to check the wheel alignment.3.2. Evaluation of change in wheel alignmentThe kinematic structure of the pushrod suspension (relevant for wheel alignment analysis) is represented by Fig.3.Figure 3. Kinematic Structure of Pushrod SuspensionSince, the suspension consists of Z-axis pin joints (Ur, Uf, Lr and Lf) as well as spherical joints (Uk, Lk, Tk andTc), it is a 3-D mechanism and hence, the kinematic analysis was carried out using 3-D graphical method. It wasassumed that the coordinates of points Uf, Ur, Lr, Lf and Tc and the initial coordinates of Uk, Lk and Tk are known.In order to simplify the analysis, each A-Arm was represented as a single link (Uk-Uc or Lk-Lc) as shown in Fig.4.The modified kinematic structure is as shown in Fig.5.UTUcLkTcLcFigure 4. Simplifiedfied representation of A-ArmsFigure 5. Modified Kinematic Structure of SuspensionuThen, the following were to be calculated from the initial coordinates of all the pointss as they were usedasconstants during the analysis:x Length of modified upper A-Arm (dU), lower A-Arm (dL) and Tie Rod (dT).x Distance between Lk and Uk (dK).x Perpendicular distance between Tk and the line joining Uk and Lk (dP).x The ratio (r) in which perpendicular from Tk divides the line joining Uk and Lk.With the points Lc, Uc and Tc fixed, and the aim of the kinematic analysis was to find the coordinates of pointsLk, Uk and Tk so as to find the wheel alignment. For a given angle of lower A-Arm with the horizontal (θ) andtaking Lc as origin, the coordinates of Lk came out to be (-dLcos θ, -dLsin θ, 0). Out of the two points of
1142Y. Samant Saurabh et al. / Procedia Engineering 144 (2016) 1138 – 1149intersection of the sphere with centre as Lk and radius dK and the circle with centre as Uc, radius dU and axis as Zaxis; the point that was closer to the previous coordinates of Uk was chosen to be Uk. The point dividing the linejoining Uk and Lk in the ratio r was named R. Out of the two points of intersection of the sphere with centre as Tcand radius as dT and the circle with centre as R, radius dP and axis as line joining Uk and Lk, the point that wascloser to the previous coordinates of Tk was chosen to be Tk.Caster was obtained by finding the angle between the projection of the vector Uk-Lk on YZ plane and Y axis.Camber was obtained by finding the angle between the projection of the vector Nk on XY plane and the X axis.Here Nk is the cross product of (Lk-Uk) and (Tk-Uk) and hence, the normal to the knuckle plane. Toe was obtainedby finding the angle that the projection of the vector Nk on XZ plane made with the X axis. Using the abovemethodology, the wheel alignment was calculated for θ ranging from -5o to 5o and the plots of caster, camber andtoe verse the wheel travel were obtained (Fig 11).4. Static and dynamic analysisThe static and dynamic analysis was carried out in order to obtain the spring stiffness and calculate the maximumloads on each component respectively. Fx, Fy, Fz were taken as the lateral, vertical and longitudinal force acting onthe wheel respectively. At the static condition, the vertical force acting on the wheel would be the total weighttransfer on front wheel and the lateral and longitudinal forces acting on the wheel would be zero. From the force andmoment balance equations about joints, forces on corresponding linkages were calculated [7]. All the terms used inthe equations are explained in Appendix A (Ref Fig 6).Figure 6. Wheel, A-arms alignmentͲ Ͳ ۍ ێ Ͳ ێ ͳ ێ Ͳ ێ ߙ݊ܽݐۏ ଶͳ Ͳ Ͳ Ͳ Ͳ െͳ ͲͳͲͲͲͲ Ͳ Ͳ Ͳ ͳ ݕܮ Ͳ ͳ Ͳ ݖܮ Ͳ ݔܮ Ͳ ܨ ௬ െ ܹ௧ ܨ ௨௫ Ͳ ې ۍ ې ܨ ۍ ې െ ܨ ௭ ͳ௨௬ ۑ ێ ۑ ێۑ െ ݐ ௫ ൫ ܨ ௬ െ ܹ௧ ൯ െ ܨ ௭ ݐ ௬ ۑ ܨ ێ ۑ ݕܮ ௨௭ ێ ۑ ൌ ۑ Ͳ ܨ ێ ۑ ௫ ێ ۑ െሺ ܨ ௫ ܨ ௦௧ ሻ ێ ۑ Ͳ ܨ ێ ۑ ௬ ۑ ێ െ ܨ ௦௧ ݏ െ ݐ ௫ ൫ ܨ ௬ െ ܹ௧ ൯ െ ݐ ௬ ܨ ௫ ۑ Ͳ ܨ ۏ ے ௭ ۏ ے ͲǤͷܹ ے (1)௨ By solving equation (1), all the forces acting on knuckle ball joints were obtained. Ͳ ۍ ͳ ێ Ͳ ێ Ͳ ێ ێ Ͳ ێ Ͳ ۏ Ͳ ͲͲ ͳ Ͳ Ͳ Ͳ Ͳ Ͳ Ͳ ͳ Ͳ ሺ ߙ݊ܽݐ ଵ ሻ ͳ Ͳ ͳ Ͳ Ͳ Ͳ ͳ ݊ܽݐ ˁ Ͳ ݊ܽݐ ˁ௦ ܨ ௬ ͲǤͷܹ௨ ܨ ௫ ߙ݊ܽݐ ଵ Ͳ ܨ ۍ ې ௫ ې ۍ ې ܨ ௬Ͳ ۑ ͳ ێ ۑ ێ ۑ ܹ Ͳ ܨ ێ ۑ ௭ ۑ ൌ ێ ۑ െͲǤͷܹ ݊ܽݐ ˁ Ͳ ܨ ێێ ۑۑ ௫ ۑۑ ێ ۑ Ͳ ێ ۑ ͳ ܨ ێ ۑ ௬ ۑ ۏ ے െͲǤͷܹ ݊ܽݐ ˁ௦ ͳ ܨ ۏ ے ௭ ے (2)
Y. Samant Saurabh et al. / Procedia Engineering 144 (2016) 1138 – 11491143By solving equation (2), all the forces acting on push rod at lower A-arm end as well as at bell crank end wereobtained. It was found that the force -Fpb acting on the bell crank by pushrod isn’t coplanar with the bell crank. So tobalance the torque about the hinged point of bell crank, the component of -Fpb, lying in the plane of the bell crankwas calculated.(3) ܨ ൌ ܨ െ ݊ ൈ ܨ Where, n is normal vector of the plane of the bell crank.Ksrpb u F(4)rsb u 'xThe final stiffness of the spring came out to be 40kN/m with spring compression 10mm. Similarly for rearsuspension stiffness came out to be 60kN/m. In order to check the sustainability of the suspension linkages, theforces mentioned in [14] i.e. Fy 3Mug, Fx Fz Mug were considered. Then the forces and moments on linkageswere calculated using the procedure followed in the static analysis. These forces were considered while doing the FEanalysis of the components in ANSYS . A minimum factor of safety of 1.5 was taken to ensure the rigidity andstrength of the suspension system while maintaining less weight.5. Ride (Vibration) analysisThe ride analysis was carried out in order to calculate damping coefficient of the damper. Quarter car model ofthe suspension system was considered for this analysis (Fig 7). The damping coefficient of wheel was neglected as itis very small compared to the damping coefficient of the spring damper. The final equations of quarter car model aregiven below.Z s ( s)Kt (Cs K )[15, 16, 17, 18](5)Z r (s) (M s s 2 Cs K )(M u s 2 Cs K Kt ) (Cs K )2 @Z u ( s)Z r ( s)Kt ( M s s 2 Cs K )[15, 16, 17, 18]( M s s Cs K )(M u s 2 Cs K Kt ) (Cs K ) 2 @2Z s ( s) Z u ( s)Z r ( s) Kt M s s 2[15, 16, 17, 18](M s s 2 Cs K )(M u s 2 Cs K Kt ) (Cs K ) 2 Z u ( s) Z r ( s)Z r ( s) ( M s s 2 Cs K )(M u s 2 Cs K ) (Cs K ) 2 [15, 16, 17, 18](M s s 2 Cs K )(M u s 2 Cs K Kt ) (Cs K ) 2 @ @@(6)(7)(8)Equation (5), (6), (7) and (8) indicates the sprung mass transmissibility, un-sprung mass transmissibility, sprungmass deflection, and tyre deflection respectively. To optimize the suspension system, plots of time response ofequations (5), (7), (8) and frequency response of equations (5), (6) are plotted as shown in Fig 9 and Fig 10. Fromthe time response, the range of damping ratio is selected in order to have damped state with the required time. Incase of race cars, the damping should be fast enough to damp the oscillations in 0.2 to 0.5 seconds, hence a range ofdamping ratio [0.4 0.8] is selected (Fig 9). The frequency response of equations (3) and (4) are plotted across thisselected range of damping ratio. Since, the rider comfort decreases with the increase in acceleration of the body, theamplitude of acceleration of the sprung mass was to be minimize. The peak amplitude of the wheel displacement atboth the fundamental frequencies of un-sprung mass to be minimize in order to make sure that the wheel does notlose contact with the ground. As damping ratio of the damper increases, acceleration of sprung mass decreases; butat the same time un-sprung mass transmissibility also increases which may lose tyre contact with ground. Hence weneed to select optimum damping ratio. Literature [17] states that, the damping ratio is optimum when the plot (Fig10) across to resonance frequencies becomes almost linear so as to have less jerk at resonating frequencies. Asshown in Fig 10, for damping ratio 0.7 the graph between the two natural frequencies becomes almost straight line.Hence the damping ratio becomes q 0.7. Coefficient of damping is obtained which is, C 0.7Co, where Co is the
1144Y. Samant Saurabh et al. / Procedia Engineering 144 (2016) 1138 – 1149critical damping coefficient. Literature [20] states that a damping ratio of q 0.7 has been used in the calculationsbased on discussions with industry professionals. This verifies our result.Figure 7. Quarter-car modelFigure 8. Time response of equations (5, 7, 8)
Y. Samant Saurabh et al. / Procedia Engineering 144 (2016) 1138 – 11491145Figure 9. Frequency response of equations (5, 6)6. Roll steer analysisThe roll steer analysis was carried out in order to validate the suspension designed through above procedure.When a car takes a turn, due to centripetal force acting on the centre of mass of the car there are unequal normalreactions acting on both the wheels. Due to this entire body rolls about roll centre of the car. This affects the drivercomfort. In this analysis, we had considered velocity of car to be 80km/hr and radius of the turn 7m. Our expectedcriteria is that the roll angle should be below 10o.Suppose, a car takes turn to left and body rolls at an angle Ѳ at the roll centre. Moment is balanced about rollcentre and equation (5) generates:M s v 2 [17]d2d2(9)(C f C r )T ( K f K r )TI rrT 22Rwhere, Irr, v, R, d are moment of inertia of body about roll centre, velocity of vehicle, radius of curvature anddistance between roll centre and CoG position of body respectively.(10)M sv2T22ªºdd(C f C r ) s ( K f K r )»R « I rr s 2 22 ¼The step response of the Equation 10 is plotted in Fig 10. The graph shows that, at steady state the entire bodywill roll by 8 degree while having a turn. Which shows that the designed suspension performed adequately at theturn.
1146Y. Samant Saurabh et al. / Procedia Engineering 144 (2016) 1138 – 1149Figure 10. Time response of roll angle7. Design of springFrom the static analysis, stiffness of spring (K) was calculated to be 40kN/m.Pm 1/2(Pmax Pmin), Pa 1/2(Pmax-Pmin) where Pmax and Pmin are the maximum and minimum forces actingon spring during wheel travel. Here 25.4mm of jounce and 25.4mm of re-bound was considered. The materialgenerally used for spring damper is hardened steel.§ 8P D ·§ 8P D ·W m ks m 3 , W a k a 3 , C D/dSd ¹ Sd ¹ks 1 0.5/C, k4C 1 0.615 4C 4CWhere ks, k are the design constants. C is spring index. D and d were inner and outer diameters of the springrespectively. By using machine design methodologies factor of safety of the spring is calculated.G and Sut are the modulus of rigidity and ultimate tensile strength of material respectively. ᇱ 0.22Sut, Ssy 0.45Sut [21].WaS syfs W mS se '2S sy S se '(11)Where fs is the factor of safety of the spring. Factor of safety of the spring should be 2 fs 3. Generally innerdiameter of spring is taken to be 8mm. Hence fs is calculated in terms of C. For fs 3, C comes out to be 6.5 andhence D 52mm.NGd 48D 3 K f(12)Here N is number of coils in spring which comes out to be 8.8. ResultsFig. 11 shows the plots of camber, toe and caster respectively obtained through kinematic analysis done insection 2 and 3.
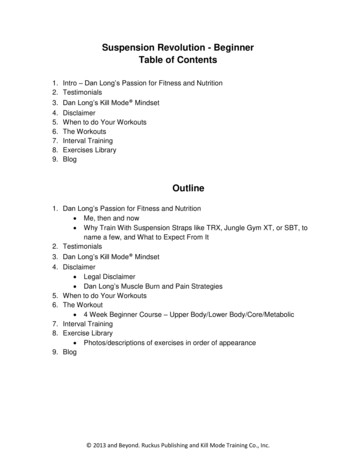
Y. Samant Saurabh et al. / Procedia Engineering 144 (2016) 1138 – 11491147Figure 11. Variation in wheel alignment with wheel travelStatic analysis yields the required stiffness of spring along with sustainability of components from FE analysis.FE analysis was done by considering Al 6061 material for Bell Crank and Knuckle and Stainless Steel for A-Armsand Push Rod. Table 1 was the result of static analysis. Forces on each member is expressed as components alongthe axes. Those forces were applied on corresponding member.Table 1. (a) Static analysis of suspension (b) Dynamic analysis suspension (mentioned in [14])Push Rod (FoS: 2.3)Hub (FoS: 1.8)
1148Y. Samant Saurabh et al. / Procedia Engineering 144 (2016) 1138 – 1149Knuckle (FoS: 2.4)Lower A-Arm (FoS: 2.4)Bell Crank (FoS: 2.4)Upper A-Arm (FoS: 2.4)Figure 12. FEA using ANSYS Workbench Spring stiffness for the suspension was calculated to be 40000N/m with a damping ratio 0.7.In entire analysis, our goal was to provide detail structure of the design of suspension. From kinematic analysiswe found the kinematic parameters such as caster, camber, toe angles etc. Dynamic analysis of the kinematiclinkages gave us stiffness of the spring for a particular ground clearance (static condition). Robustness, sustainabilityof the components were insured from their corresponding FE analysis. Vibration or ride analysis of the designshowed us the effect of damping ratio on comfort and wheel deflection and in turn gave us the optimum value ofcoefficient of damping. After knowing the spring damper parameters we tested our design to check body roll for aparticular speed and radius of curvature. Finally using design of spring data we found the required parameters forspring design.
Y. Samant Saurabh et al. / Procedia Engineering 144 (2016) 1138 – 1149APPENDIX A. Symbols UsedW Weight of the vehicleZs Sprung mass displacementWt Weight of wheel assemblyZu Un-sprung mass displacementWua Weight of upper A armZr Road profileWla Weight of lower A armKs Stiffness of springWp Weight of pushrodCs Damping coefficient of damperMu Un-sprung massLp Length of pushrodFui Forces in ith direction on upper A armFpb Force on push rod from bell crankFli Forces in ith direction on lower A-ArmKf, Kr Stiffness of spring of front andrear suspension.Cf, Cr Coefficient of damping of frontand rear suspension.q Damping E 9-13 JULY 2014, formula student, Institute of Mechanical n-denmark/, SDU Vikings, University of Southern racing/video-gallery/the-car, 2013, Michigan Racing Formula SAE, rick-3/, April 2014, University of Limerick Racing, University of Limerick.Bos P.C.M., “Design of a Formula Student Race Car Spring-Damper System”, 0576519 CST2010.024.Gaffney III E. F., Salinas A. R., “Introduction to Formula SAE Suspension and spring design”, University of Missouri–Rolla, 971584.Salzano A., Klang E., “Design Analysis and fabrication of Formula SAE chassis”, 2009, Wolfpack motorsports, College of EngineeringNorth Carolina state university.[9] ml, North Dakota State University BISON motorsports.[10] http://web2.uwindsor.ca/fsae/car.html, 2010, Lancer Motor sports, University of Windsor.[11] “Redesign of an FSAE Race Car’s Steering and Suspension System”, October 2011, University of Southern Queensland.[12] Nazar R. J., “Vehicle Dynamics Theory and Application”, Springer, Library of Congress Control Number: 2007942198[13] January D. B., “Steering Geometry and Caster Measurement”, SAE technical paper series 850219.[14] Fenton J. (1980), Vehicle Body Layout and Analysis, Mechanical Engineering Publications Ltd. London[15] Rajmani R., “Vehicle Dynamics and Control”, Springer, SPIN 11012085.[16] Gillespie T.D., “Fundamentals of Vehicle Dynamics”, Society of Automotive Engineers.[17] http://nptel.ac.in/courses/107106080/[18] Mehmood A., Khan A. A., and Khan A. A., “Vibration Analysis Of Damping Suspension Using Car Models”, Sep. 2014, InternationalJournal of Innovation and Scientific Research, Vol. 9 No. 2, pp. 202-211.[19] Julian H. S., “An Introduction to Modern Vehicle Design”, 2001. Reed educational and professional publishing Ltd.[20] Atherden M. J., Daniel W. J. T., “Formula SAE Shock Absorber Design”, 2004, The University of Queensland.[21] Bhandari. V. B., “Design of Machine Elements”, 2010, TATA Mcgraw Hills.1149
maximum length of spring (IG) was fixed and the maximum compression of the spring was decided to be 25.4mm. Thus the final problem was the maximum and minimum angles of line HG for 25.4mm movement of the spring. The maximum and minimum angles of line AE was