Transcription
LIVE INTERACTIVE LEARNING @ YOUR DESKTOPPreparing for NGSS: Using Mathematicsand Computational ThinkingPresented by: Robert Mayes and Bryan ShaderNovember 6, 20126:30 p.m. – 8:00 p.m. Eastern time9
Developing the Standards11
Developing the elopmentJuly 20112011-201312
NGSS Development ProcessIn addition to a number of reviews by state teamsand critical stakeholders, the process includes twopublic reviews. 1st Public Draft was in May 2012 2nd Public Draft will take place in the Fall of 2012Final Release is expected in the Spring of 2013IT’S NOT OUT YET!13
A Framework for K-12 Science Education 14Released in July 2011Developed by the National Research Council at theNational Academies of SciencePrepared by a committee of Scientists (including NobelLaureates) and Science EducatorsThree-Dimensions: Scientific and Engineering Practices Crosscutting Concepts Disciplinary Core IdeasFree PDF available from The National Academies Press (www.nap.edu)Print Copies available from NSTA Press (www.nsta.org/store)
Scientific and Engineering Practices1. Asking questions (for science)and defining problems (for engineering)2. Developing and using models3. Planning and carrying out investigations4. Analyzing and interpreting data5. Using mathematics and computational thinking6. Constructing explanations (for science)and designing solutions (for engineering)7. Engaging in argument from evidence8. Obtaining, evaluating, and communicating information15
Crosscutting Concepts1. Patterns2. Cause and effect: Mechanism and explanation3. Scale, proportion, and quantity4. Systems and system models5. Energy and matter: Flows, cycles, and conservation6. Structure and function7. Stability and change16
Disciplinary Core IdeasLife SciencePhysical ScienceLS1: From Molecules to Organisms:Structures and ProcessesPS1: Matter and Its InteractionsLS2: Ecosystems: Interactions, Energy, andDynamicsLS3: Heredity: Inheritance and Variation ofTraitsPS2: Motion and Stability: Forces andInteractionsPS3: EnergyPS4: Waves and Their Applications inTechnologies for Information TransferLS4: Biological Evolution: Unity and DiversityEarth & Space ScienceEngineering & TechnologyESS1: Earth’s Place in the UniverseETS1: Engineering DesignESS2: Earth’s SystemsETS2: Links Among Engineering,Technology, Science, and SocietyESS3: Earth and Human Activity17
Closer Look at a Performance ExpectationConstruct and use models to explain that atoms combine to form new substances of varying complexity in terms ofthe number of atoms and repeating subunits. [Clarification Statement: Examples of atoms combining can include Hydrogen(H2) and Oxygen (O2) combining to form hydrogen peroxide (H2O2) or water(H2O). [Assessment Boundary: Restricted tomacroscopic interactions.]Performance expectations combine practices, core ideas,and crosscutting concepts into a single statement.18
Closer Look at a Performance ExpectationConstruct and use models to explain that atoms combine to form new substances of varying complexity in terms ofthe number of atoms and repeating subunits. [Clarification Statement: Examples of atoms combining can include Hydrogen(H2) and Oxygen (O2) combining to form hydrogen peroxide (H2O2) or water(H2O). [Assessment Boundary: Restricted tomacroscopic interactions.]Performance expectations combine practices, core ideas,and crosscutting concepts into a single statement.19
Preparing for the NextGeneration ScienceStandardsUsing Mathematicsand Computational ThinkingRobert Mayes – Georgia Southern UniversityBryan Shader – University of Wyoming20
NGSS (Framework)& CCSS‐M A Framework for K–12 Science Education (NRC 2012) fortoday’s students to become the scientifically literate citizens oftomorrow their educational experiences must help thembecome mathematically proficient “The focus here is on important practices, such as modeling,developing explanations, and engaging in critique andevaluation” (NRC 2012, p. 3–2). 8 essential practices include “using mathematics, informationand computer technology, and computational thinking” Quantitative Reasoning is essential component21
PollWhich of the following is most prevalent in yourscience classroom?A. Students apply basic arithmetic to calculate and measureB. Students interpret graphs and science models to answerscience questionsC. Students create their own scientific models incorporatingmathematicsD. Students use computer simulations and models and engage indata intensive scienceE. None of the above22
Alignment Between Mathematical Practicesand Scientific/Engineering PracticesMathematical Practices (MP)Science and Engineering Practices (SEP)1. Making sense of problems and 1. Asking questions and defining problemspersevering in solving them3. Planning and carrying out investigations2. Reason abstractly and2. Developing and using modelsquantitatively3. Planning and carrying out investigations5. Using mathematics and computational thinking3. Construct viable arguments5. Using mathematics and computational thinkingand critique the reasoning of6. Constructing explanations and designing solutionsothers7. Engaging in argument from evidence8. Obtaining, evaluating, and communicating information4. Model with mathematics2. Developing and using models3. Planning and carrying out investigations23
Alignment Between Mathematical Practicesand Scientific/Engineering PracticesMathematical Practices (MP)Science and Engineering Practices (SEP)5. Use appropriate tools strategically 2. Developing and using models3. Planning and carrying out investigations4. Analyzing and interpreting data6. Attend to precision3. Planning and carrying out investigations8. Obtaining, evaluating, and communicating information7. Look for and make use of4. Analyzing and interpreting datastructure6. Constructing explanations and designing solutions7. Engaging in argument from evidence248. Looking for and expressing5. Using mathematics and computational thinkingregularity in repeated reasoning6. Constructing explanations and designing solutions
Science & Math Models Science models as discussed in the Framework are morebroadly construed as diagrams, physical replicas, analogies,computer simulations, and, of course, mathematicalrepresentations. CCSS-M emphasizes abstract mathematical reasoning andquantitative reasoning with the goal of developing an abstractmathematical model such as an equation or function. Quantitative models can be tables of data, graphs ofrelationships, statistical displays such as pie graphs, andpictorial science models such as the carbon cycle model. Computational Science and Data Intensive Science are newparadigms we must consider.25
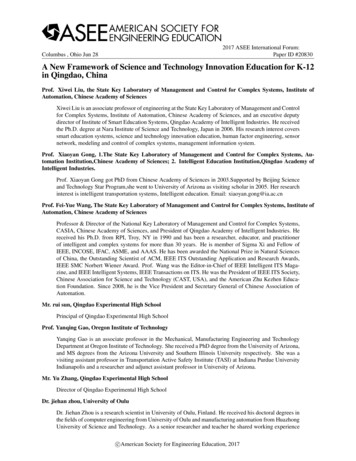
Science System Model(Box Model)Quantitative Interpretation:1. What are the variables in the carboncycle?2. Which are flow processes and whichare storage areas?3. What are the attributes of deforestationthat make it a viable variable in thismodel?4. What are the measures associated withthe variables?5. What is the balance of CO2 enteringand leaving the ocean?6. What other questions would you askyour students? Do they requirequantitative accounts?26
Expanding Toolbox Due to increasing computing capabilities, two new paradigmshave arisen Computational science (scientific computing)o Scientific computing focuses on simulations and modeling to provideboth qualitative and quantitative insights into complex systems andphenomena that would be too expensive, dangerous, or even impossibleto study by direct experimentation or theoretical methods (Turner et al.2011) Data-intensive science (data-centric science)o The explosion of data in the 21st century led to the invention of dataintensive science as a fourth paradigm, which focuses on compressedsensing (effective use of large data sets), curation (data storage issues),analysis and modeling (mining the data), and visualization (effectivehuman-computer interface).27
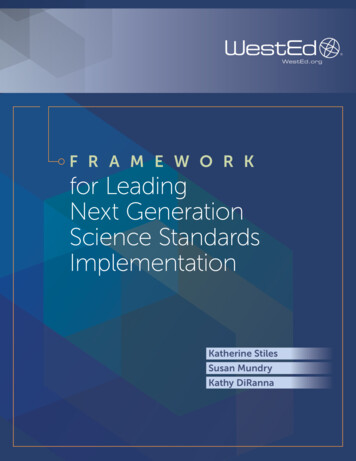
Science in a Box:Wind RosesQuestions:You wish to describe and study thewind patterns in your city:1.2.3.4.5.28What are the importantcharacteristics of wind?How could you measure thesecharacteristics?How might you be able toillustrate these characteristics in adiagram?How does a wind rose illustratecharacteristics of wind?What would a wind rose look likeyour city?
Questions or Comments?Reminders: To turn off notifications of other participants arriving go to:o Edit - Preferences - General - Visual notifications You can minimize OR detach and expand chat panel Continue the discussion in the Community Forumso http://learningcenter.nsta.org/discuss
Framework and CCSS‐MAlignment Example Core Science area: Earth and Space Science – Earth andHuman Activity Core Concept: global climate change Quantitative Concept: change Exemplars of science tasks accomplished at end of grades 2, 5,8, and 12 Exemplars from Computational Science30
Grade 2Framework for K–12 ScienceCommon Core State Standards-MathematicsBy the end of grade 2 studentsThe CCSS-M have 2nd graders solvingshould know: “Weather is theproblems involving addition and subtractioncombination of sunlight, wind,within 100, understanding place value up tosnow or rain, and temperature in a1,000, recognizing the need for standard units ofparticular region at a particularmeasure of length, representing and interpretingtime. People measure thesedata, and reasoning with basic shapes and theirconditions to describe and recordattributes.weather and to notice patterns overtime” (NRC 2012, p. 188).31
Grade 2 Tasks Observe television weather reports, thendraw/describe what makes up the weathero Enables students to construct definitions and list variables such as rain,sunshine, and wind Collect and measure rain to the nearest centimetero Draw pictures representing rain by montho Bar graph or a dot chart using M&M candies Use visual data displays to ask students:o Which month was the wettest? The driest?o What do you think happened to plants in the months with low rainfall?o What other weather conditions interact with the amount of rain to affect plantlife?32
Grade 2:Computational Thinking An appreciation for parallel vs. serial processingo What is parallel processing? See http://nwsc.ucar.edu/young-scientistso Parallel vs. Serial processeso NCAR-Wyoming Supercomputing Center: http://nwsc.ucar.edu/facility/visit33
Grade 2:Computational Thinking Basic understanding of algorithms:o Describe the steps taken to make a PBJ sandwicho How can one person sort a collection of items by their weight?o How can a group of people sort a collection of items by their weight?34
Grade 5Framework for K–12Common Core State Standards-MathematicsScienceBy the end of 5th gradeThe CCSS-M has fifth graders writing and interpretingthe expectation for global numerical expressions, analyzing patterns and relationships,climate change is: “Ifperforming operations with multi-digit whole numbers andEarth’s global meandecimals to hundredths, using equivalent fractions to addtemperature continues toand subtract fractions, multiplying and dividing fractions,rise, the lives of humansconverting measurement units within a given measurementand organisms will besystem, measuring volume, representing and interpretingaffected in many different data, graphing points on the coordinate plane to solve realways” (NRC 2012, p. 98). world problems, and classifying two-dimensional figuresinto categories based on their properties.35
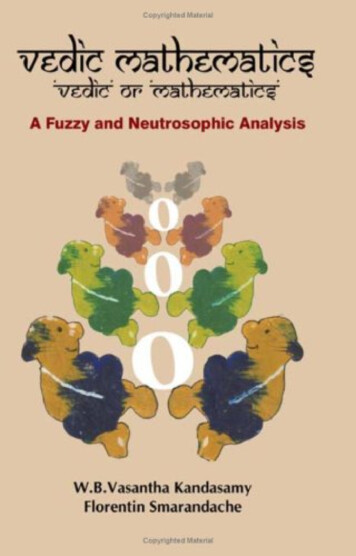
Grade 5 Tasks Consider data on state, national,and international annualtemperature changes Examine Climate Central’snational map on temperaturechangeo What percentage of states has warmedmore than 0.2 degrees each decade overthe past 40 years?o How much has the state you lived inwarmed?36
Grade 5 Tasks Examine state datao What does the general trend of thescatter plot of points indicate? Measure the temperature eachday for a week to the nearest 0.1degreeo What can you say about natural flux indaily temperatures and how it relates tothe annual average temperature?o If the temperature continues to increaseat the current rate, what will the averagetemperature be in 20 years?o What potential impact does thiswarming trend have in your state?37
Grade 5:Computational Thinking How does a computer represent numbers?o Base two arithmetic What good are those bar codes on products?o Error detection Average behavior, patterns inrandomnessExemplars NetLogo Mousetraphttp://ccl.northwestern.edu/netlogo Weather vs. ther-and-climate38
Grade 5:Computational Thinking How does a computer represent numbers?o Base two arithmetic What good are those bar codes on products?o Error detection Average behavior, patterns inrandomnessExemplars NetLogo Mousetraphttp://ccl.northwestern.edu/netlogo Weather vs. ther-and-climate39
Grade 8Framework for K–12 ScienceCommon Core State Standards-MathematicsThe end of 8th grade expectation The CCSS-M 8th grade standards include awarenessfor climate change is toof numbers beyond the rational numbers, work withunderstand that human activities, radicals and integer exponents, proportionalsuch as carbon dioxide releaserelationships, ability to analyze and solve linearfrom burning fuels, are majorequations and systems of linear equations, use linearfactors in global warming.functions to model relationships between quantities,Reducing the level of climateunderstand congruence and similarity, thechange requires an understanding Pythagorean Theorem, solve real-world problemsof climate science, engineeringinvolving volume of cylinders, cones, and spheres,capabilities, and human behavior and use statistics to investigate patterns of(NRC 2012, p. 198).40association in bivariate data.
Grade 8 Tasks Extend discussion of state data Using average annual temperature data,construct a scatter ploto What is the trend of the data in this scatter plot?o Is it decreasing or increasing?o Estimate a line of best fit for the data thatrepresents the trend. Write out equation of the estimated lineof best fit and use linear model topredict future temperatureso What variables can we control to reduce orstabilize the temperature trend?41
Grade 8:Computational Thinking Strengths/weaknesses of models NetLogo fire modelo What affects the spread of a wild fire?o Does the simulation always give the same result for the giveninitial conditions?o What things stay the same for each simulation?o What things can’t be predicted? Idea of ensembleso Do small changes in conditions have small changes inoutcomes?o What things would you have to incorporate to make this amore natural model? NCAR fire fires.shtml
Grade 8:Computational Thinking Strengths/weaknesses of models NetLogo fire modelo What affects the spread of a wild fire?o Does the simulation always give the same result for the giveninitial conditions?o What things stay the same for each simulation?o What things can’t be predicted? Idea of ensembleso Do small changes in conditions have small changes inoutcomes?o What things would you have to incorporate to make this amore natural model? NCAR fire fires.shtml
Grade 12Framework for K–12 ScienceCommon Core State StandardsMathematicsBy the end of high school students should The CCSS-M high school standards areunderstand that climate change is slowby conceptual categories not grade level.and difficult to recognize withoutThe conceptual categories of Number andstudying long-term trends, such asQuantity, Algebra, Functions, Modeling,studying past climate patterns. ComputerGeometry, and Statistics and Probabilitysimulations are providing a new lens forspecify the mathematics that all studentsresearching climate change, revealingshould study in order to be college andimportant discoveries about how thecareer ready. Functions are expanded toocean, the atmosphere, and the biosphere include quadratic, exponential, and44interact and are modified in response totrigonometric functions, broadening thehuman activity (NRC 2012, p. 198).potential models for science.
Grade 12 Tasks Revisit scatter plot of statetemperature data Create a power function model orexponential model for the datao Which function is the best model for thedata?o Exploring error and best-fit concepts45
Grade 12 Tasks Explore carbon dioxide as amitigating factor in global climatechange Quantitatively interpret data onhistoric trends in atmosphericcarbon dioxide Search for evidence to support claimthat Earth is experiencing a phase ina natural cycle of carbon dioxidechangeo How were the data collected?o Are the data reliable?o What are likely causes of the fluxes inatmospheric carbon dioxide?46
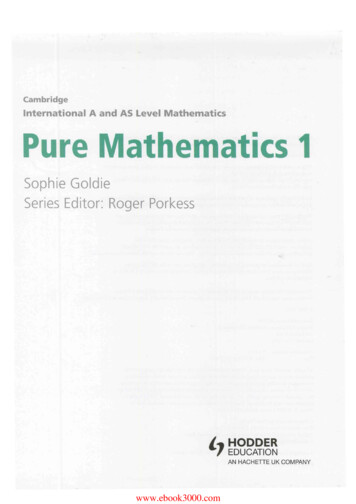
Grade 12:Computational ThinkingCalculus ideas: rates/areas1 What affect does an upwindturbine have on a downwindturbine?2. What do these graphs tell us?3. How might you estimate thetotal amount of energygenerated by each turbine.Credits: Jay Sitaraman, University of Wyoming47Basic programmingskills
Questions or Comments?Reminders: To turn off notifications of other participants arriving go to:o Edit - Preferences - General - Visual notifications You can minimize OR detach and expand chat panel Continue the discussion in the Community Forumso http://learningcenter.nsta.org/discuss
PollWhich of the following scientific methods doyour students get the most experience with inthe uiryComputational/modelingData analysis/statisticsA &B
What Is ScientificComputing? It is not Computer Science “Scientific computing focuses on simulations and modelingto provide both qualitative and quantitative insights intocomplex systems and phenomena that would be too expensive,dangerous, or even impossible to study by directexperimentation or theoretical methods.”–Society of Industrial & Applied Mathematics50
What Is ScientificComputing? The goal of scientific computing is to improveunderstanding of a physical phenomena. It does not replace Experiment and Theory, rather itcomplements these methods. It is “both the microscope and telescope of modern science.It enables scientists to model molecules in exquisite detail tolearn the secrets of chemical reactions, to look into the futureto forecast the weather, and to look back to a distant time at ayoung universe.”–Lloyd Fosdick et. al, An introduction to Highperformance scientific computing, 1996.51
A Toy ProblemHeat diffusion on a plateNetLogo HeatDiffusion Model52
A Toy ProblemHeat diffusion on a plateNetLogo HeatDiffusion Model53
This is governed by the heat equation:54
How do we translate this into somethingcomputable (just using ,‐,*,/) ?We approximate by thinking of the plate as a grid of points55
Simple Computational ModelA particle’s temperature changes at a rateproportional to the difference between itstemperature and the average temperature of itsneighbors.56 For each time step and each particle in the grid have to do 4 additions and1 division. A plate modeled by a 100 by 100 grid would take 50,000 operations pertime-step. To run until stable temperature on wood would take about 100 steps; atotal of about 5 million operations!
Simple Computational Model201012105720Average temperature of P’s neighbors is 15,which is 3 more than P’s temperature.If constant of proportionality is 1/3, then P’supdated temperature will be13 12 (1/3)*3. For each time step and each particle in the grid have to do 4 additions and1 division. A plate modeled by a 100 by 100 grid would take 50,000 operations pertime-step. To run until stable temperature on wood would take about 100 steps; atotal of about 5 million operations!
This is just a toy problemTo have high level of accuracy with model, we might need a gridmuch finer than 100 by 100.Making grid 10 times finer in each direction requires multiplyingthe number of operations by 10*10 100.To get the same accuracy, we need the time-steps 100 timessmaller.Even with a toy problem, we’re up to58operations!
3D Heat DiffusionThe simple model becomes largeSame basic idea, but extra dimension is costly!A 1,000 by 1,000 by 1,000 grid cube takes7 trillion operationsto determine the temperatures of the particles after 1,000 time steps.59
How does this model helpunderstanding? Dynamic, visual Allows easy variation of parameters Forced to construct equations out of physicalobservations Better understanding of orders of magnitude60
Computational ThinkingCT is integrates the power of human thinking with the capabilitiesof computational processes and technologies.The essence of computational thinking is the generalization ofideas into algorithms to model and solve problems.CT is not about getting humans to think like computers. But to usehuman creativity and imagination to make computers useful andexciting.- Wing 2006.61
How should the new paradigm of ScientificComputing impact our teaching? 62Profoundly“Computational Thinking will be a fundamental 21st century skill (just likereading, writing and arithmetic)” –Jeanette Wing, Computational Thinking,2007SystemicallySC has symbiotic relationship with Math, Science and Engineering . CTrequires abstraction, the ability to work with multi-layered andinterconnected abstractions (e.g. graphs, colors, time). CT draws on “realworld” problems.VerticallyCT must be developed over many years, and starts at Pre-KWiselyIncorporate programming at appropriate times, tie with theory, emphasizequality vs. quantity in experiences
Data‐intensive science:The fourth paradigm for scientific explorationThe explosive use of personal data, new data collection technologies (such aslidar), the capabilities and speeds of modern personal and super computers hasresulted in a wealth of information and data. Simulations of complex modelsare generated on a 24/7/365 basis and involve multiple scales.What is it? Consists of four main activities at all scales:CaptureNew technologies allow capture of larger data sets, over wider time,spatial and physical scales. There is an ongoing need to make this moreeffective: compressed sensing.CurationWhere and how do we store the data to make it useable?Analysis and ModelingHow do we mine the data? How can we make inferenceswithout seeing all the data? Can we make models that explain the data?VisualizationHow does one grock large data sets? How can we make thehuman-computer interface more effective?63
How does data‐intensive scienceinform our teaching? Need to provide basic information literacy skills so that students can beproductive members of the 21st century workforce, and adapt to aincreasingly data-dominant world.ooooHow is data-mining done?How are inferences drawn from large data-sets?What are the pros/cons of models?How can one digest data? Need to make learning authentic. Wealth of resources to connect contentareas to “real world’’ problems. More depth, less breadth. Project based? Will need to change the way we “see” and sense data. 3D, color graphics,different scales. Thus, there is a need to give students experience withmultiple interpretations. Need to provide interdisciplinary understandings (integrated curricula)64
How does data‐intensive scienceinform our teaching? Must help develop new intellectual tools and learning strategies in ourstudents: e.g. the importance of different scales, the understanding ofcomplex systems, how does one frame and ask meaningful questions? New experiences neededCollecting and interpreting data from sensorsMining dataMassive collaborationInterdisciplinary synthesisFrom science to policy inferencesUse of scientific computing, data gather toolsVisualization Statistics, statistics, statistics. But make it data-driven, and have the focus beon understanding.65
PollWhich of the following presents the biggestmathematical barrier for your students?A. Ability to identify variables in science context, understand theattributes of the variables that make it important to the context, andwork with appropriate measuresB. Ability to measure, reason proportionally, calculate, and understandlarge/small numbersC. Ability to interpret a scientific table, graph, equation, or systemmodel to answer a real-world questionD. Ability to create a model from data, then test and refine the modelE. All of the above66
Quantitative Reasoning NSF Culturally Relevant Ecology, Learning Progressions, andEnvironmental Literacy project has the goal of refining andextending current frameworks and assessments for learningprogressions leading to environmental science literacy andassociated mathematics that focus on carbon cycling, water systems,and biodiversity in socio-ecological systems. Our focus was QR. 67Quantitative Reasoning in Context (QRC) is mathematics andstatistics applied in real-life, authentic situations that impact anindividual’s life as a constructive, concerned, and reflective citizen.QRC problems are context dependent, interdisciplinary, open-endedtasks that require critical thinking and the capacity to communicate acourse of action.This project is supported in part by a grant from the National Science Foundation: Culturally RelevantEcology, Learning Progressions, and Environmental Literacy (DUE‐0832173) which we refer to asPathways.
QR FrameworkWe propose a quantitative reasoning framework that has four key components: 68Quantification Act (QA): mathematical process of conceptualizing anobject and an attribute of it so that the attribute has a unit measure, and theattribute’s measure entails a proportional relationship (linear, bi-linear, ormulti-linear) with its unitQuantitative Literacy (QL): use of fundamental mathematical concepts insophisticated ways for the purpose of describing, comparing, manipulating,and drawing conclusions from variables developed in the quantification actQuantitative Interpretation (QI): ability to use models to discover trendsand make predictions, which is central to a person being a citizen scientistwho can make informed decisions about issues impacting theircommunitiesQuantitative Modeling (QM): ability to create representations to explaina phenomena and revise them based on fit to reality
QR Cycle69
QR FrameworkQuantification Act70Variable orce-dynamicScientific discourseQuantitative discourseContextAvoids QRComputation DrivenSituative tative tationsNumber SenseTablesSmall/large NumbersGraphs/diagramsScientific werAccuracyExponentialPrecisionStatistical displaysEstimationTranslationUnitsScience diagramsProportional ReasoningComplex systemsFractionRatioStatistics & ProbabilityPercentRandomnessRates/ChangeEvaluating RisksProportionsNormal DistributionDimensionalStatistical PlotsAnalysisCorrelationCausalityBasic Prob/StatsZ-scoresEmpirical Prob.Confidence IntervalsCountingCentral tendencyLogarithmic ScalesQuantitative ModelingLogicProblem SolvingProblem FormulationModelingNormal DistributionRegression gistic Growth ModelMultivariate ModelSimulation ModelScientific DiagramTable & Graph ModelsInferenceInferenceHypothesis TestingPractical Significance
QR LP Assessment ExemplarsQR Water Cycle Macro ScaleThe pie chart below describes where water goes on a school grounds when itrains. If 15 centimeters of rain falls on the school yard in one day, how couldyou determine how much would runoff?a. What are reasonable dimensions for a school yard?b. Say reasonable dimensions are 300 meters x 200meters. How can you determine how much rain fallson your school yard?c. Can you express the amount of rain in m3?d. So how much water runs off the schoolyard? Canyou provide a common sense estimate of how muchwater this is?e. . Say then that 135,000m3 of water is runoff fromthe playground from the 15cm rain. Where does thisrunoff go?71
QR LP Assessment ExemplarsQR Biodiversity Communities Micro ScaleWhat happens to biomass and energy in a community? As you move up thefood web are there more or less organisms?a. Below are pyramids of energy and biomass for a system. What do the pyramids tellyou about biomass and energy in the community?b. What percent of energy and biomass is lost at each step in the pyramid?c. What happens to the biomass that a consumer does not eat, such as beaks or bones?d. Bacteria are living single-celled organisms shaped like spheres, rods, or spiral twists.A bacteria is about 10-6 of a meter in length. Just how small is that? How manywould fit end-to-end in an inch?72
QR LP Assessment ExemplarsQR Carbon Cycle Landscape ScaleThe following is a box model of global carbon dioxide movement between2000 and 2005. The numbers represent billions of tons (gigatons) of carbondioxide per year. Explain what you see in the diagram.a. What do the boxes (pictures) and arrowsmean to you? What does the arrow labeled 8represent?b. Can you explain what the box with plants,animals, and soils has to do with carbonmovement?c. What is the net flux (change) in CO2 withrespect to the atmosphere? Is it increasing ordecreasing? By how much?d. Is it a concern that CO2 is increasing in theatmosphere (Science Qualitative)? Why?What would we have to do to balance theexchange of carbon dioxide with theatmosphere?73
Thank YouRobert MayesGeorgia Southern Universityrmayes@georgiasouthern.eduBryan ShaderUniversity of Wyomingbshader@uwyo.edu74
Questions or Comments?Reminders: To turn off notifications of other participants arriving go to:o Edit - Preferences - General - Visual notifications You can minimize OR detach and expand chat panel Continu
computer simulations, and, of course, mathematical representations. CCSS-M emphasizes abstract mathematical reasoning and quantitative reasoning with the goal of developing an abstract mathematical model such as an equation or function. Quan