Transcription
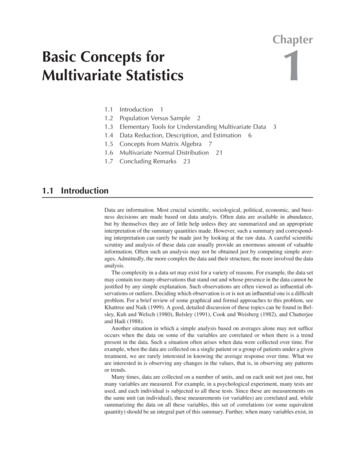
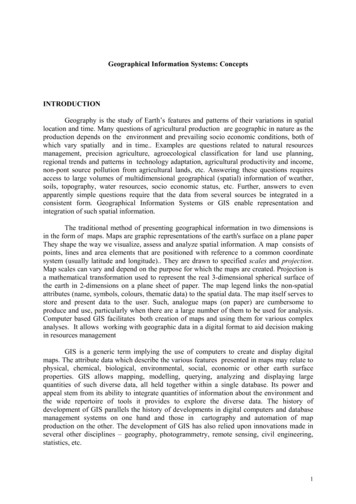
Geographical Information Systems: ConceptsINTRODUCTIONGeography is the study of Earth’s features and patterns of their variations in spatiallocation and time. Many questions of agricultural production are geographic in nature as theproduction depends on the environment and prevailing socio economic conditions, both ofwhich vary spatially and in time. Examples are questions related to natural resourcesmanagement, precision agriculture, agroecological classification for land use planning,regional trends and patterns in technology adaptation, agricultural productivity and income,non-pont source pollution from agricultural lands, etc. Answering these questions requiresaccess to large volumes of multidimensional geographical (spatial) information of weather,soils, topography, water resources, socio economic status, etc. Further, answers to evenapparently simple questions require that the data from several sources be integrated in aconsistent form. Geographical Information Systems or GIS enable representation andintegration of such spatial information.The traditional method of presenting geographical information in two dimensions isin the form of maps. Maps are graphic representations of the earth's surface on a plane paperThey shape the way we visualize, assess and analyze spatial information. A map consists ofpoints, lines and area elements that are positioned with reference to a common coordinatesystem (usually latitude and longitude). They are drawn to specified scales and projection.Map scales can vary and depend on the purpose for which the maps are created. Projection isa mathematical transformation used to represent the real 3-dimensional spherical surface ofthe earth in 2-dimensions on a plane sheet of paper. The map legend links the non-spatialattributes (name, symbols, colours, thematic data) to the spatial data. The map itself serves tostore and present data to the user. Such, analogue maps (on paper) are cumbersome toproduce and use, particularly when there are a large number of them to be used for analysis.Computer based GIS facilitates both creation of maps and using them for various complexanalyses. It allows working with geographic data in a digital format to aid decision makingin resources managementGIS is a generic term implying the use of computers to create and display digitalmaps. The attribute data which describe the various features presented in maps may relate tophysical, chemical, biological, environmental, social, economic or other earth surfaceproperties. GIS allows mapping, modelling, querying, analyzing and displaying largequantities of such diverse data, all held together within a single database. Its power andappeal stem from its ability to integrate quantities of information about the environment andthe wide repertoire of tools it provides to explore the diverse data. The history ofdevelopment of GIS parallels the history of developments in digital computers and databasemanagement systems on one hand and those in cartography and automation of mapproduction on the other. The development of GIS has also relied upon innovations made inseveral other disciplines – geography, photogrammetry, remote sensing, civil engineering,statistics, etc.1
A GIS produces maps and reads maps. Its major advantage is that it permitsidentifying spatial relationships between specific different map features. It can create maps indifferent scales, projections and colours. But it is not just a map making tool. It is primarilyan analytical tool that provides new ways of looking at, linking and analyzing data byprojecting tabular data into maps and integrating data from different, diverse sources. This itdoes by allowing creation of a set of maps, each with a different theme (soils, rainfall,temperature, relief, water sources, etc.).From its early beginnings, GIS has been an integrating technology both from the pointof view of its development as well as its use. This is because, once geographic informationof any kind is translated into the digital form in a GIS, it becomes easy to copy, edit, analyze,manipulate and transmit it. This allows vital linkages to be made between apparentlyunrelated activities based on a common geographic location. This has led to fundamentalchanges in the way resource management decisions are made in a variety of situations - forestmanagement, marketing management, utility management, transportation, as well as inagricultural, environmental and regional planning and management. Some potentialagricultural applications where GIS can lead to better management decisions are: precisionfarming, land use planning, watershed management, pest and disease management, irrigationmanagement, resources inventory and mapping, crop area assessment and yield forecasting,biodiversity assessment, genetic resources management, etc.DEFINITION OF GISA GIS is basically a computerized information system like any other database, but with animportant difference: all information in GIS must be linked to a geographic (spatial)reference (latitude/longitude, or other spatial coordinates).GIS G ISGeographic reference Information systemData of spatial coordinateson the surface of the earth(Map) – location dataDatabase of attribute datacorresponding to spatiallocation and procedures toprovide information fordecision makingGIS IS with geographically referenced data2
There are many different definitions of GIS, as different users stress different aspects of itsuse. For example:(i)ESRI defined GIS as an organized collection of computer hardware, software,geographic data and personnel designed to efficiently capture, store, update,manipulate, analyze and display geographically referenced information.(ii)ESRI also provided a simpler definition of GIS as a computer system capable ofholding and using data describing places on the earth’s surface).(iii)Duecker defined GIS as a special case of information systems where the databaseconsists of observations on spatially distributed features, activities or events,which are definable in space as points, lines or areas. A GIS manipulates dataabout these points, lines or areas to retrieve data for ad hoc queries and analyses.The United States Geological Survey (USGS) defined provided A GIS as a computerhardware and software system designed to collect, manage, analyze and displaygeographically (spatially) referenced data. This definition is a fairly comprehensive and issuitable for agricultural applications of GISNote that a GIS does not store a map or image. What it stores is a relationaldatabase from which maps can be created as and when needed. Relational databaseconcepts are particularly crucial to the development of GIS. Each map (say a soil map)can be considered to hold a layer or a level of information. A GIS works with severallayers of such thematic data. It can answer questions by comparing the different layersand also by overlaying them if all the layers are referenced to the same locations, that islocation is the common key for all the thematic data sets. This ensures that every location(spatial reference point) is exactly matched to its location on other maps. Once this isdone, the different layers can be compared and analyzed singly and in combination toidentify spatial patterns and processes. Thus, GIS are related to other databaseapplications, but with an important difference; all information in a GIS must be linked to aspatial reference. Other data bases may contain locational information (addresses, pincodes etc), but the GIS uses georeferences as the primary means of storing and accessinginformation.3
WHAT A GIS CAN DOThere are five basic questions which a complete GIS must answer. These are:What exists at a particular location? Given a geographic reference (eg lat,long) for alocation, the GIS must describe the features of that locationWhere can specific features be found? This is the converse of the first question. For example,where are the districts with rainfall greater than 500 mm and less than less than 750 mm?Trends or What has changed over time? This involves answering both questions above. Forexample, at what locations are the crop yields showing declining trends?What spatial patterns exist? if occurrence of a pest is associated with a hypothesized set ofconditions of temperature, precipitation, humidity, where do those conditions exist?Modelling or What if ? This is a higher level application of GIS and answers questions likewhat would be the nitrate distribution in groundwater over the area if fertilizer use isdoubled?The abilities to separate great quantities of information about the environment intolayers, explore each layer with a powerful suite of analytical tools, and then combine thelayered information to use it in an integrated fashion is what makes the GIS a powerfuland effective decision-support tool for agricultural and environmental management.4
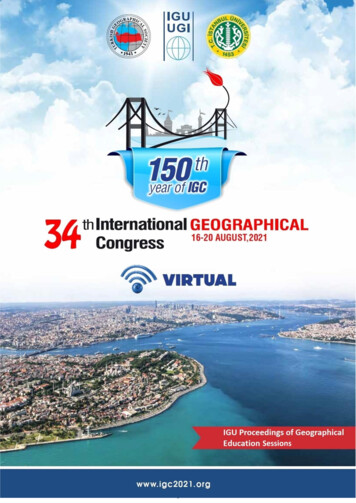
GEOGRAPHIC REFERENCING CONCEPTSA GIS is to be created from available maps of different thematic layers (soils, landuse, temperature, etc). The maps are in two-dimensions whereas the earth’s surface is a 3dimensional ellipsoid. Every map has a projection and scale.To understand how maps are created by projecting the 3-d earth’s surface into a 2-dplane of an analogue map, we need to understand the georeferencing concepts. Georefencinginvolves 2 stages: specifying the 3-dimensional coordinate system that is used for locatingpoints on the earth’s surface that is, the Geographic Coordinate System (GCS) and theProjected Coordinate System that is used for projecting into two dimensions for creatinganalogue maps.Geographic Coordinate SystemThe traditional way of representing locations on the surface of the earth is in the 3dimensional coordinate system is by its latitude and longitude.Source: ESRINote that the distance between two points on the 3-d earth’s surface varies with latitude. The3-d system therefore does not provide a consistent measure of distances and areas at alllatitudes.The true surface of the Earth is not the smooth ellipsoid shown in the figure but is quietuneven and rugged. The GCS which is the surface used for specifying the latitude and5
longitude of a point on the earth’s surface is also an approximation and a 3-d model of theearth. Several standard models of the ellipsoid are available to define the GCS (WGS 84,Everest ellipsoid) etc. The different models vary in their critical parameters ( semi major orequatorial axis and semi minor or polar axis of the ellipsoid and the point of origin). Theellipsoid model that is used to calculate latitude and longitude is called the datum. Changingthe datum, therefore, changes the values of the latitude and longitude.Specifying the Geographic Coordinate System therefore requires specifying the Datum.The datum is a fixed 3-d ellipsoid that is approximately the size and shape of the surface ofthe earth, based on which the geographic coordinates (latitude and longitude) of a point onthe Earth’s surface are calculated. In fact describing a place by its lat/long is not completewithout specifying its datum. In India the Everest Ellipsoid is used as the Datum for theSurvey of India maps.The ideal solution to would be a spheroidal model of the Earth that has both the correctequatorial and polar radii, and is centered at the actual center of the Earth. One would thenhave a spheroid, that when used as a datum, would accurately map the entire Earth. Alllat/longs on all maps would agree. That spheroid, derived from satellite measurements of theEarth, is GRS80, and the WGS84. datum matches this spheroid.Projected Coordinate SystemThe development of GIS starts with an available map on paper (an analogue map). This maptherefore represents a projection of a 3-d GCS in 2-dimensional form.Geographiccoordinate systemProjected coordinatedsystemEquationsandparametersAdopted from ESRIProjection is a mathematical transformation used to project the real 3-dimensional sphericalsurface of the earth in 2-dimensions on a plane sheet of paper. The projection causesdistortions in one or more spatial properties (area, shape, distance, or direction).6
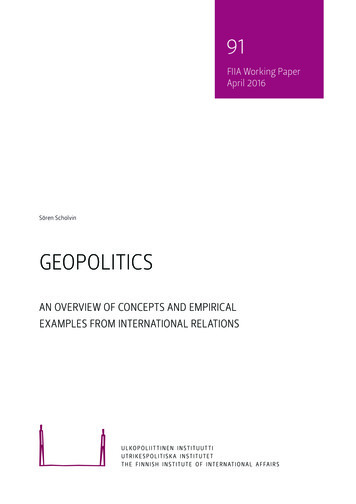
MAP PROJECTIONS LEAD TO DISTORTIONS .Choice of Projections depends on allowable distortions in:SHAPEAREADISTANCEDIRECTION(Angle)Adopted from ESRIThere are many methods of map projections, since there are an infinite number of ways toproject the 3-dimensional earth’s surface on to a 2-dimensional planar surface. The 3-d to 2d projections can be done to a plane or to the surface of a cone or cylinder leading toazimuthal, , conic or cylindrical projections respectively with many variations.Types of lanar/azimuthalprojectionAdopted from ESRIDepending on the scale and the agreeable tradeoffs with respect to distortions, a specificprojection form is chosen. Different countries have adopted different standard projections atdifferent map scales. In India, the polyconic projection is commonly used by Survey of India(SOI). All SOI toposheets are in the polyconic projection.7
Map ScaleMap Scale is the ratio of distances on map to distances to on the surface of the earth. It isspecified in verbal, numeric or graphical form on all standard maps.A graphical scale should be present on all maps that are used in GIS as it ensures that anychanges in scale in photocopying, etc. are accounted for.The standard map scales are:1:1000,0001: 250, 0001: 50,0001: 12,500Country level or State levelState or District levelDistrict levelMicro levelSurvey of India maps are available at all the above levels except the micro-level.8
CREATING A GISLike for any other Information System , creating a GIS involves 4 stages:(i)(ii)(iii)(iv)Data inputData StorageData Analysis and modelling, andData Output and presentationThe distinction from other Information Systems is that for a GIS the data inputs are of twotypes:(i)(ii)Spatial data (latitude/longitude for georeferencing,the features on a map, eg soilunits, administrative districts), andAttribute data (descriptive data about the features, eg soil properties, population ofdistricts, etc.)Components of Geographic dataAttributedataSpatial dataSPATIAL DATA SOURCESSource: (Murai and Murai, 1999))9
Spatial data sources for creating a GIS are analogue maps (soil map, land use map,administrative districts, map, agroecological zone map, etc.) or aerial photographs andsatellite imageries. Data input is the process of encoding analogue data in the form of maps,imageries or photographs into computer readable digitized form and writing data into the GISdatabase.GIS Data InputSpatial Data capture (representing locations in a database) can be in two basic formats:(i)(ii)Vector formatRaster formatIn the Vector format reality is represented as points lines and areas and in the raster formatreality is represented as grid of cells/pixels. The Vector format is based on dicrete objectsview of reality (analogue maps) and the raster format is based on continuous fields view ofreality (photographs, imageries, etc. In principle, any real world situation can be representedin digital form in both raster and vector formats. The choice is up to the user. Each format hasits advantages and disadvantages.Vector and Raster representations Vector formats– Discrete representations of realityX,YX,Y X,YX,Y Raster formats– square cells to model realityRowsReality(A highway)X,YColumnsSource: ESRI10
Vector data captureThis is generally used for capturing data fro analogue maps. It is based on thobservation that any map consists of 3 basic kinds of features –(i)(ii)(iii)point features,line features andpolygon or area features.Points do not have length, width or area. They are described completely by theircoordinates and are used to represent discrete locational information on the map to identifylocations of features such as, cities, towns, well locations, rain gauge stations, soil samplingpoints, etc.A line consists of a set of ordered points. It has length, but no width or area.Therefore it is used to represent features such as roads, streams or canals which have toonarrow a width to be displayed on the map at its specified scale.A polygon or area is formed when a set of ordered lines form closed figure whose boundaryis represented by the lines. Polygons are used to represent area features such as land parcels,lakes, districts, agroecological zones, etc. A polygon usually encloses an area that may beconsidered homogeneous with respect to some attribute. For example, in a soil map, eachpolygon will represent an area with a homogeneous soil type.A vector based system displays graphical data as points, lines or curves, or areaswith attributes. Cartesian coordinates (x, y) or geographical coordinates (latitude, longitude)define points in a vector system.Data is captured from a map in the form of known x-y coordinates or latitudelongitude by first discretizing the features on the map into a series of nodes (dots) anddigitizing the points one by one directly after placing the map on a digitizer. The digitizercan be considered to be an electronic graph paper with a very fine grid. The map is placed onthe digitizer and the lines and areas are discretized into a series of points. The digitizer’scursor is used to systematically trace over the points. The points on the map are captureddirectly as point coordinates. Line features are captured as a series of ordered points. Areafeatures are also captured as an ordered list of points. By making the beginning and endpoints/nodes of the digitization the same for the area, the shape or area is closed and defined.The process of digitizing from a digitizer is both time consuming and painstaking.Alternately, the map can be scanned and the scanned image digitized on-screen withappropriate software tools. The latter process is relatively simpler, more accurate and is oftenpreferred.Digitization is usually done feature by feature. For example, all point features are on amap (say cities, towns, etc.) are digitized in one layer. Similarly all line features (eg. Roads,rivers, drainage network, canal network, etc.) are digitized as a separate layer. So are thepolygon features (soils, districts, agroecological zones, etc.) For the points feature, thedigitization process builds up a database of the points’ identification number (ID) and theircoordinates. For the lines it builds up a database of their ID, the starting and end nodes for11
Spatial data Generation in Vector Format discretize lines into points (nodes) and digitize as straightline segments called vectors or arcs. data of X,Y coordinates of points and vectors and theirconnections (topology) are generated and stored in a database for areas, geometry (area, perimeter) data are generated points, lines and areas have independent database tables Add attribute data to databaseAdopted from FAO12
the line and its length. In addition the GIS also creates a database of the topology, that is, thespatial relationships between the lines. For the polygons also it develops the database of theirID, lines or arcs which comprise it, its toplogy and its area and perimeter.TOPOLOGYSource: http://www.colorado.edu/ geography/gcraft/notesThe identification number (ID) is the key field in each data base (points, lines, areasdatabases) as it can be used to relate the spatial data with the attribute data. The dataresolution depends on the discretization of the digitized points on the initial map. Vectorsystems are capable of very high resolution ( .001 in) and graphical output is similar to handdrawn maps. But it is less compatible with remote sensing data for which the raster system ispreferred.Map projections and Scale:Note that all standard maps which are to be digitized are drawnto specific projection and scale. But, the digitizer which facilitated the computerized maphas its own scale and units and the digitized maps are in these units and scale. Translatinginformation from the digitized map into the real world information of locations, lengths andareas requires information about the mathematical equations used for the projection as well asthe scale in which the original analogue map is prepared. In case several map layers are to bedigitized (topography, soils, districts, etc), it is necessary to ensure that they are allassembled in the same projection and scale before any spatial analysis is done using them.Most standard GIS have the facility to convert from one map projection to the other and totransform scales from the digitizer scale to map scale to ensure that all map layers have thesame locational reference.13
Raster data captureA raster based GIS locates and stores map data by using a matrix of grid cells orpixels. Each cell or pixel is represented either at its corner or centroid by a unique referencecoordinate (cell address). Each cell also has discrete attribute data assigned to it.Spatial data Generation in Raster Format map is represented by rectangular or square cells each cell is assigned a value based on what it represents attribute data are assigned by user to cellsAdopted from: FAOThe raster data resolution is dependent on the pixel or grid cell size. Data can beconveniently captured from remote sensing imageries, areal photographs, and other suchimageries of the earth's surface in a raster data format. In this format, the various features areidentified by superposing the imageries over a fine rectangular grid of the earth's surfacewhich they represent. Raster data capture does not build topography, that is derive spatialrelationships between the identified features. But it facilitates simple scalar operations on thespatial data which a vector format does not permit. Raster data requires to be converted tovector format before topology can be built and spatial operations can be carried out. Theraster format also requires more storage space on the computer than the vector format.Most standard GIS software have the facility to transform maps from raster formatsand vice versa.14
Most GIS software permit Raster-Vector formatconversions:Vector to raster - easyRaster to vector - hardSource: FAOAttribute dataAttribute data are descriptive data of point, line and area features. For points, this maybe the name of the location, its elevation, etc. For lines attribute data could be the name of aroad, or canal and other descriptions associated with them. For polygons, the attribute datamay relate to name of a district and its population, area, area under specific crops in thedistrict, etc.Attribute data about points/lines/areas features can be entered into different databasefiles. The files can be linked to the default spatial database generated after digitizing bycreating an identification key in each data file which is also common to the spatial databasegenerated by the GIS after digitization.Maps representing several layers of spatial and thematic or attribute information (soilmap, rainfall map, agroecozone map, district map, States map, etc.) can be digitized in thisfashion independently.15
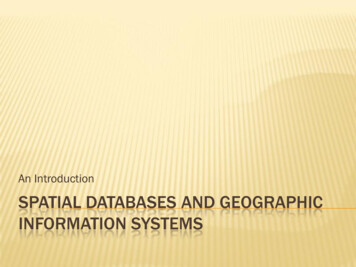
LINKING SPATIAL AND ATTRIBUTE DATATheme map of Rice KpAttribute table of DistOBJECTIDID1234567Dist name1 Adilabad2 Nizamabad3 Karimnagar4 Medak5 Hyderabad6 Rangareddy7 WarangalDist ID GeometryShape LengShape Area123 1Bo753337 16838673859.80116 1BoG(430537 7655003826.81122 1BoG662231 11771979304.40117 1BoG(573986 9510748717.53115 1BoG\53851203218046.01114 1BoG(587854 7813591915.82120 1BoG674389 12701135906.20Rice 1995 tableOBJECTIDDISTID DISTNAME NOYEAR 1995 RICEKA RICEKP RICERA RICERP23123 Adilabad1131995636471916116 Nizamabad781995102206348422122 Karimnagar10819951042608825217117 Medak83199564111417815115 Hyderabad731995111114114 Rangareddi68199522471835Data Storage and RetrievalA GIS does not store maps. It stores data organized into a database. The locationaldata of different features (coordinates, topology) are generated during the digitizationprocess. The attribute data of locations are created separately. the GIS must provide the linkbetween the locational and attribute data. The relational database model is most suitable toensure such linkage and the database query language can be used to retrieve data. Relationaldatabase concepts are therefore central to organizing and managing data in GIS. The specificformat of data storage varies with the GIS software. For example, Geomedia GIS stores thespatial and attribute data in a Microsoft Access databases. The feature attribute databasecreated during digitization is created in a specific folder called the Warehouse. The mapconnections are stored in file created in the Geoworksapces folder Retrieval of data ispossible by employing the appropriate query language for the database model. Other attributedatabases can be storesd as MS Access files anywhere in the system and connections to themcan be established if the share a common ID with the feature attribute table.Geographic AnalysisWhat distinguishes GIS from other databases or information systems are its spatialanalysis functions. These functions use spatial and non-spatial data to answer questions about16
the real world. The answers could relate to a presentation of the current data (first level use),some patterns in the current data (second level use) and predictions of what the data could beat a different place or time (third level use). Geographic analysis is carried out using thelayers of map information created in vector or raster data formats and associated attributedata to find solutions to specific problems. In each case the problem needs to be definedclearly before the relevant map layers and analysis procedures can be identified. For instance,if the problem is to find optimal locations for siting of wells for conjunctive use in anirrigation project area, information about the geographical features influencing thegroundwater recharge will be required. These will include maps of existing well locations,rainfall, land use, soils and command area of the project, all of which influence recharge.Regions with recharge above a selected threshold value may be considered suitable foradditional wells. Further, if the area happens to be near the coast, a buffer zone may berequired within which no wells can be sited to prevent sea water intrusion. Similarly bufferzones may be required on either sides of canals to prevent drawal of canal water by the wells.What could happen to the ground water levels and quality in the area if the present use ispersisted with or changed could be the subject of another study where the GIS can help toprovide more realistic answers.Most standard GIS software come with basic analytical tools that permit overlays of thematicmaps, creation of buffers, etc., in addition to calculations of lengths and areas. Overlayoperations permit overlaying one polygon over the other to generate a new map of theirintersections which are new polygon combinations with desired homogenous properties withrespect to specified polygon attributes.Map Layer OverlayAll layers must bein same projectionand scaleOverlay generates homogenous units – eg. agroecozonesSource: FAO17
STEPS IN BUILDING A GISThe way in which a GIS is built will depend on the way information will be used inthe decision-making process. Building a GIS proceeds through at least 4 stages:(i)(ii)(iii)(iv)Defining the objectivesBuilding the spatial and attribute data basesDatabase management for geographic analysisPresenting results in the form of maps, etc.The definition of objectives or the problem to be solved using GIS is critical to thechoice of spatial and attribute databases. Once the problem is defined and the relevant maplayers and attribute data are identified, building databases involves:(i)(ii)(iii)(iv)database designentering spatial datacreating topologyentering attribute dataDesigning the database requires identifying:(i)(ii)(iii)(iv)(v)(vi)study area boundariescoordinate systemdata layersfeatures in each layerattributes for each feature typecoding and organizing attributesDepending on whether the map sources are two dimensional maps of the area orremote sensing imageries, data is entered in vector or raster format. In the vector format,entering spatial data and creating topology are components of overall digitization process.Raster data will need to be vectorized before topologies can be built. Attribute data is createdin the form of database files with one field, the feature identification field, in common withthe spatial data base created during the spatial data entry process.Data base management refers to translating the digitized map into real worldcoordinates, identifying coverages for analysis and maintaining the data base.Presenting the maps for decision-making is facilitated by creating customized mapsusing the various facilities available in GIS software.SUMMARYA GIS is a computer based tool for geographical analysis of information. It is notsimply a digitized map, nor does it hold maps. It holds a database of spatial data and attributeor descriptive information about features on a map which can be used to create desired maps.The crucial concept of GIS is the separation of spatial or geographic reference informationand attribute or descriptive information of map features for data entry and databasedevelopment, and their linkage during analysis. Central to both spatial and attribute18
information is the database management concept. The separation of the two types ofinformation facilitates entering the spatial information (map) into computers in a digitizedform and establishing connectivity (topology) between different stored map features (points,lines and polygons). The feature attribute data is entered independently taking care tointroduce an identification variable which is in common with the identification variable foreach feature that is common with the spatial database. For geographic analysis, the spatialand attribute data are linked through this unique identifi
applications, but with an important difference; all information in a GIS must be linked to a spatial reference. Other data bases may contain locational information (addresses, pin codes etc), but the GIS uses georeferences as