Transcription
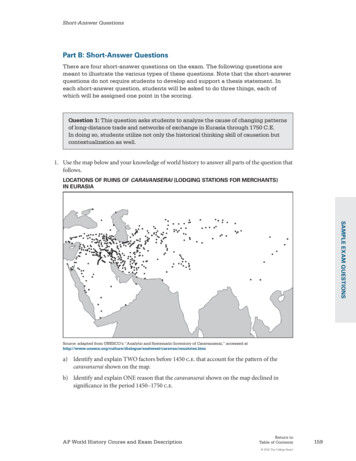
Name:Exam Style QuestionsEnsure you have: Pencil, pen, ruler, protractor, pair of compasses and eraserYou may use tracing paper if neededGuidance1. Read each question carefully before you begin answering it.2. Donʼt spend too long on one question.3. Attempt every question.4. Check your answers seem right.5. Always show your workingsRevision for this topic Corbettmaths 2015
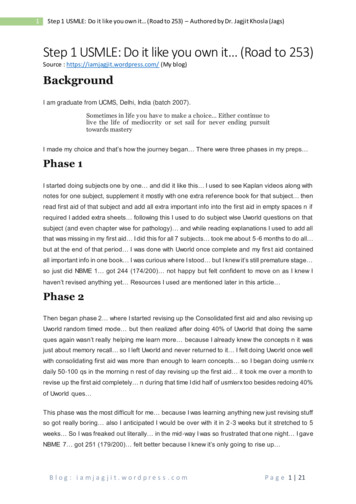
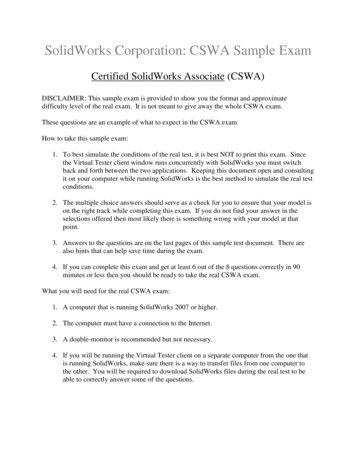
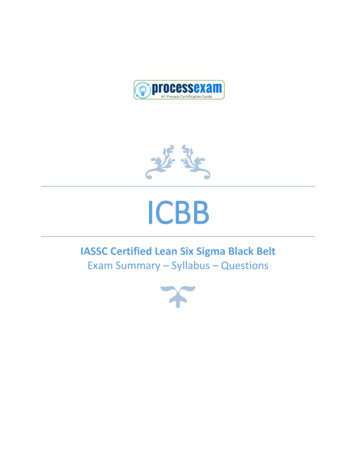
1.!The pie chart shows the colours of 32 beads.!How many green beads are there?.(1)2.!The pie chart shows the colours of cars in a car park.!(a) What is the most common colour of car in the car park?.(1)!(b) What is the least common colour of car park?.(1) Corbettmaths 2015
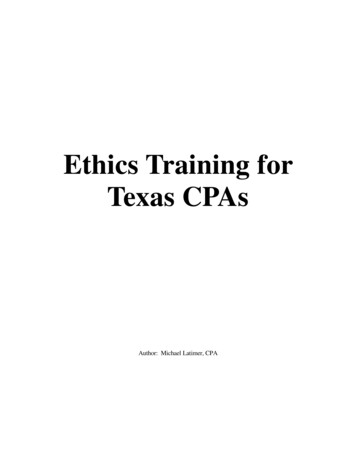
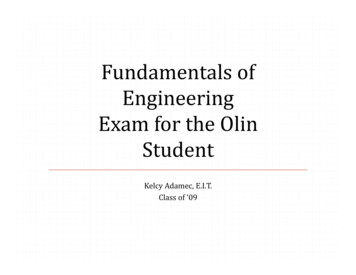
3.!The pie chart shows information about the hair colour of the students in a class.!A student from the class is chosen at random.!!!(a) Mark, with the letter, the probabilities of each of the following on the scalebelow.The first one has been done for you.!!!!!!A: The student has brown hair.B: The student has blonde hair.C: The student has green hair.!(2)!There are 24 students in the class!(b) How many students have blonde hair?.(1) Corbettmaths 2015
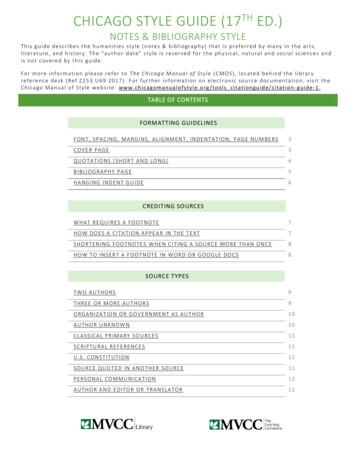
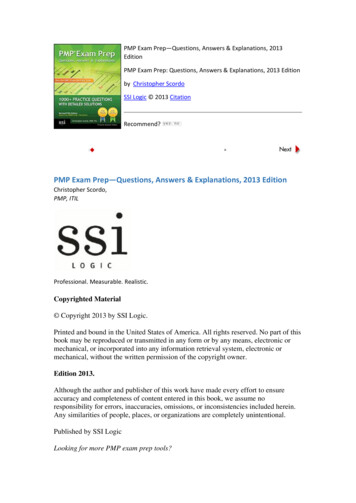
4.!A bag contains red, white and black counters.!The pie chart shows information about the counters in the bag.!!(a) What fraction of the counters are white?Give your answer in its simplest form.(2)!!(b) What fraction of the counters are red?Give your answer in its simplest form.(2)!There are 24 counters in the bag.!(c) Work out how many counters are black.(2) Corbettmaths 2015
5.!!A group of rugby fans were asked who they supported.The pie chart and table show information about who they support.!Use the pie chart to complete the table.(4) Corbettmaths 2015
6.!!!!A youth club has two rugby teams, Under 13ʼs and Under 15ʼs.!!The Under 13ʼs played 28 matches.The Under 15ʼs played 18 matches.!!Which team won more matches?Show your workings.The pie charts show information about the number of games each team won andlost, last season.(3) Corbettmaths 2015
7.!The pie chart shows types of properties in a street with 80 properties.!(a) Work out the percentage of properties that are semi-detached.%(2)!(b) Work out the number of semi-detached properties.(2) Corbettmaths 2015
8.!!The pie chart shows the flavours of ice cream sold by a shop in one day.There were a total of 270 ice creams sold.!(a) Calculate the number of vanilla flavoured ice creams sold.(2)!(b) Calculate the number of mint flavoured ice creams sold.!.(2)(c) Calculate the number of strawberry flavoured ice creams sold.(2) Corbettmaths 2015
9.!The pie chart shows information about how Mr.Jenkins spent his salary for July.!He was paid 2000 in July.!Work out how much Mr.Jenkins spent on rent and bills. .(2) Corbettmaths 2015
10.!The pie chart shows the holiday destinations of 60 people.!Draw a bar chart to represent this information.!(4) Corbettmaths 2015
11.!!!The pie chart shows information about the languages studied in a school.There are 648 students in the school.Each student studies one language.!How many more students study Chinese than French?.(4) Corbettmaths 2015
12.!!The pie charts show information about the results of chess matches that twoplayers have played in over the course of a year.!Andre drew 5 matches.!(a) How many matches did Andre win?.(2)!Edward says “the pie charts show that Pete won more matches than Andre.”!!(b) Is Edward correct?You must explain your answer.!.!.!.!.(1) Corbettmaths 2015
Exam Style Questions Ensure you have: Pencil, pen, ruler, protractor, pair of compasses and eraser You may use tracing paper if needed Guidance 1. Read each question carefully before you begin answering it. 2. Donʼt spend too long on one question. 3. Attempt every question. 4. Check