Transcription
Who PaysIncomeTaxes: TaxYear 2019DECEMBER 8, 2021BY: DEMIAN BRADYA publication of the National Taxpayers Union Foundation
N AT I O N A L TA X P AY E R S U N I O NF O U N D AT I O NKey Facts:New IRS data for tax year 2019helps to illustrate the progressivityof the income tax: the top 1 percentof earners paid 39 percent of allincome taxes. Over two-thirds ofall taxes were paid by the top 25percent of all filers.Compared to 2018, the averageAdjusted Gross Income share fellslightly as those in the middleincome saw modest gains.The bottom 50 percent are largelyshielded from the income taxburden, contributing 3 percent ofall income taxes. Their after-taxincome is also boosted by meanstested transfer payments.In 1980, the top marginal taxrate stood at 70 percent. As taxreductions enacted since thenreduced the top rate to 37 percent,the tax share of the top earners hasincreased.2The trends show that the taxcode has become increasinglyprogressive, and when people areallowed to keep more of their ownmoney, they prosper, move up theeconomic ladder, and pay a biggerpart of the nation’s income tax bill.IntroductionIt’s become an article of faith among many progressivesthat “the rich aren’t paying their ‘fair share’” of incometaxes. This claim is used to justify the hundreds ofbillions in tax hikes on individuals and the 80 billionbudget boost to the Internal Revenue Service to increaseaudits and tax enforcement in the Build Back Betterreconciliation bill.However, recent data from the Internal Revenue Service(IRS) provides a reminder that the federal income tax codeis already highly progressive, with the top earners payingthe lion’s share of all income taxes. Despite claims that thepassage of the 2017 Tax Cuts and Jobs Act (TCJA) wouldrig the tax code in favor of the wealthy, the tax systembecame more progressive in the 2018 IRS data release evenas income tax rates were reduced. The release of 2019 datashows that not much has changed on this front.This latest release of IRS data shows that the top 25percent of earners paid nearly 87 percent of all incometaxes in 2019. Lower income earners are largely sparedfrom income taxes with the bottom 50 percent of earnersowing just three percent of the national share.More significantly, 2019 was the second year under thereforms enacted through the TCJA. The IRS data showthat the economic expansion it encouraged was beginningto boost middle class incomes. The income tax share ofthe top income earners fell, but this was because theirshare of Adjusted Gross Income (AGI) also shrunk. Thechanges were relatively small but could have potentiallymarked the start of a new trend of middle income wealthexpansion. While more recent data is not yet available,this was likely cut short in 2020 by the pandemic andeconomic shutdowns that forced many people out of theirjobs.Tax Shares in Tax Year 2019The IRS’s Statistics of Income division publishes annualdata showing the share of taxes paid by taxpayers acrossranges of Adjusted Gross Income (AGI). The newlyreleased report covers Tax Year 2019 (for tax forms filed in2020).1The newest data show that the top 1 percent of earners(with incomes over 546,434) paid nearly 39 percent of allincome taxes. The amount of taxes paid in this percentileis nearly twice as much as their AGI share, consistent withthe steeply progressive nature of the income tax.Internal Revenue Service. (2021). Number of Returns, Shares of AGI,Selected Income Items, Credits, Total Income Tax, AGI Floor on Percentiles, andAverage Tax Rates: 2019. Retrieved from dual-income-tax-rates-and-tax-shares.12
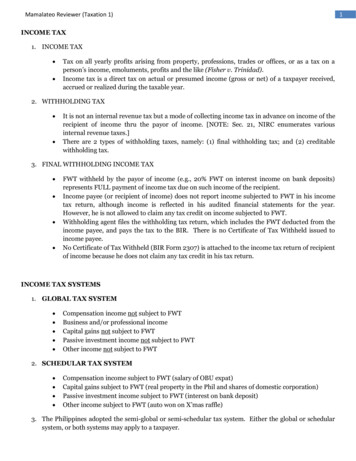
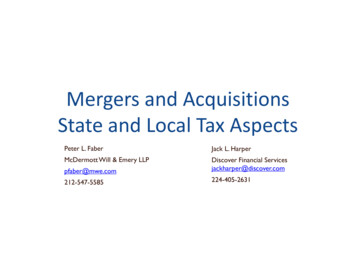
N AT I O N A L TA X P AY E R S U N I O N F O U N D AT I O NTable 1. Who Pays Income Taxes: Tax Year 2019PercentagesRanked by AGIAGI Threshold onPercentilesAdjusted GrossIncome ShareShare of FederalPersonal IncomeTax PaidRatio of Percentageof Personal IncomeTax Paid to AGI ShareTop 1% 546,43420.14%38.77%1.92Top 5%221,57235.93%59.44%1.65Top 10% 154,58947.30%70.81%1.5Top 25% 87,91768.82%86.65%1.26Top 50% 44,26988.51%96.94%1.1Bottom 50% 44,26911.49%3.06%0.2750Share of Adjusted Gross Income and Income TaxesPaid by Bracket Range (2019)403020100Percentage of TaxpayersBottom 50%Adjusted Gross IncomeShare (Percentage)Top 25 - 50%Federal PersonalIncome Tax Share(Percentage)Top 10 - 25%Top 1 - 5%Top 5 - 10%Top 1%The top 10 percent of earners bore responsibility for 71 percent of all income taxes paid and the top 25percent paid 87 percent of all income taxes. Altogether, the top half of filers earned 89 percent of allincome and were responsible for 97 percent of all income taxes paid in 2019.The other half of earners (those with incomes below 44,269) took home 11.5 percent of total nationwide income and owed 3 percent of all income taxes in 2019. Among this group are many filers with noincome tax liability either because their earnings were below the taxable threshold or due to eligibilityfor tax credits that reduce income tax liability. Separate IRS data shows that there were nearly 54 milliontax returns in 2019 with no income tax liability. Among these returns, 94 percent were filed by thosewith incomes less than 50,000.3
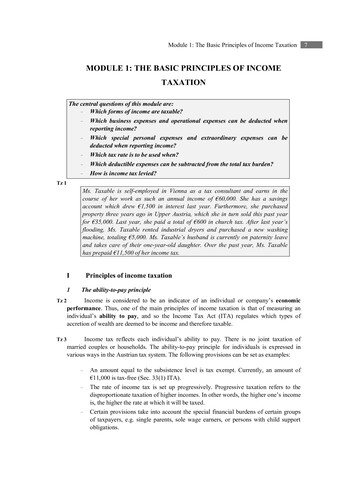
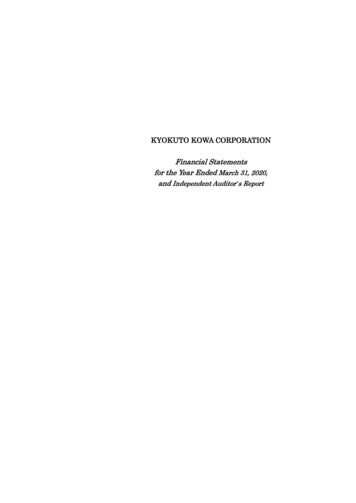
N AT I O N A L TA X P AY E R S U N I O NF O U N D AT I O NStarting in 2018, the TCJA lowered tax rates, nearlydoubled the standard deduction, and expanded thechild tax credit, among other changes. Despite the ratereductions, the result was a distribution of tax burdensthat was in fact more progressive in the first year of thereformed tax code.Income Tax Share by AGIBracket Range (2019)38.77% 20.68% 15.84% 10.29% 11.37% TopTop25 - 50% 10 - 25%Top5 - 10%3.06% Bottom50%Top1 - 5%The TCJA and the Tax ShareNTUF has compiled historical IRS data tracking thedistribution of the federal income tax burden since 1980.In that year, the top marginal income tax rate stood at70 percent and the wealthiest one percent of earners’share of income taxes was 19 percent.2 Over the nextdecades, their share of income taxes has increased evenas the top tax rates were reduced. By 2018 the top ratehad fallen to 37 percent yet the income tax share of thewealthiest one percent had doubled to 40 percent — thehighest share reported in the decades of data.Table 2. Tax Share of the Top 1 & 5 Percent of IncomeEarners: 1980 - 2019Top1%AGI Bracket vs. Percentage ofFederal Personal Income Tax Paid(2019)3.06%96.94%Top 50% (Minimum AGI of 44,269)Bottom 50% (AGI 44,269)Tax YearPercentage ofFederalPersonalIncome TaxPaid by theWealthiest 1PercentPercentage ofFederalPersonalIncome TaxPaid by theWealthiest 5PercentHighestMarginal 8.859.437The new data from the IRS covers the second yearof reported data under the changes ushered into lawthrough the TCJA. In 2019, the income tax share of thewealthiest earners slightly decreased, as did their shareof AGI. For example, the AGI of the top 1 percent fellfrom 20.9 percent to 20.1 percent while their share ofthe income tax burden fell from 40.1 percent to 38.8percent. Similar small decreases occurred through thetop 25 percent of earners. More detailed information isavailable from the IRS in Table 3 below that shows thatthose on the lower end of the income spectrum, (with2019 income in the range from 44,000 to 58,000) sawsmall gains in AGI from 2018 to 2019.National Taxpayers Union Foundation. How Have the Top and BottomIncome Tax Brackets Changed Over Time? Retrieved from time.24
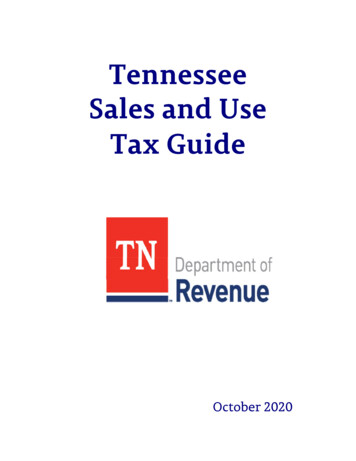
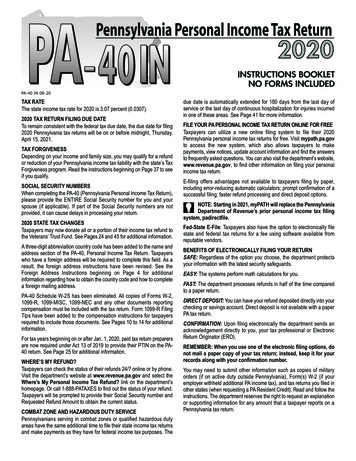
N AT I O N A L TA X P AY E R S U N I O N F O U N D AT I O NTable 3. Change in AGI Share from 2018 to 2019 by Percentiles of IncomeDescending Cumulative Percentiles 2018 AGI Share2019 AGI ShareChange from 2018 to 2019.001 percent2.091.81-0.28.01 percent4.934.4-0.53.1 percent10.359.6-0.751 percent20.9320.14-0.792 percent26.3325.61-0.723 percent30.329.65-0.654 percent33.5933-0.595 percent36.4835.93-0.5510 percent47.6647.3-0.3620 percent63.0462.88-0.1625 percent68.9168.82-0.0930 percent73.9673.92-0.0440 percent82.1582.190.0450 percent88.3988.510.12Since 1980 the income tax share of the bottom half of earners has fallen from 7 percent to 3 percent in2019. This has happened as their AGI decreased from 18 percent to 11.5 percent and the AGI share of thetop earners increased. For example, the AGI share of the top 1 percent increased from 8.5 percent to 20percent from 1980 to 2019 and, for the top 10 percent from about a third of AGI in 1980 to just underhalf in 2019. As their earnings have increased, so has their tax burden.It is also important to remember that AGI is an adjustment of income for tax purposes. Many middleincome earners are able to reduce their AGI by deducting IRA contributions. AGI also excludes manytransfer payments and federal benefits. Analysis from the Congressional Budget Office shows thatindividuals in the lowest income quintile receive half of all means-tested transfers through governmentbenefits. These transfers lifted their income in 2018 by 64 percent — 37,700 after transfers versus 22,500 before them.3Percentage of Federal Personal Income Tax Paid byEarners 1980-2019100%80%60%40%20%0%1980 1985 1990 1995 2000 2005 2010 2015 2019Top 1%Top 5%Top 10%Top 25%Top 50%Bottom 50%3Congressional Budget Office. (2021). The Distribution of Household Income, 2018. Retrieved from tribution-Household-Income.pdf.5
N AT I O N A L TA X P AY E R S U N I O N F O U N D AT I O NThis new IRS data should help inform the debate in Congress about the fairness of the tax system as thePresident and his allies push for higher taxes and increased tax enforcement.The decades-long trend is clear: the tax code has become increasingly progressive, and when people areallowed to keep more of their own money, they prosper, move up the economic ladder, and pay a biggerpart of the nation’s income tax bill. Meanwhile, many low-income earners are afforded protections fromincome taxes through deductions and credits.Even counting payroll and other taxes, the top income earners pay a substantial portion of taxes.The CBO finds that the highest income quintiles average total federal tax rate was 24 percent.4 Bycomparison the lowest quintile’s was less than 0.1 percent due to refundable credits.ConclusionThe BBB would impose hundreds of billions in tax hikes targeting wealthy individuals. Along with thecomplicated business tax hikes, the plan would undermine the much-needed economic recovery on thebasis of the faulty assessment that the wealthy do not face significant tax burdens.The BBB also includes large expansions of refundable credits which provide payments to individualseven if they have no income tax liability. If enacted, this would remove more individuals from thetax rolls. This raises basic questions of fairness as an increasing share of the tax burden falls on theshoulders of a small percentage of taxpayers. Politicians should consider the existing tax burdendistribution while striving for a tax system that imposes minimal burdens on private sector wealthcreation that opens up opportunities for all.About the AuthorDemian Brady is the Vice President of Research for National Taxpayers Union Foundation, where he runs theorganization’s Taxpayers’ Budget Office.4Ibid.2021 National Taxpayers Union Foundation122 C Street NW, Suite 650, Washington, DC 20001ntuf@ntu.org
New IRS data for tax year 2019 helps to illustrate the progressivity of the income tax: the top 1 percent of earners paid 39 percent of all income taxes. Over two-thirds of all taxes were paid by the top 25 percent of all filers. Compared to 2018, the average Adjusted Gross Income share fell