Transcription
Consumer Fraud in the United States:An FTC SurveyStaff Report of theBureaus of Economics and Consumer ProtectionFederal Trade CommissionKeith B. AndersonAugust 2004
Federal Trade CommissionTimothy J. MurisMozelle W. ThompsonOrson Swindle*Thomas B. LearyPamela Jones rCommissionerLuke M. FroebJ. Howard Beales, IIIDirector, Bureau of EconomicsDirector, Bureau of Consumer ProtectionThe author is an economist in the Bureau of Economics of the Federal Trade Commission. Theviews expressed in this report are those of the author and do not necessarily reflect the views ofthe Federal Trade Commission or any individual Commissioner.* Commissioner Swindle did not participate in this matter.ii
AcknowledgmentsJohn Yun and Hajime Hadeishi made major contributions to the econometric analyses inChapters 4 and 5 respectively. Without their hard work and expert advice, the study wouldnot be what it is. James Lacko, Jesse Leary, Alan Mathios, and David Newhouse providedextremely useful advice on methodological issues. The survey was conducted by Public OpinionStrategies, and Bill McInturff, Elizabeth Frontczak and Tom Dewhurst of that firm madesignificant contributions to the survey design, as did various staff in the Bureau of ConsumerProtection of the FTC. Christopher Kelley and David Yans provided valuable assistance incoding open-ended responses. Dawne Holz in the Office of Consumer and Business Educationin the Bureau of Consumer Protection was responsible for the formatting of the report. Draftswere reviewed and valuable editorial suggestions provided by Howard Beales, Pauline Ippolito,Lydia Parnes, Paul Pautler, Nat Wood, and Kial Young. Assistance was also provided by CarolynSamuels, Stefano Sciolli, Marie Tansioco, and Lance Toler.iii
iv
Table of ContentsTable of ContentsList of Tables.viiList of Figures. ixExecutive Summary . ES-1Chapter 1: Introduction .1Other Studies .2Chapter 2: Description of the Survey.7Types of Fraud Investigated.7Specific Types of Fraud .8More General Problems That May Be Associated With Fraud .17Switching of Long Distance Telephone Service Providers .18Victims of Fraud or Targets of Fraud?.19Consumer Purchasing Behavior .20Chapter 3: Which Types of Frauds Are the Most Common? .25The Number of Victims .25The Number of Incidents .30Media Employed.37The Cost of an Incident of Fraud.38Open-Ended Descriptions of Fraudulent Experiences.41Methodological Appendix to Chapter 3 .45Chapter 4: Who is a Victim of Fraud?.49Characteristics Analyzed .49Methodology.52Analysis of Aggregate Measures of Risk.54Race and Ethnicity.55Current Income.62Future Income.63The Burden of Debt .65Age .68Marital Status.69Other Characteristics .69The Likelihood of Being a Victim of Specific Frauds .70Slamming vs. Frauds .71Different Types of Frauds.74The Role of Language .75Conclusion .76v
Consumer Fraud in the United States: An FTC SurveyChapter 5: Who Complains? .79Complaint Data Collected .79To Whom Do Consumers Complain?.80Characteristics of Those Who Complain .82Internet Usage.84Education Level.96Age .97Income .98Gender and Marital Status .99Race and Ethnicity.100Method of Payment .101How Satisfied Are Those Who Complain? .102Entity To Whom Complaint Was Made.103Amount Lost.108Internet Usage, Education, Marital Status, Gender, and Age .108Income .109Race and Ethnicity.109Payment Mechanism .110Conclusion .111Chapter 6: Conclusion .115Issues for Future Studies.117Appendix A: The Survey Instrument. A-1vi
List of TablesList of TablesTable ES-1: The Most Common Types of Consumer Fraud .ES-3Table ES-2: Percent of Survey Participants Who Are Victims of Frauds,by Single Characteristic .ES-8Table 2-1: Consumer Responses to Solicitations .21Table 3-1: Estimated Number of Adults Who Were Victims of Fraud or Had Their LongDistance Telephone Service Changed Without Permission,One Year Period Prior to the Survey .26Table 3-2: Estimated Number of Incidents of Fraud or of Unauthorized Changes in LongDistance Telephone Service, One Year Period Prior to the Survey.32Table 3-3: Number of Incidents Experienced by Victims .35Table 3-4: Fraud Incidents by Type of Product Involved .36Table 3-5: How Victims First Learned About the Product or Service Involved in Frauds.38Table 3-6: Distribution of Estimated Losses Per Incident for Different Types of Frauds .40Table 3-7: Responses to Open-Ended Question About The Type of Fraud Experienced.41Table 3-8: Closed-End Responses of Survey Participants Who Described Frauds ThatOccurred in the Last Year in Answer to Open-Ended Question.43Table 4-1: Distribution of Values for Explanatory Variables.50Table 4-2: Percent of Survey Participants Who Are Victims, By Single Characteristic .56Table 4-3: Likelihood of Being a Victim, Probit Estimation, Marginal Effects,Aggregate Measures .59Table 4-4: Likelihood of Being a Victim, Probit Estimation, Marginal Effects,Individual Problems .72Table 5-1: To Whom Did Consumers Complain? .80Table 5-2: Percent of Consumers Who Complained, By Type of Problem.82Table 5-3: Percent of Consumers Who Complain, By Single Characteristic .86Table 5-4: Likelihood of Filing a Complaint, Probit Estimation, Marginal Effects,Complaints Filed with Anyone.88Table 5-5: Likelihood of Filing a Complaint, Probit Estimation, Marginal Effects,Complaints Filed with Official Sources .90Table 5-6: Likelihood of Filing a Complaint, Probit Estimation, Marginal Effects,Complaints Filed with Seller or Manufacturer.92Table 5-7: Likelihood of Filing a Complaint, Probit Estimation, Marginal Effects,Complaints Filed with Bank or Credit Card Company .94Table 5-8: Degree of Satisfaction with Results of Complaints .103vii
Consumer Fraud in the United States: An FTC SurveyTable 5-9: Satisfaction with the Results of a Complaint, By Single Characteristic .104Table 5-10: Satisfaction with Results of Complaints, Probit Estimation, Marginal Effects .106Table 5-11: Marginal Effects by Fraud Type, Conditional-Mean-Imputation ProbitEquations.112viii
List of FiguresList of FiguresFigure ES-1: Most Common Types of Consumer Fraud .ES-2Figure ES-2: Victims of Fraud, By Race and Ethnicity.ES-4Figure ES-3: Victims of Fraud, By Expected Income - Three Years Future .ES-5Figure ES-4: Victims of Fraud, By Comfort with Current Level of Debt .ES-6Figure ES-5: Victims of Fraud, By Age.ES-6Figure 3-1: Specific Types of Fraud, By Number of Victims .29Figure 3-2: Specific Types of Fraud, By Number of Incidents .31Figure 3-3: Media Used to Promote Frauds .37Figure 3-4: Median Dollars Lost, By Specific Type of Fraud.40Figure 4-1: Likelihood of Being a Victim, By Race and Ethnicity.55Figure 4-2: Likelihood of Being a Victim, By Expected Change in Future Income.64Figure 4-3: Likelihood of Being a Victim, By Comfort with Current Level of Debt .66Figure 4-4: Likelihood of Being a Victim, By Age.67Figure 4-5: Likelihood of Being a Victim, Fraud Compared to Slamming .74Figure 5-1: Likelihood of Complaining, By Internet Usage .84Figure 5-2: Likelihood of Complaining, By Education .96Figure 5-3: Likelihood of Complaining, By Age .97Figure 5-4: Likelihood of Complaining, By Gender.99Figure 5-5: Likelihood of Complaining, By Race and Ethnicity .100Figure 5-6: Complaint Satisfaction, By Party Complained To .103Figure 5-7: Complaint Satisfaction, By Payment Mechanism.110ix
Consumer Fraud in the United States: An FTC Surveyx
Executive SummaryExecutive SummaryConsumer frauds pose a threat to consumers and the economy. Even themost wary and sophisticated consumers may fall victim to fraudulent offers – inthe mail, in the media, and on the Internet. To learn more about the extent ofconsumer fraud and to enhance our understanding of its victims, the Federal TradeCommission (“FTC”) last year commissioned a survey of 2,500 randomly-chosenadults about their consumer experiences during the previous year.This survey will help the FTC better serve fraud victims through lawenforcement and education. The survey was designed, in part, to assist theagency in determining whether information in the FTC’s Consumer Sentineldatabase of fraud complaints is representative of consumers’ actual experienceswith fraud in the marketplace. The survey provides the agency with a broadersnapshot of fraud in America which, in addition to helping target law enforcementactions, will allow the FTC to target education campaigns more precisely towardsparticular consumer groups who are at risk of falling victim to fraud but who maynot complain to the FTC about their experiences.Rather than asking generally whether survey participants had fallen victimto “fraud” in the past year, the survey targeted ten specific types of fraud and twoadditional situations that frequently indicate that a fraud may have occurred.1The ten specific frauds were selected because they cover the most prevalenttypes of complaints reported in the FTC’s complaint database and are frauds thathave frequently led to FTC enforcement actions. The survey also asked about“slamming” – a situation in which a consumer’s long distance telephone serviceis switched from one carrier to another without the consumer’s permission.Although the FTC’s complaint database includes many consumer complaintsconcerning slamming, slamming is somewhat different than the other consumerproblems covered by the survey. (Unlike many of the other problems, victimsof slamming do receive something of value, in that they are still able to makelong distance telephone calls, though not via the carrier they have chosen;and therefore it is difficult to determine the extent of the injury.) In addition,telephone service is regulated by the Federal Communications Commission,rather than the FTC. Slamming is therefore considered separately.The ten specific types of fraud were (1) paying an advance fee to obtain a loan or credit card that aconsumer was promised or guaranteed to receive, (2) being billed for a buyers’ club membership a consumerdid not agree to purchase, (3) purchasing credit card insurance, (4) purchasing credit repair services, (5)paying money or making a purchase to receive a promised prize and then not receiving the prize or receivinga prize that was not as promised, (6) being billed for Internet services a consumer did not agree to purchase,(7) purchasing a membership in a pyramid scheme, (8) being billed for information services provided eitherover the Internet or by pay-per-call telephone service that a consumer had not agreed to purchase, (9) makinga payment to someone who represented that as a result of making the payment a consumer would receive agovernment job, and (10) purchasing a business opportunity where the seller made earnings claims that werenot realized or promised assistance that was not provided. The two more general situations were (1) payingfor a product or service that a consumer does not receive and (2) being billed for a product, other than thespecific products identified above, that a consumer had not agreed to purchase.1.ES-1
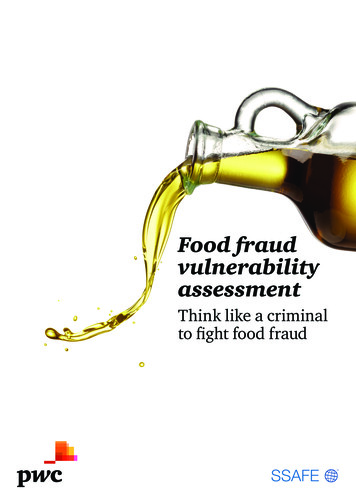
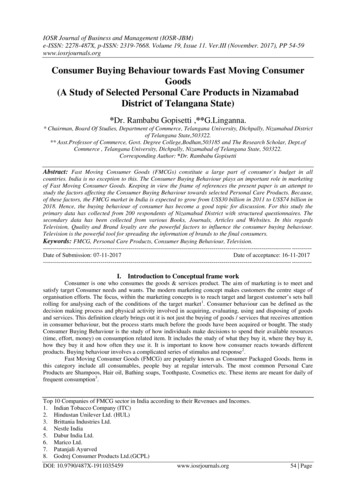
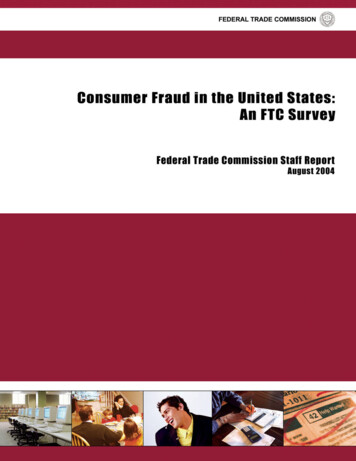
Consumer Fraud in the United States: An FTC SurveyWhat are the Top Problems Identified by the Survey?The survey suggests that nearly 25 million adults in the U.S. – 11.2 percentof the adult population – were victims of one or more of the consumer fraudscovered by the survey during the previous year. More than 35 million incidents ofthese various frauds occurred during the year.2Advance Fee Loan ScamsFigure ES-1Most Common Types of Consumer Fraud5.04.554.0Millions of VictimsThe mostfrequently reportedtype of consumerfraud was advancefee loan scams,which involve aconsumer payingmoney to a sellerprior to receivinga promised orguaranteed loan orcredit card. FTCrules prohibitcharging suchan advance feein the context .0Advance Fee Buyers' ClubsLoansCredit CardInsuranceCredit sSome 4.5 million consumers – 2.1 percent of U.S. adults – made suchpayments, but did not receive the promised loan or credit card in the yearcovered by the survey. Some survey participants reported that they had paid fora promised loan or credit card more than once during the last year. As a result,an estimated 6.5 million incidents of this fraud occurred during the year, or threeincidents per 100 adults.Buyers’ Club MembershipsThe second most commonly reported fraud covered by the survey was beingbilled for a membership in a buyers’ club or for a buyers’ guide publicationwithout having agreed to join the club or purchase the publication. Some fourmillion U.S. adults – 1.9 percent of the adult population – were unwittingly billedfor memberships in these clubs or for such buyers’ guides in the year prior to thesurvey. An estimated 4.8 million incidents of this type of fraud took place duringthat time.2.As discussed in the report, these estimates are based on somewhat conservative assumptionsregarding who is considered to be a victim. (See page 11.) Figures on the number of victims and theircharacteristics are based on data that has been appropriately weighted, using weights supplied by thecontractor who conducted the survey, to adjust for sampling and response rate issues.ES-2
Executive SummaryCredit Card Insurance and Credit RepairThe third and fourth most common frauds were also related to credit:An estimated 3.3 million adults bought insurance as protection against theunauthorized use of credit cards, and some 2.0 million adults paid for credit“repair” services. Fraudulent operators sell credit card insurance by claimingthat card holders face considerable financial risk if their credit cards are misused.This costly insurance, however, is generally unnecessary because federal lawlimits consumer liability to 50, and credit card companies often do not requireconsumers who report a lost, stolen, or misused credit card to pay anything.Credit repair frauds may involve paying money to someone who falsely promisesto have truthful, negative information removed from a consumer’s existing creditrecord. Credit repair frauds also may involve paying for information about howto establish a new credit record by using a number other than a Social Securitynumber to apply for credit. Both of these types of credit repair are illegal.Table ES-1: The Most Common Types of Consumer FraudNumber ofVictimsa(millions of adults)Number ofIncidentsb(millions)Paid an advance fee to obtain a loan or credit card that you werepromised or guaranteed you would receive4.556.55Billed for buyers’ club memberships you did not agree to purchase4.054.80Purchased credit card insurance3.354.60Purchased credit repair2.002.45Paid money or made a purchase to receive a promised prize anddid not receive the prize or prize was not as promised1.802.40Billed for Internet services you did not agree to purchase1.751.90Purchased a membership in a pyramid scheme1.552.55Total, Specific Types of Fraud Included in the Survey18.3527.40Total, Any Type of Fraud, Specific or General, Included in theSurvey24.4535.45Unauthorized Changes in Long Distance Telephone Service(“Slamming”)13.9017.60Total, Any Fraud Covered by Survey or Unauthorized Changes inLong Distance Service35.6053.00Type of ProblemNotes.a Individuals are included only once in these counts, even if they experienced multiple incidents of the relevantfraud. Numbers are rounded to the nearest 0.05 million. Numbers will not add to totals, because some individualsexperienced several types of fraud.b Each incident of fraud is included in these counts, including multiple incidents for an individual. Numbers arerounded to the nearest 0.05 million. Numbers may not add to totals, because of rounding.Source: Tables 3-1 and 3-2.ES-3
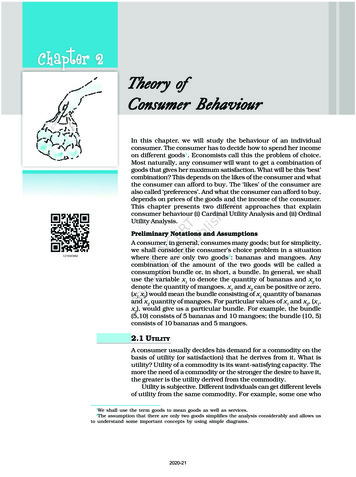
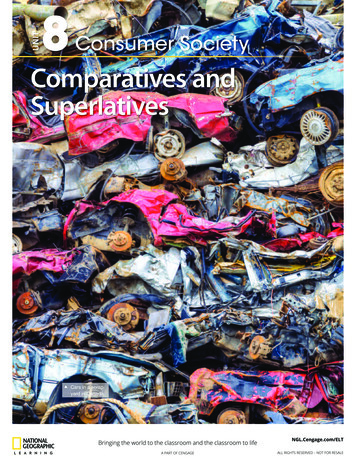
Consumer Fraud in the United States: An FTC SurveyTelephone SlammingThe survey also found that an estimated 13.9 million consumers experiencedunauthorized changes in long distance telephone service – 6.5 percent of the U.S.adult population. Indeed, some consumers reported that they were slammed morethan once: An estimated 17.6 million incidents of slamming occurred during theyear preceding the survey.Frauds Are Mass MarketedThe survey revealed that 33.0 percent of fraud victims first learned about anoffer or product that turned out to be fraudulent from a printed source, includingnewspaper or magazine ads, direct mail solicitations, catalogs, and posters.Telemarketing was the first source of contact in 16.8 percent of the frauds reportedby survey participants; the Internet – including email and web sites – was the firstcontact in 14 percent of cases.Who Is Most Likely to be a Victim?Some consumers are more likely to become victims of fraud than others. Thestudy found that race or ethnicity, expectations about future income, and comfortwith one’s level of debt were all associated with the likelihood of being a victimof fraud.Racial and Ethnic MinoritiesThe surveyfound that membersof several racial andethnic minoritieswere much morelikely to be victimsof fraud than nonHispanic whites.Of non-Hispanicwhites, 6.4 percenthad been victims ofone or more of thefrauds covered bythe survey duringthe previous year.3Figure ES-2Victims of FraudBy Race and spanic WhitesOthers0%HispanicsAfrican AmericansAmerican Indians /Alaska Natives3.Although the numbers in the text are the results of simple cross-tab comparisons of members ofdifferent racial and ethnic groups, the results are qualitatively the same after controlling for demographicdifferences such as income and education.ES-4
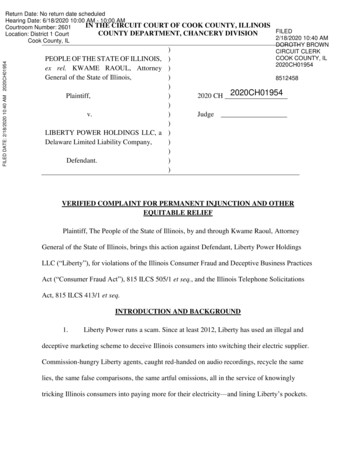
Executive SummaryThose who are American Indians or Alaska Natives were at greatest risk:Almost 34 percent of survey participants in this group had been victims of one ormore of the frauds covered by the survey in the preceding year – more than fivetimes the percentage of victims among non-Hispanic whites.4Both Hispanics and African Americans were more than twice as likely tobe victims of consumer fraud as non-Hispanic whites. Some 14.3 percent ofHispanics and 17.1 percent of African Americans interviewed had been victims ofone or more of the frauds in the survey during the prior year. On the other hand,only 7.3 percent of participants who were assigned to the “Other” racial category– which includes those who identified themselves as Asian, as Hawaiian or OtherPacific Islander, or as belonging to more than one racial group – were victims.Consumers Who Expect Large Changes in Their Future IncomeThe surveyFigure ES-3also indicated thatVictims of Fraudconsumers whoBy Expected Income – Three Years Futureanticipate a large40%change in theirincomes in the next30%three years weremore than twice as20%likely to be victimsof fraud as those14.2%who expect their10%11.0%9.6%incomes to remain7.2%5.0%stable. Only five0%Much LowerSlightly LowerAbout the SameSlightly HigherMuch Higherpercent of surveyparticipants whoexpected theirincomes to remain largely unchanged over the next three years reported beingvictims of one or more of the frauds examined. By contrast, 11.0 percent ofsurvey participants who expected their incomes to be much lower and 14.2percent of those who expected their incomes to be much higher in the next threeyears were victims.4.While the number of survey participants who described themselves as American Indians or AlaskaNatives was small, the difference in the rate of fraud between this group and non-Hispanic whites isstatistically significant, as are all of the differences highlighted in the Executive Summary.ES-5
Consumer Fraud in the United States: An FTC SurveyConsumers Who Are Uncomfortable with Their Current DebtConsumerswho had more debtthan they couldcomfortably handlealso were morelikely to be fraudvictims. Only2.7 percent ofconsumers withoutdebt reported beingvictims of fraud.On the other hand,19.2 percent of thesurvey participantswho felt that theyhad too much debtindicated they hadbeen victims offraud – more thanseven times therisk faced by thosewithout any currentdebt.The Elderly Do NotExperience MoreFraudThe FTCsurvey found thatconsumers 65 yearsold or older did notexperience morefraud than thosewho were younger.Figure ES-4Victims of FraudBy Comfort with Current Level of Debt40%30%20%19.2%10%9.1%8.1%2.7%0%More Debt Than CanComfortably HandleAbout As Much Debt AsCan Comfortably HandleCould Handle More Debt Do Not Have Any PersonalThan Currently HaveDebtFigure ES-5Victims of FraudBy Age40%30%20%10%11.1%11.1%8.7%8.3%6.1%4.7%0%18 - 2425 - 3435 - 4445 - 5455 - 6465 and overWho Complains About Consumer Fraud?In 29.3 percent of cases of fraud or slamming, consumers did not complainto anyone about their experience. When consumers did complain, they mostfrequently complained to the seller or manufacturer of the product or serviceinvolved. Based on the survey results, an estimated 53.7 percent of consumerswho experienced an incident complained to the seller or manufacturer, and 18.6percent directed their complaints to a bank or credit card company. An estimated8.4 percent of consumers complained to an “official source” – a local, state,ES-6
Executive Summaryor federal government agency or a Better Business Bureau. Knowing whichtypes of consumers complain and to whom will help the FTC determine therepresentativeness of the Consumer Sentinel database of fraud complaints.Women and Younger Consumers More Likely to ComplainWomen and younger consumers were more likely to complain when theybelieved they had been defrauded. An estimated 74.5 percent of women whowere victims complained to someone about their experience. For men, thecomplaint rate was 10 percentage points lower. Similarly, almost 75 percentof consumers under the age of 35 complained, compared to 55.4 percent ofconsumers between 55 and 64.The survey found that those consumers who used a credit card were no moreor less likely to complain than those who used another payment mechanism.However, consumers who used a credit card were more likely to complain to abank or credit card company, and less likely to complain to an official source. Atthe same time
Consumer Fraud in the United States: An FTC Survey x ES-1 Executive Summary Executive Summary Consumer frauds pose a threat to consumers and the economy. Even the most wary and sophisticated consumers may fall victim to fraudulent offers – in the mail, in the medi