Transcription
Western India Regional Council ofThe Institute of Chartered Accountants of India(Set up by an Act of Parliament)E-Publication onOverview of Data Analyticsfor Finance ProfessionalsCreate Competence with EthicsAchieve Governance through Innovation
WESTERN INDIA REGIONAL COUNCIL OFTHE INSTITUTE OF CHARTERED ACCOUNTANTS OF INDIAPublished byCA. Lalit Bajaj, Chairman, WIRC, Western India Regional Council ofThe Institute of Chartered Accountants of India,ICAI Tower, Plot No. C-40, G Block, Opp. MCA Ground,Next to Standard Chartered Bank, Bandra-Kurla Complex,Bandra (East), Mumbai-400 051Tel.: 022-336 71400 / 336 71500 E-mail: wirc@icai.in Web.: www.wirc-icai.orgDisclaimerOpinions expressed in this book are those of the Contributors. Western India Regional Council of The Instituteof Chartered Accountants of India, does not necessarily concur with the same.While every care is taken to ensure the accuracy of the contents in this compilation, neither contributors norWestern India Regional Council of The Institute of Chartered Accountants of India is liable for any inadvertenterrors or any action taken on the basis of this book.iiWestern India Regional Council of The Institute of Chartered Accountants of India
ForewordThe year 2020 has seen a huge leap forward in adoption of digitalisation amongstprofessionals. All professionals, whether in industry or in practice, understand that astechnology plays a bigger role in the day to day aspects of a business, we have to move withthe times as technology and accountancy are slowly merging.Words like blockchain, artificial intelligence, machine learning, and data analysis have becomecommon amongst Chartered Accountants. While all of these buzzwords and their relatedconcepts are important, none seems to be quite as important as data analytics.Data Analytics is becoming commonplace in businesses as companies try to sift through hugeamounts of information because interpreting data effectively can improve business intelligenceand decision making significantly.As Chartered Accountants we are trained to observe, analyse and even predict trends.Understanding the importance of future trends, this year WIRC has focused intensively ontopics which impact the profession and generated publications which put our members andstudents on the path of future growth.This publication namely, ‘Overview of Data Analytics for Finance Professionals’ is one suchstudy which will help members and students become aware of big data analytics and itsimpact on the accounting profession, and every industry in general.It will give you a closer look at data analytics and what it really means for us in this field.Accountants can use data analysis when reviewing financial information to ensure the companyis running well, meeting goals, and maintaining or improving performance. This knowledge isessential to both a business’s sustainability and survival.For Members in practice, data analytics can be used to improve the client experience helpingto retain and bring on new clients.The importance of big data is only going to grow in the future. Learning about how data isused in accounting now will put you in a great position to become an asset in any role youplay in the accounting profession.I thank CA. Yashwant Kasar, RCM, for his dedication toward ensuring the publishing of thisstudy as well as the team of contributors comprising CA. Anant Govande, CA. Alok Jajodia,CA. Dinesh Kumar Tejwani, CA. Mitesh Katira and CA. Shirish Padey.I am confident the ‘Overview of Data Analytics for Finance Professionals’ publication will proveto be of tremendous benefit to all members and I am sure these insights will help everybodyget a better grasp of this important topic of data analytics.I congratulate all the contributors and members for this publication.CA. Lalit BajajChairman, WIRCWestern India Regional Council of The Institute of Chartered Accountants of Indiaiii
PrefaceAs technology continues to evolve, it promotes changes to business models and inan increasingly data-driven world, Chartered Accountants need to be able to adaptto these technological changes.Across the world and increasingly in India, Chartered Accountants find themselvesrequiring skills in data analytics as its use becomes widespread. Today, internal andexternal auditors use data analytics for continuous auditing, financial planning and todiscover new consumer and market trends to drive company strategy.In order to bring this subject to the forefront, WIRC is publishing this insightful bookon ‘Overview of Data Analytics for Finance Professionals’. It will highlight the use ofanalytics in auditing, by focusing on integrating analytics into the audit process andon defining how analytics can be used to enhance audit quality.This book also highlights future trends, insights into usage of tools for data analysis,commonly used statistical models for practical data analytics and usage of dataanalytics.I thank WIRC Chairman CA Lalit Bajaj for his encouragement and belief in theimportance of practical publications for the education of our members. I would liketo thank and appreciate the depth of work put forward by our contributors namelyCA Anant Govande, CA Alok Jajodia, CA Dinesh Kumar Tejwani and CA Mitesh Katirafor their commendable efforts to bring out this book within a short span of time.I also specially thank CA Shirish Padey for devoting time and reviewing the book withsome very useful inputs.I am sure that this book will be an asset to all the members looking to upgrade theirskill-sets and ensuring they transform into future ready professionals.CA Yashwant KasarRCM, WIRCivWestern India Regional Council of The Institute of Chartered Accountants of India
List of ContributorsCA Anant GovandeCA Alok JajodiaCA Dinesh Kumar TejwaniCA Mitesh KatiraReviewerCA Shirish PadeyWestern India Regional Council of The Institute of Chartered Accountants of Indiav
WESTERN INDIA REGIONAL COUNCIL OFTHE INSTITUTE OF CHARTERED ACCOUNTANTS OF INDIA2020-21ChairmanCA. Lalit BajajVice-ChairmanCA. Vishal DoshiSecretaryCA. Murtuza KachwalaTreasurerCA. Anand it KelkarArun AnandagiriChintan PatelHitesh PomalKamlesh SabooPriti SavlaSushrut ChitaleUmesh SharmaVimal AgrawalCA.CA.CA.CA.CA.CA.CA.CA.CA.Arpit KabraBalkishan AgarwalDrushti DesaiJayesh KalaManish GadiaShilpa ShinagareRakesh AlshiVikash JainYashwant KasarCA.CA.CA.CA.CA.Ex-Officio MembersCA. Nihar Jambusaria, Vice-President, ICAICA. Prafulla Chhajed, Past President, ICAIAniket TalatiCA. Anil BhandariChandrashekhar ChitaleCA. Dheeraj KhandelwalDurgesh KabraCA. Jay ChhairaNandkishore HegdeCA. Shriniwas JoshiTarun GhiaWestern India Regional Council of The Institute of Chartered Accountants of India
INDEXSr.No.1.2.3.4.ParticularsPg.No.Why Data Analytics1Some Important Terms2Types of Data Analytics5Users of Data Analytics7Data Analytics - Advantages8Data Analytics - Challenges8Data Analytics in Audit9Changing audit scenario- Requirement for Fraud reporting9Issues/challenges with the usage of Data Analytics in audit13Data Analytics in Other Finance Functions15Benchmarking15Management Information16Investor and Lender information17Tax Function17Financial Statement Analytics18Tools for Data Analysis20Data Smoothing/Transformation Tools20Data Analysis Tools21Visualisation tools24Western India Regional Council of The Institute of Chartered Accountants of Indiavii
Sr.No.5.6.7.viiiParticularsPg.No.Data Analytics: Current & Future Technology Trends27Algorithms28Artificial Intelligence (AI) and Machine Learning (ML)29Internet of Things (IoT)31Big Data Analytics with data mining32Blockchain33Future of Data Analytics using new-age technologies34Commonly used Statistical Models for Practical Data Analytics37Mean38Median38Mode39Standard Deviation40Correlation41Regression43Data Analytics Usage44Professional Firms44Finance professionals in the Industry45Finally A Word of Caution47Western India Regional Council of The Institute of Chartered Accountants of India
Overview of Data Analytics for Finance ProfessionalsWhy data analytics4Why Data AnalyticsIn today’s information age, data is everywhere and ever-increasing. We are leavingIndigitaltoday'sinformationdatais everywhereand ever‐increasing.footprintswhen weage,use theinternetright from desktops,laptops, mobilesWetowristbands!!areleaving digital footprints when we use the internet right fromTraditionallybusinesseshave beencapturing data from internal accounting, anddesktops,laptops,mobilesto wristbands!!operations like CRM, payroll, inventory. But in the digital age external data likewebsite traffic, social media feeds etc. have become equally critical.Traditionally businesses have been capturing data from internalIncreased datais operationsnot just limitedbusinesses;all inventory.government in thedigitaloffices, scientific research organisations and other arms of the modern society areagelike websitealsoexternallooking atdataever-increasingdata.traffic, social media feeds etc. havebecomeequallycritical.Data analyticscan bedefined as a science that analyses raw data to draw conclusionsabout the information contained therein.Increased data is not just limited to businesses; all government offices,defence offices, scientific research organisations and other arms of themodern society are also lookingat ever‐increasingdata. Accountants of India 1Western India RegionalCouncil of The Institute of CharteredData analytics can be defined as a science that analyses raw data to draw
Overview of Data Analytics for Finance ProfessionalsFor a chartered accountant, data analytics is a relatively new concept. To put it simply,data analytics enables an auditor to work on, assess, conclude, manipulate 100% ofdata, rather than just a sample of the population. However, the use is not just limitedto audit and assurance, as we see in the following chapters.Some Important TermsA.Database (DB): Data stored in a database is in the form of tables, consistingof rows and columns.B.Management Information Systems (MIS): Management Information Systemsare essentially Reports, designed to address standard and repetitive informationrequired periodically by management for decision making. MIS typically executepredefined queries on the database.C.Data Warehouse (DW): Data stored in a database in the form of tables,may then be moved to a Staging Area for transformation, and then to a DataWarehouse. Data stored in a Data Warehouse is in the form of virtual multidimensional cubes (not tables). Typically, data in a Data Warehouse is neverpurged, as the more the data, the better will be the understanding of hiddentrends, etc.D.E.F.2Artificial Intelligence (AI): Artificial intelligence is a technology which enablesa machine to simulate human behaviour. It is based on the experience of thetool, rather than being clearly programmed. So, unlike MIS, AI is expected togive answers to random questions on data.Machine Learning (ML): ML is also a subset of AI. Unlike BI, ML may be usedfor non-business purposes.Deep learning (DL): DL is a subset of ML, which imitates the working of thehuman brain without human supervision. It can process data and create patternssimilar to the human brain and use them in decision making. It is also known asneural learning, used for detecting objects, recognizing speech and translatinglanguage.Western India Regional Council of The Institute of Chartered Accountants of India
recognizing speech and translating language.Overview of Data Analytics for Finance ProfessionalsG.H.I.Business Intelligence (BI): BI is essentially a subset of AI. BI are the tools andthat make useof largedata atosubsetmake intelligentG. methodologiesBusiness Intelligence(BI):BI is businessessentiallyof AI. BIbusinessare thedecisions. BI uses past and present data to make better decisions for currentand methodologiesthat make use of large business data to isions.uses pastdatadatato makeBusinessAnalytics(BA):Business BIanalyticsuses andpast presentand presenttopredict future trends. BA tools are used to help make strategic decisionsbetter decisions for current business operations.regarding new market opportunities, improving customer relationships etc.Unlike BI which takes a thorough look at past, present data, BA engages humanintelligence and individual perspective to arrive at conclusions about the nextplan of action. BA has to do with viewpoints and foresight, and that can be veryH. subjective.Business Analytics (BA): Business analytics uses past and present datatopredict futuretrends.BA toolsusedto s act insightsand knowledgefrom structuredand customerunstructureddata,regardingnew y large data. Advanced Analytics is the autonomous or semi-autonomousexaminationor takescontentusing sophisticatedtechniquesanddata,tools,BAetc. Unlike ofBI datawhicha thoroughlook at past,presenttypically beyond BI and BA, to discover deeper insights, make predictions, orengagesrecommendations.human intelligence and individual perspective to arrive atgenerateExample: COMET Neowise was discovered by analysing data acquired by a spacetelescope.Western India Regional Council of The Institute of Chartered Accountants of India3
Overview of Data Analytics for Finance ProfessionalsJ. Big DataJ.Big DataThe termbigbigdatais isfrequentlyusedwhilewhiledescribingdata analytics.The termdatafrequently useddescribingdata analytics.So, what So,isdata?whatbigis bigdata?Big data deals with all kinds of data:Big data deals with all kinds of data: Structured data: data organised in a formatted database Unstructured data: data does not have a predefined data model. Examples:documents, images, videos, sensor data, audio, emails etc. Semi-structured data: mainly unorganised, but has some associatedinformation like metadata taggingAlthough big data doesn’t equate to any specific volume of data, big datadeployments often involve terabytes (TB), petabytes (PB) and even exabytes (EB)of data captured over time.Big data analytics can lead to positive business-related outcomes like:4 New revenue opportunities More effective marketing Better customer serviceWestern India Regional Council of The Institute of Chartered Accountants of India
Overview of Data Analytics for Finance Professionals Improved operational efficiency Competitive advantages over rivals9Types of Data Analyticsa. Descriptive Analyticsa.Descriptive AnalyticsThis is the mostof analyticsand dealsnumbers.It It providesThis basicis the typemost basictype of analyticsandwithdealswith numbers.‘whathappened’ byanalysingdata usingprovides ‘whathappened’by quantitativelyquantitativelyanalysingdata statisticalusing methods e.g.sum, mean, mode, percentage, frequency etc. Various revenue reports, KPIstatistical methodse.g.aresum,mean,frequency etc.Dashboardssomeof the mode,commonpercentage,examplesVarious revenue reports, KPI Dashboards are some of the commonb.Diagnostic Analyticsexamples Diagnostics tend to provide an answer as to ‘why it happened’. While arevenue report may show the actual figure of decline in sales over periods, theb. DiagnosticdiagnosticAnalyticsanalytics will look into the patterns and deviations to seek root causeanalysis and provide reasons for the decline in the sales. Diagnostics involve co-Diagnostics tendtotwoprovideandatasets.answer as to 'why it happened'. While arelatingdifferentrevenue report may show the actual figure of decline in sales overperiods, the diagnostic analytics will look into the patterns and deviationsto seek root cause analysis and Westernprovidereasons for the decline in theIndia Regional Council of The Institute of Chartered Accountants of Indiasales. Diagnostics involve co‐relating two different datasets.5
Overview of Data Analytics for Finance Professionalsc.Predictive AnalyticsPredictive analytics is concerned with the future and comes up with answers asto ‘what is likely to happen’. Businesses use this to predict the demand for theirproducts.While description analysis shows sales data over quarters/years, diagnosticanalytics provide the cause for decline/increase. Predictive analytics will co-relatethese data to external data like demographics to guess future sales.d.Prescriptive AnalyticsThis is the most advanced form of analytics and comes up withrecommendations as to ‘what action is to be taken’. This requires hugecomputing power as it tries to work out multiple scenarios, predict outcomesfor each such scenario and then recommend the best one. Artificial Intelligenceand Machine Learning use prescriptive analytics.ExamplesDescription AnalyticsMonthly State-wise sales during 2020-21 show salesdown24% during April-June,12% during July-Sept2% during Oct-DecDiagnostic AnalyticsLockdown caused by COVID-19 and consequent closureof retail outlets caused the declinePredictive AnalyticsWith lockdown relaxed and normal activity rebounding,sales during Quarter IV will be 5% higher than the sameduring LYPrescriptive AnalyticsShifting to a hybrid model of instore and online salemay result in an increase of 16% during 2021-22e.Exploratory and Confirmatory Data AnalyticsIn Exploratory data analytics, no clear hypothesis is stated before analysingthe data, and the data is searched for models that describe the data well.Exploratory data analytics starts by framing questions about what to do withdata and then finding out the best way to manipulate data to find the answers.This involves understanding data structure, identifying missing or erroneous data,establishing a margin of error and figuring out hypotheses.6Western India Regional Council of The Institute of Chartered Accountants of India
Overview of Data Analytics for Finance ProfessionalsConfirmatory data analytics, on the other hand, sets out to test the stated hypothesisusing statistical tools and conclude your findings.Users of Data Analyticsa.Businesses: Businesses are using data analytics to improve operations, andstrategize the future. Most modern e-commerce businesses are thriving onlybecause of advance usage of data analytics.Example: Netflix uses viewership data to recommend the shows you are likelyto be interested in. More than that, it can use these large data to create its owncontent and direct it to the target audience, virtually guaranteeing successb.Governments: Governments are using data analytics to predict major problemsand ta ke pre-emptive action before they turn into crises. The areas where theyare being put to use are natural calamities, defence, internal security, health careetc.Example: The Government of Indonesia uses sensors and public complaints topredict flood-prone areas and expedite response.c.d.Various scientific disciplines: Use of data analytics in scientific research cannotbe overemphasised. Few examples: Use of satellite imagery to analyse and predict climate modelsenvironmental changes Use of patient data to prevent epidemics, reduce healthcare cost, improvetimely healthcareTax Departments: World over, tax authorities are collecting more data, sharingdata among various other government departments and are using this bigdata to increase tax revenue, enforce compliance and bring transparency in taxadministration.In India, with the introduction of GST, an era of 100% digital tax has begun. Whatstarted as monthly online filings moved to e-way bills and online invoice upload inreal-time.Here are a few examples of how tax administration is using data analytics in India GST Department has a full network diagram of each assessee. This is madepossible by correlating information collated from income-tax and customs.This has made it possible to pinpoint firms who have resorted to fake billusage, even if they have resorted to a complex web of firms to route theseWestern India Regional Council of The Institute of Chartered Accountants of India7
Overview of Data Analytics for Finance Professionalstransactions. By Jan 2021, the department had detected over 7000 such casesof tax evasion via fake bills. The income tax department has started Project Insight and a dedicated centrecalled the Income Tax Transaction Analysis Centre (INTRAC). This centre usesdata analytics in improving tax administration. Among other things, this projectwill use social media data of taxpayers and analyse expenditure patterns. ThisRs. 1000 crore project is aimed at deterring non-compliance and improving taxcollections.Data Analytics - AdvantagesThe volumes, complexities and the variety of the data are increasing exponentially atall levels of the organisation. Analytics is the solution required to get the informationof this ever-growing data, and various benefits can be derived on revenue, expenses,market share, and reputation. Better decision-making. The biggest benefit of using data analytics is theassistance it can provide in better decision-making capabilities, thus betterenabling key strategic initiatives. Analytics plays an important role in drivingbusiness strategy.Marketing and customers. Data analytics assist in identifying and creatingnew product and service revenue streams. Marketing and sales groups invest inanalytics helping them to tap new geographies, develop new business models,and generate higher revenues.Data Analytics - ChallengesWhile there are huge benefits, the challenges in the implementation of analyticalsolutions are as follows: 8Overall business structure. Analytics is managed by a variety of functions withina company, and a wide range of functions benefit from analytics. More structurearound coordination and alignment is needed to realize the impact and benefitsof a company’s data throughout the organization. Sometimes a lot of projectsare done in silos by each function.Data management is a key barrier. A specific level of data management isrequired to make analytical projects successful. The GIGO principle applieseverywhere. To get the best out of the project, proper data mining and datawarehousing solution is required.Western India Regional Council of The Institute of Chartered Accountants of India
15Overview of Data Analytics for Finance ProfessionalsData Analytics in AuditData Analytics in AuditInInthiswe wediscusshowhowdata dataanalyticscan enhancethe qualityof thethischapter,chapter,discussanalyticscan enhancethe qualityaudit, save time and enable the auditor to gain new insights. Data analytics is notthe audit,time auditingand enablethe auditor to gain new insights. Datamandatoryas saveper currentstandards.ofanalytics is not mandatory as per current auditing standards.Changing audit scenario- Requirement for Fraud reportingSection 143(12) of the Companies Act, 2013 requires the auditor to report frauds/suspected frauds discovered during the audit to the Central Government (in case theamount involved is greater than Rs 1 crore) and to the Board/audit committee in caseof frauds of lesser amounts. The auditor has to actively plan the audit proceduresto complywith 143(12)these reportingthe expectationsfromauditorauditors toSectionof therequirements.Companies Thus,Act, 2013requires thehave increased significantly. Most large frauds involve senior management and thereportfrauds/duringcollusionthe auditto thestatutoryauditoris not suspectedin a positionfraudsto easilydiscoveredfind the fraudulentbetweenseniorCentralmanagementand third (inparties.help theisauditorto thanmeet reatersuch growing expectations from the audit.crore) and to the Board/ audit committee in case of frauds of lesseramounts. The auditor has to actively plan the audit procedures toWestern India Regional Council of The Institute of Chartered Accountants of India9comply with these reporting requirements. Thus, the expectationsfrom auditors have increased significantly. Most large frauds involve1
Overview of Data Analytics for Finance ProfessionalsThe increasing role of ERP systemsModern integrated computer systems are implemented across the organization.Financial transactions are generated not just by the accounting team, but automaticallyby each operating unit in the company during the course of their day-to-day activities.Such large enterprise resource planning (ERP) systems are expected to have built-inchecks and controls to ensure the accuracy of the data. For example, it may not bepossible to create an invoice from the ERP system unless there is adequate inventoryin the system for the respective item. ERP systems are also expected to allow granularsegregation of duties and have strong access controls and authorisation. This canenhance the quality of the data generated by the ERP system and make it morereliable. If the General Information Technology Controls (GITC) have passed the testsfor design effectiveness and operating effectiveness for the period under audit, andif the automated controls, automated accounting procedures have been properlyconfigured and controlled, the auditor can place a high degree of reliance on theoutput of such ERP systems.But at the same time, ERP systems tend to increase the complexity in the transactionsflow. The auditor has to understand the ERP transactions and controls to identify risksof material misstatements. It may not be possible to have a paper trail of approvalsand authorisations. Controls compromised, especially cases of Management Overrideof Controls, cannot be identified easily by sample-based audit.Data analytics enables the auditor to analyse the complete data set- 100% of thetransactions in a given period. After some initial training, even non-technical personscan use the data analytics software to visualize the results graphically and identifyanomalies for further investigation.A word of caution, however, raised by some professional bodies globally, is that BigData could result in Auditors becoming less independent and objective (Institute ofChartered Accountants of England and Wales)Evolution of CAATs into advanced Data AnalyticsComputer Assisted Audit Techniques (CAATs) are used by auditors to query the dataand find patterns or anomalies in it. Specialized software can be used to extract andsort data, summarise and stratify it. Data Analytics is, of course, “computer-assisted”.The massive increase in available computing power and better software to handleBig Data has led to the evolution of CAATs into Data Analytics. Data Analytics goesmuch beyond CAATs. Data analytics can harness the organisation’s semi-structuredand unstructured data as well, which is often much bigger than the structured dataof financial accounting systems. Data analytics enables the auditor to make moreeffective use of visualization techniques for meeting the audit objectives.10Western India Regional Council of The Institute of Chartered Accountants of India
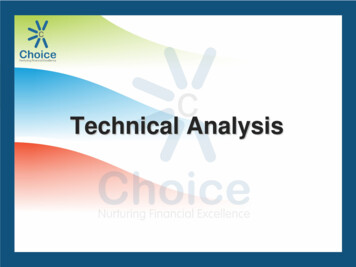
Overview of Data Analytics for Finance ProfessionalsA few major types of analyses that can be performed using data analytics software As the number of transactions and size of data increases, it becomes increasinglydifficult to perform traditional procedures such as Ledger Scrutiny. Appropriatecriteria can be defined to identify non-standard entries, considering the conceptsof Ledger Scrutiny for relevant accounts, based on risk assessment.e.g. - oAccounts used infrequentlyoAn unusual combination of accountsoDebit Cash, Credit RevenueoEntered and approved by the same personoPersons passing entries, outside their functionoUnusual time, holidays etc.oAmounts having round numbers or same ending numbersoSmall value but many entriesoAccounts having significant estimates or period-end adjustmentsoAccounts identified with the risk of material misstatementoEntries passed after the closure of monthsDuplicate analysis and gap analysis: This can be performed on data such asinvoice numbers or bank transactions. The software can easily detect duplicateinvoices or missing dates in the bank statement. It can also be used to findduplicate payments to vendors.Trend analysis: This involves a comparison of current period values withthe corresponding values of one or more previous periods. Using visualrepresentation, trend analysis can bring out significant patterns in the data.For example, this chart shows the trend analysis of sales to related parties by acompany in two financial years. The auditor can do trend analysis and plot thetrend line. This can highlight the outliers from the trend line which can be takenup for further scrutiny.Western India Regional Council of The Institute of Chartered Accountants of India11
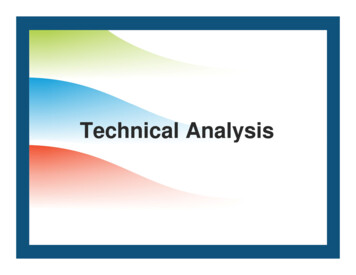
Overview of Data Analytics for Finance Professionals1919However, when the same data is presented visually in a differentHowever,samedatais presentedvisuallyvisuallyin a differentway, it canway,it r,whenthesamedatais presentedin a differentbring out some interesting patternsway, it can bring out some interesting patterns‐In this second chart, it appears that in quarter‐end months (June,September,DecemberMarch),sale to relatedpartiesinIn this secondchart, itandappearsthatthein ilofTheInstituteofCharteredAccountantsofIndia12 the current year is much higher than the corresponding values ofSeptember, December and March), the sale to related parties intheyear.isInmuchotherhighermonthsof the year,the sales tothepreviouscurrent yearthancorrespondingvalues of
Overview of Data Analytics for Finance ProfessionalsIn this second chart, it appears that in quarter-end months (June, September,December and March), the sale to related parties in the current year is muchhigher than the corresponding values of the previous year. In other months ofthe year, the sales to related parties are lower than corresponding values of theprevious year. If this company is required to disclose
Big Data Analytics with data mining 32 Blockchain 33 Future of Data Analytics using new-age technologies 34 6. Commonly used Statistical M odels for Practical Data Analytics 37 Mean 38 Median 38 Mode 39 Standard Deviation 40 Correlation 41 Regression 43 7. Data Analytics Usage 44 Profe