Transcription
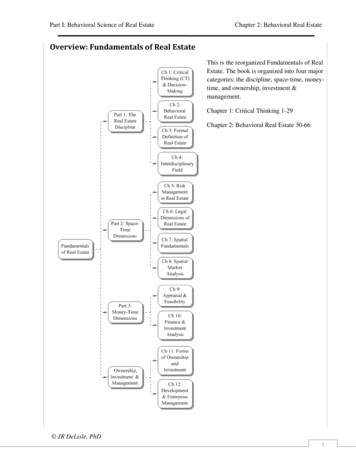
Trinocular Stereo: a Real-Time Algorithm and its EvaluationJane MulliganDept. of Computer ScienceUniversity of Colorado at Boulderjanem@cs.colorado.eduVolkan Isler and Kostas DaniilidisUniversity of Pennsylvania GRASP actuser as if he were looking through a window into the remote scene.In telepresence applications each user is immersed in arendered 3D-world composed from representations transmitted from remote sites. The challenge is to compute denserange data at high frame rates, since participants cannoteasily communicate if the processing cycle or network latencies are long. Moreover, errors in new stereoscopicviews of the remote 3D-world should be hardly perceptible.To achieve the required speed and accuracy, we use trinocular stereo, a matching algorithm based on the sum of modified normalized cross-correlations, and subpixel disparityinterpolation. To increase speed we use Intel IPL functions in the pre-processing steps of background subtractionand image rectification as well as a four-processor parallelization. To evaluate our system we have developed a testbed which provides a set of registered dense “ground-truth”laser data and image data from multiple views.Figure 1. A local user on the left shares thesame environment with a remote user on theright. A 3D description of the remote environment is projected stereoscopically on thescreen from the viewpoint of the local user.1 IntroductionThe power of today’s general purpose and graphics processors and the high bandwidth of the recent Internet generations provide the necessary infrastructure for tele-presencesystems. In this paper we describe the computer vision partof the realization of a new medium called tele-immersion.Tele-immersion enables users in physically remote spacesto collaborate in a shared space that mixes the local withthe remote realities [10, 22]. An example of a tele-presencesystem [16] illustrated in Figure 1 brings two users from remote places to the “same” table. A real-time multiple viewstereo reconstruction of a remote person is transmitted to thelocal site, combined with a stored off-line 3D-backgroundand projected with stereoscopic projectors. The user wearspolarized glasses and a 6-DOF head-tracker. The remotescene is always projected from the viewpoint of the localFirst attempts to realize immersive tele-presence involved slave stereo cameras that moved according to thelocal master’s head and obtained a stereo-pair from the correct viewpoint. This view-dependent solution is impossible in a multi-user networked environment subject to latencies. In this paper, we address view-independent reconstruction from stereo in the context of tele-presence as describedabove. Having acquired a scene snapshot at a remote sitewe transmit it represented with respect to a world coordinate system. Displaying the 3D scene snapshot from a newpoint of view involves only primitive transformations hardwired in every graphics processor. In addition to real timeresponse, the user should not experience depth distortionor outliers through her polarized stereo glasses. The basicquestion is how to achieve a perceptually best reconstruction in real-time.The dense trinocular stereo algorithm we propose hereis based on the maximization of a computationally expen- This work has been supported by NSF IIS-0083209, NSF IIS0099201, NSF CDS-97-03220, ARO/MURI DAAH04-96-1-0007, PennResearch Foundation, and Advanced Network and Services.1
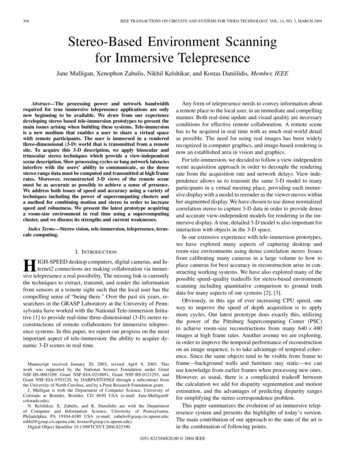
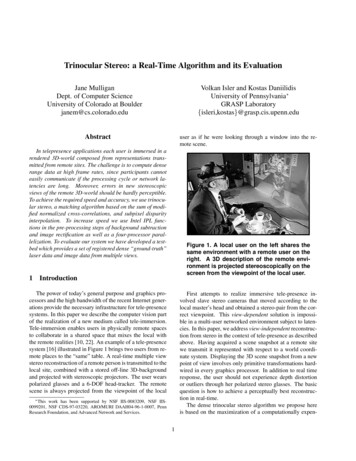
sive correlation measure summed over the centre-right andthe centre-left rectified image pairs. For the sake of speed,no ordering constraint is considered and there is no specialhandling of occlusions or specularities. Integer disparitiesare interpolated to obtain a subpixel estimate. Median filtering of the disparity map eliminates most of the outliers.Disparities can be filtered subject to the correlation value(goodness of fit) or the image gradient (matching feasibility). Two trinocular camera configurations are supported:an inline non-parallel triple and an L-shaped triple.The second contribution of this paper is the evaluationof our results. We first introduced our performance metrics in [17]. Here, we present results on a new data-setof trinocular imagery and registered laser range data. Twometrics are introduced for evaluation: The first metric isstill the classical view-independent world-centred nearestneighbour depth difference, which is critical to the performance of tele-collaboration systems where users interact with virtual 3D-objects whose visibility and collisionswith the “real” scene must be monitored. The second error metric uses the imaging relationship to associate stereoand ground truth data. We compute the distance betweena ground truth point which projects to an image pixel andthe stereo depth point computed from the same pixel. Suchdepth errors along the viewing rays become obvious as newviews are rendered according to the user’s head motion. Weuse these metrics to compare the performance of our twotrinocular configurations as well as examining the effectsof correlation score, spatial gradient and median filtering asmatch quality metrics for our system.In the next section we review the related work. Thenwe present a system overview and finally we describe theperformance evaluation.based techniques like space-carving [9, 24, 14, 5, 25]. Theprocessing is off-line and in this sense there is no indicationof how it could be used in telepresence beyond the off-linereconstruction of static structures.Recently a number of authors have taken up the taskof rigorous evaluation and comparison of stereo systems.Szeliski [26, 27] has proposed an evaluation method basedon the discrepancy in intensities between a novel view andthe reference view warped according to the computed stereodepth. The method is mainly applied to motion sequenceswhere the novel view is a real image. In our case the novelviews are arbitrary and for this reason we need ground truthto evaluate the warped reference appearance.Leclerc et al. [11] introduced the notion of selfconsistency. Again, the views checked for consistency arefrom the set used for computation and they can definitelynot cover the viewing volume of a user in a tele-presenceenvironment. However, like [26] it is a truthful measure ifwe do not have access to any ground-truth.Banks and Corke [2] evaluate several dense correlationand nonparametric similarity measures as well as match validity measures commonly used to select valid correspondence. In the absence of ground truth, similarity measuresare compared based on the percentage of computed disparities which pass the left-right consistency check, which generally identifies unreliable disparities due to half occlusionsin the scene. Other validity measures addressed include image gradient (texture), match score, and locally anomalousmatches. These measures are shown to have considerableoverlap in the matches rejected.Scharstein et al. [23] also evaluate dense binocular stereosystems, but they use a collection of image datasets withground truth, as we do. They propose two quality measures:RMS disparity error with respect to the ground truth dataand a percentage of bad matches, based on a disparity errorthreshold of 1 pixel. These are computed over the entire image as well as in regions identified as textureless, occludedor in the neighbourhood of a discontinuity.2 Related WorkWe will not review the huge number of existing papers(see the annual bibliographies by Azriel Rosenfeld) on allaspects of stereo (the reader is referred to a standard review[6]). Application of stereo to image based rendering is verywell discussed and reviewed in the paper by Narayanan andKanade [18]. Stereo approaches may be classified with respect to the matching as well as with respect to the reconstruction scheme. Regarding matching we differentiate between sparse feature based reconstructions (see treatise in[7]) and dense depth reconstructions [20, 18]. Approachessuch as [4, 28] address the probabilistic nature of matchingwith particular emphasis on the occlusion problem. Areabased approaches [13] are based on correlation and emphasize real-time responsiveness as we do. An approach withemphasis on virtualized reality is [18]. This system captures the action of a person from a dome of 51 cameras.Surround camera clusters are also very suitable for voxel-3 System’s Overview and AlgorithmFor depth reconstruction, a cluster of 5 firewire cameras(Fig. 2) are arranged on an arc at 10 separation to ‘surround’ the user and prevent any break of presence due toa hard edge where the reconstruction stops. These cameras are used to calculate trinocular stereo depth maps fromoverlapping triples. For example the combined trinocularreconstruction illustrated in Figure 5, was computed from 3triples hC0 , C1 , C2 i, hC1 , C2 , C3 i, and hC2 , C3 , C4 i.Both responsiveness and quality of depth data are criticalfor immersive applications. In order improve the frame rateof our system we have applied a number of techniques toreduce the weight of calculation, particularly in the expen2
Figure 2. Camera configuration, user view.sive correlation matching required to generate dense depthmaps. The simplest technique for the developer of course,is to purchase more and faster computers. We have builtour system on 5 quad PIII 550 MHz servers (one for eachreconstructed view) and parallelized our code accordingly.One of the servers acts as a trigger server for the firewireacquisition. When all of the reconstructors are ready forthe next frame the trigger server triggers all of the cameras simultaneously. Each computer grabs the image from1 camera and transmits and receives the images needed byits neighbours and itself. Within each quad machine the images are divided into 4 equal bands and each processor isdevoted to a particular band. The thread for each processorrectifies, background subtracts, matches, median filters thedisparities and reconstructs points in its band of the image.When all processors have completed processing the textureand depth map are transmitted via TCP/IP to a remote renderer. This data is encoded as 3-(320 240) unsigned charimage planes (RGB) of texture, plus one unsigned short image plane where 1/z values have been scaled into unsignedshort, and background and unmatched foreground pixels areflagged. The total is about 3 Mbits per view per frame.Figure 3. Background image, foreground image and subtracted result.use T 7). These thresholded difference images are quitenoisy. A series of erosions and dilations is performed on IBin order to sharpen the background mask. The morphological operations are implemented by IPL separable convolutions. Typical results are illustrated in Figure 3.3.2 Matching MetricIn our efforts to maintain speed and quality in densestereo depth maps we have examined a number of correlation correspondence techniques. We have concluded thatthe depth quality of trinocular Modified Normalized CrossCorrelation (MNCC) is necessary to our application.The reconstruction algorithm begins by grabbing imagesfrom 3 strongly calibrated cameras. The system rectifies theimages so that their epipolar lines lie along the horizontalimage rows so that corresponding points lie on the same image lines, thus simplifying the search for correspondences.The modified normalized cross-correlation (MNCC) correspondence metric is:3.1 Background Subtraction2 cov(IL , IR )corrMNCC (IL , IR ) 2.σ (IL ) σ 2 (IR )Our expectation for tele-immersion is that the workspacewill contain a person in the foreground interacting with remote users, and a background scene which will remain moreor less constant for the duration of a session. To obtain thespeed and quality of depth points our application requires,we reconstruct the background scene in advance of the session and transmit it once to the remote sites. While the usermoves in the foreground during a session, we need a methodto segment out the static parts of the scene. We have chosento implement a background subtraction method similar tothat proposed by Martins et al. [12].A sequence of N (2 or more) background images Bi areacquired in advance of each session. From this set wePcompute a pixelwise average background image B N1 i Bi .We then compute thePaverage pixelwise difference betweenB and Bi , D N1 i (B Bi ).During a tele-immersion session each primary image Iis subtracted from the static mean background ID B I,a binary image is formed via the comparison IB ID T D where T is a configurable threshold (generally we(1)where IL and IR are the left and right rectified images overthe selected correlation windows.For each pixel (u, v) in the left image, MNCC producesa correlation profile c(u, v, d) where disparity d ranges overacceptable integer values. Selected matches are maximain this profile, which satisfy various ‘peak’ characteristics.Parabola fitting on the correlation profile is used to identifythe subpixel peak location and calculate the subpixel disparity adjustment.3.3 Trinocular StereoThe trifocal constraint is a well known technique to refine or verify correspondences and improve the quality ofstereo range data. It is based on the fact that for a hypothesized match [u, v, d] in a pair of images, there is a uniquelocation we can predict in the third camera image where we3
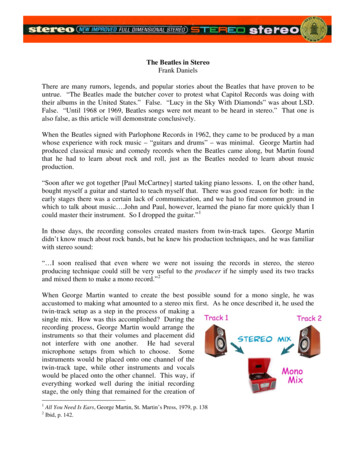
Figure 4. Five camera views.Pixelwise Trinocular Stereoexpect to find evidence of the same world point [6]. A hypothesis is correct if the epipolar lines for the original point[u, v] and the hypothesized match [u d, v], intersect in thethird camera image. The most common scheme for exploiting this constraint is to arrange the camera triple in a rightangle (or L-shape), allowing matching along the rows andcolumns of the reference image [19, 1, 8].Our initial telecubicle configuration, illustrated in Figure 2, placed cameras on an arc surrounding the user atthe same level. This does not allow us to arrange or rectify triples of camera image planes such that they are coplanar, and therefore it is more expensive for us to exploit thetrinocular constraint.Following Okutomi and Kanade’s observation [21], weoptimize over the sum of correlation values with respect tothe true depth value rather than disparity. Essentially wetreat the camera triple hL, C, Ri as two independent stereopairs hL, CL i and hCR , Ri.When revising our system design to parallelize and improve its speed, we discovered that by using foreground segmentation we need consider only one half to one third ofthe pixels in the reference image CR . This makes it feasible to calculate the entire correlation profile for each pixelone at a time. To calculate the sum of correlation scoreswe precompute a lookup table of the location (uCL , vCL )in CL corresponding the current pixel in CR (based on theright-left rectification relationship). We also compute a linear approximation for the disparity dcL M (uCR , vCR ) dR b(uCR , vCR ) at [uCL , vCL ] which arises from thesame depth point as [uCR , vCR , dR ]. The maximum errorin dcL for our surround configurations and disparity rangesof dR [ 100, 100] is on the order of 10 13 . As we calculate the correlation score corrR (uCR , vCR , dR ), we lookup the corresponding [uCL , vCL ] and compute dcL , then calcculate the correlation score corrL (uCL , vCL , dL ). We selectthe disparity dR which optimizesStep 1: Precompute lookup table for CL locationscorresponding to CR locations, and dL approximation lookup tables M and bStep 2: Acquire image triple hL, C, RiStep 3: Rectify hL, CL i and hCR , Ri independently.Step 4: Calculate foreground mask for CR and RStep 5: For every foreground pixel CRmask (u, v)Step I: For every disparity dR DrIf Rmask (u dR , v) foregroundStep i: compute corrR (uCR , vCR , dR )Step ii: lookup [uCL , vCL ]Step iii: compute dcL M (uCR , vCR ) dR b(uCR , vCR )Step iv: compute corrL (uCL , vCL , dcL)Step v: corrT corrL corrRStep vi: If corrT is a peakStep 1: Fit parabola to find subpixel correlation peak and disparity adjustment dadjStep 2: Update corrbest corrT ,dbest dR dadjStep 6: Goto 23.3.1 L-ShapeWe have implemented an algorithm for L-configurations totest its properties versus our existing system. We rectify thetriple such that the upper (U) and lower-left (L) images arecolumn aligned and simultaneously the left and right (R)images are row aligned. No explicit relationship is enforcedbetween the upper and right images as in [1] because it introduces too much distortion for dense correlation stereomethods. The immediate advantage is that only 3 rectifications are required. Further, in the pixelwise approach, thereis no need to lookup the centre-left index. However traversing the left image columnwise is less efficient in terms ofmemory access than row traversal. The algorithm otherwiseproceeds as above, computing the maximum sum of MNCCcorrT corrL (uCL , vCL , dcL ) corrR (uCR , vCR , dR )The method can be summarized as follows:4
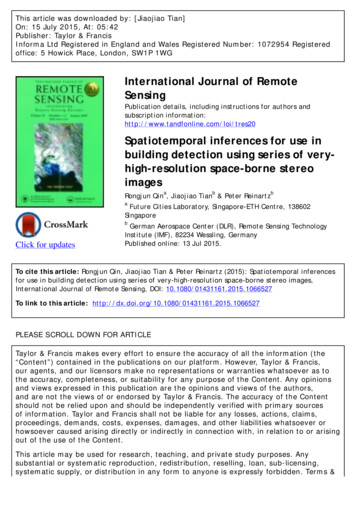
correlations over the disparity range for each pixel. Again alinear approximation for the corresponding upper disparityis calculated, given the lower disparity and the current pixellocation.An added challenge with our five camera cluster is thecombination of multiple reconstructions into a single rendered view. We currently depend on the accuracy of ourcalibration to a common reference frame for all cameras.Figure 4 shows a set of camera views for a single framein the current telecubicle camera cluster. From this im-a.b.Figure 6. Experimental Setup: a) Buffalo Billstatue, scanner head and camera cluster, b)3D target for coordinate frame registration.travels around the subject to be scanned in a 360 circle. Itcaptures a cylinder of range values about 30 cm in heightand 40-50 cm in diameter (sampling pitch θ 1 mm, y 700 um, z 100 um). We have therefore been limited toground truth for the head of the statue only, although ourcamera images have a somewhat larger field of view. Images were captured using Sony DFW-V500 Firewire cameras connected to a Matrox Meteor II/1394 capture card.To achieve registration of the laser and stereo coordinateframes we developed a 3D target with 3 planar surfaces (illustrated in Figure 6b). Calibration patterns with distinctcoded targets are attached to each plane. The planes are notorthogonal because our calibration algorithm cannot extractthe visible targets if they are too distorted. Each time thecameras were reconfigured the 3D target was placed in theworkspace and a laser scan performed. Without moving thetarget, a set of images was captured. A separate calibration process was performed for the intrinsics and extrinsicsof the cameras only. To register the 3D frames the visible targets were extracted for all camera views. The corresponding target points were reconstructed in the stereoframe from all pairs of cameras. The target points associated with each 3D target plane were used to estimate theequation of the plane in camera space nCi x dCi 0.Similarly a subset of points belonging to each plane wasextracted (by hand) from the scanner data, and the planeequations estimated (nSi x dSi 0). We compose thematrices NC [nC1 nC2 nC3 ] and NS [nS1 nS2 nS3 ].We can then calculate the laser to camera transformationTSC [RSC tSC ] by estimating the closest rotation matrix RSC satisfying NC RSC NS . This is given byU V T where U, V are the left and right singular vector matrices of NC NS 1 . The translation can then be computedtSC NC 1 [dC1 dS1 , dC2 dS2 , dC3 dS3 ]T .The data set acquisition proceeded as follows:Figure 5. Three trinocular reconstructionscombined and rendered, rotated view.age set 3 reconstructed views are calculated for overlappingtriples. Figure 5 shows a profile rotation of the total set of104,350 depth points calculated using trinocular MNCC forthe frame in Figure 4.4 ExperimentsA number of recent papers [23, 2, 26, 27] have addressedthe problem of evaluating and comparing dense stereo techniques. These authors propose metrics for evaluation, andemphasize problem areas for stereo, including occlusionand lack of texture. They also examine various matchvalidity measures such as correlation score, spatial gradient and left-right checks. Most agree that comparison toground truth is the gold standard of such evaluations. Trueground truth is very difficult to obtain, but we have deviseda method to acquire registered dense depth data of the samescenes we reconstruct by using a CyberWare Laser Scanner(http://cyberware.com/). The experimental setup is picturedin Figure 6. The acquired object is a concrete statue ofBuffalo Bill smoking a cigar. Since the capture process requires a completely static scene through one or two imagegrab cycles and a laser scan (about 1 minute) no live subject was suitable. The Cyberware Head and Face 3D ColorScanner (Model 3030) has a motorized scanner head which the camera rig was configured. a sequence of camera calibration images was captured the 3D calibration images and laser scan were captured for each object data set:5
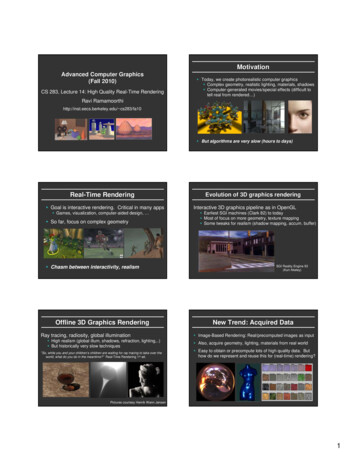
Figure 7. Trinocular triple camera views and laser data.points sorted according to the goodness of matching givenby a match validity metric such as MNCC correlation score.The dependence on the image gradient was studied in [17].In Fig. 9 we show the reconstruction profiles for densities of 100% and 90% (1st-3rd and 2nd-4th respectively),and excluding, for the sake of visualization, fully or halfoccluded points (1st-2nd and 3rd-4th image, respectively).By fully occluded points we mean the model points whichwhen projected are occluded in both centre and right rectified images. By half-occluded points we mean the modelpoints which when projected are visible only in the centreimage. As we will also observe in later plots, the majorityof the outliers lie in the 10% tail of the density distributionand therefore the 90%-density profiles are “cleaner”. Asexpected, when we do not show the fully occluded points(1st/2nd images) we obtain reconstructions with more holesbut less outliers.Recent work on evaluation of stereo methods has mainlyaddressed binocular algorithms. Scharstein et al. [23] usepercentage of points with disparity error less than 1, withrespect to ground truth, as a quality metric for stereo. Theyalso look at RMS disparity error. We use a trinocular stereomethod in an effort to improve the quality of our depthmaps. Figure 10 shows correlation score based density plotsfor a binocular MNCC stereo algorithm versus the trinocular system we describe. RMS absolute disparity differencefor corresponding percentiles of points included is consistently lower for the trinocular system. Using Scharstein’smetrics, the inline triple has 59.9% valid points (RMS disparity error 3.7 pix), while the L-shape has 69.7% validdisparities (RMS disparity error 5.4 pix). The binocularmethod had 59.8% valid disparities (RMS disparity error2.3 pix), which is very similar to the trinocular method.The density plot illustrates this for the 100% included case,however it also demonstrates that trinocular sum of correlation values are more robust for eliminating bad matchesthan binocular.Fig. 11 shows the difference between an inline and an Lshaped triple reconstruction. The L-shaped set-up exhibitsmore holes due to the nature of the occlusions in the particular statue: The probability that a point becomes half-Figure 8. Disparity maps for inline and Lshape trinocular triples.– the statue was positioned in the workspace– the images were captured– the laser scan was captured.The registered data used in our experiments is illustratedin Figure 7. We computed the disparity maps illustratedin Figure 8 using our inline triple and L-shape trinocularstereo algorithms. The value of ground truth registered datais that it allows us to identify error sources and comparevarious instantiations of stereo reconstruction. In this paperwe examine the errors arising due to occlusions in the sceneand we compare the L-cluster to the inline cluster.A somewhat subtle issue in looking at the ground truthdata is how to identify “correspondences” between the laserand stereo data. One possibility is to associate each reconstructed point with the nearest laser point in 3D. This allowsoutliers to be associated with depth points that did not generate them, but all stereo points are accounted for. A secondpossibility is to project the laser points into the image andassociate the stereo point arising from a pixel with the nearest laser point which also projects to the pixel. We illustrateboth approaches in the plots below.To illustrate the effects of various parameters and thresholds on the performance of algorithms with respect toground truth error, we evaluate error at various levels of output density as proposed by Barron and Beauchemin [3]. Byn% disparity density we denote the highest n% of image6
Figure 9. Reconstruction profiles: The first image shows a profile for 100% density without pointsoccluded in the centre and the right original images, the second image shows a profile for 90% densitywithout points occluded in the centre and the right original images, the third image shows a profilefor 100% density without half-occluded points, and the fourth image shows a profile for 90% densitywithout half-occluded points.Correlation Based Densityquality. We plot the proportion of points included by a correlation threshold against the root mean squared (Fig. 12a,b) and median (Fig. 12 c,d ) distance between corresponding laser and stereo points for both the inline and L configurations. The errors are calculated for the indicated proportion of points retained by fixing a threshold on the correlation score (ie. we calculate correlation thresholds whichgive us 20%, 30%, 40% etc of the data, then calculate theerror metric for points which satisfy the threshold). Overall the median errors of 2–4mm are reasonable given theconfiguration of the rigs and the limits on ground truth registration. The L-shape reconstruction has consistently, ifslightly lower median error, while its RMS error is higherthan the inline configuration for higher percentages of included points. The RMS plots seem to suggest more outliers for the L-shape, but more systematic error for the inline configuration. The viewing ray (VR) correspondencemethod (12 b,d), gives higher error measures than NearestNeighbour (NN) (12 a,c), probably because the ground truthregistration was calculated using Euclidean distance.RMS Abs Disparity Error 1Proportion IncludedFigure 10. Correlation score based densityplots for binocular and trinocular stereo.occluded when adding a third camera in the vertical direction is higher than a when adding a camera in the horizontaldirection.Texture is crucial to correlation matching. In addition tocorrelation score, we can attempt to eliminate poor matchesin low texture areas by examining the spatial gradient. Figure 13’s density plots illustrate the effectiveness of usingthe spatial gradient for the RMS nearest neighbour distancemetric. The effect on the RMS error is small until 90%of points are eliminated, when the error shoots up. This isprobably the result of occlusion boundaries with high texture, and high uncertainty.Figure 11. The reconstruction profiles for 90%depth density for an inline(left) and an Lshaped (right) configuration, respectively.In their evaluation of stereo techniques, Banks andCorke [2] also look at means of identifying locally anomalous disparities. In our system we select matches based onthe difference between the computed disparity and the median of its neighbours. Figure 14 illustrates density plotsusing the absolute difference between the disparity at eachlocation and the median of its neighbours. Varying the me-Figure 12 uses density plots to demonstrate the relevanceof correlation scores and occluded points in reconstruction7
Correlation Based DensityCorrelation Based Density12Median Filter Difference Based Density25101199L shape Triple8765NN RMS Distance (mm)20VR RMS Distance (mm)NN RMS Distance (mm)1015Inline Triple1045L shape TripleInline oportion Included0.40.60.70.80.9b.Correlation Based Density654Inline Triple3L shape Triple20Correlation Based Density371Proportion Includeda.0.1Inline Triple0.3VR Median Distance (mm)2.42.22L shape 100.10.2Proportion Included0.3Intensity Based Prediction Error0.40.50.60.70.80.9301Proportion Includedc.d.25StereoRMS Intensity Error0.20.5Figure 14. Median filter difference based density plots for the inline and L-shape triple configurations.4L shape Triple0.10.4Proportion IncludedInline Triple2.61.600.24.52.8NN Median Distance (mm)0.58Figure 12. Root mean squared and median 3Ddistance between corresponding points vs.output densities obtained from descendingcorrelation thresholds for inline triple and Lshape reconstructions. a) RMS 3D differencebetween nearest neighbours(NN), b) RMS 3Ddifference between points along the sameviewing ray(VR), c) median 3D difference between nearest neighbours(NN), d) median 3Ddifference between points along the sameviewing ray(VR).201510Laser50 2 1012CameraFigure 15. RMS intensity error for images fromcameras -2 to 2, warped to the reference image from camera 0, according to the reconstructed depth data for the inline reconstruction.Spatial Gradient Based Density30We can see that the reference image (0) has essentially zeroerror. For the non-reference views, the error climbs to about15 and for two unrelated views we see RMS error of about28 intensity levels. The dashed curve plots the ground truthdata used to warp the reference image into novel views.Again the error for the reference view is essentially zero,however the prediction error in novel views is still significant. It would appear that for our
the remote realities [10, 22]. An example of a tele-presence system [16] illustrated in Figure 1 brings two users from re-mote places to the “same” table. A real-time multiple view stereo reconstruction of a remote person is transmitted to the local site, combined with a stored off-line