Transcription
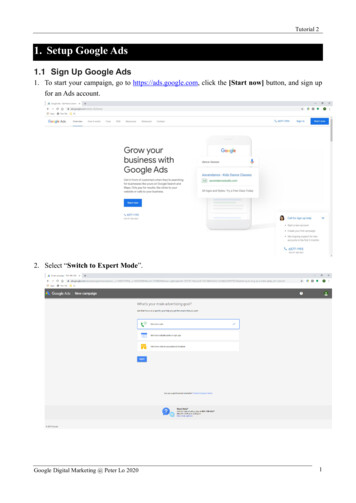
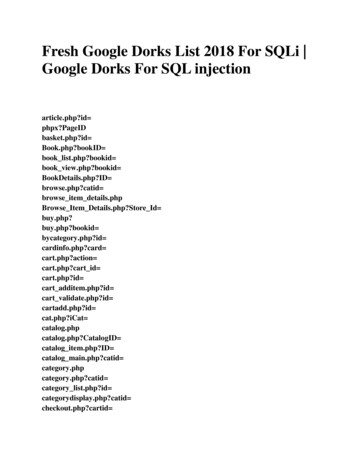
Tutorial 1Setup Google Analytics1.1 Sign Up Google Analytics1. Once you have a Google account, you can go to Google Analytics (https://analytics.google.com)and click the Sign into Google Analytics button. You will then be greeted with the three stepsyou must take to set up Google Analytics.Google Digital Marketing @ Peter Lo 20201
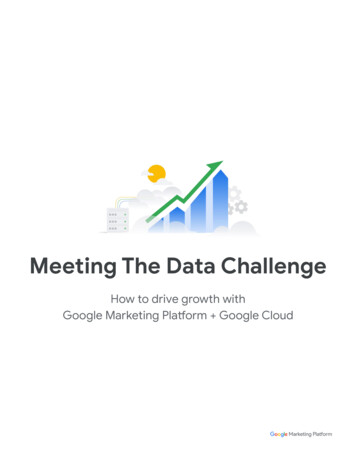
Tutorial 12. Input the account name and press [Next] button.Google Digital Marketing @ Peter Lo 20202
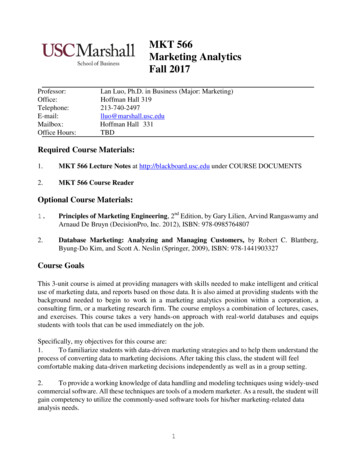
Tutorial 13. Define what do you want to measure, web? Apps? Or both? Then press [Next] button tocontinue.Google Digital Marketing @ Peter Lo 20203
Tutorial 14. Input the website address and provide a unique name for identification.5. Input the property name, select the category, and define the time zone. Then press [Create]button to create the account.Google Digital Marketing @ Peter Lo 20204
Tutorial 16. Review and agree the terms and condition from Google.7. Then you will enter the Google Analytics main panel, you can get the Tracking Code after setupthe data stream.Google Digital Marketing @ Peter Lo 20205
Tutorial 11.2 Install Tracking Code1. Select “Admin”, Then select Property User Management Tracking CodeGoogle Digital Marketing @ Peter Lo 20206
Tutorial 12. This must be installed on every page on your website. The installation will depend on what typeof website you have.Google Digital Marketing @ Peter Lo 20207
Tutorial 13. Sample of the embedded code in web site1.3 Set Up Goals1. After you install your tracking code on your website, you will want to configure a small settingin your website's profile on Google Analytics. In e-commerce, these are generally 3 things: Did the visitor search for something? Did they add it to their cart? Did they buy it?This is your Goals setting. You can find it by clicking on the Admin link at the top of yourGoogle Analytics and then clicking on Goals under your website's View columnGoogle Digital Marketing @ Peter Lo 20208
Tutorial 12. Goals will tell Google Analytics when something important has happened on your website. Forexample, if you have a website where you generate leads through a contact form, you will wantto find a thank you page that visitors end upon once they have submitted their contactinformation. Or, if you have a website where you sell products, you will want to find a finalthank you or confirmation page for visitors to land upon once they have completed a purchase.3. You will name your goal something you will remember, select Type, and then click the [NextStep] button.Google Digital Marketing @ Peter Lo 20209
Tutorial 14. You will then toggle the value and enter a specific dollar value for that conversion (if applicable)and click [Create Goal] to complete the setup.If you have other similar goals / conversions you would like to track on your website, you canfollow these steps again. You can create up to 20 goals on your website. Be sure that the onesyou create are highly important to your business. These goals (for most businesses) include leadform submissions, email list sign ups, and purchase completions. Depending on your websiteand its purpose, your goals may vary.1.4 Setup Site Search1. To enable site search analysis, go to Google Analytics Admin menu again, and in the Viewcolumn, click on View Settings.Google Digital Marketing @ Peter Lo 202010
Tutorial 12. Scroll down until you see Site Settings and toggle it to [On]. Look back at your URL for yoursearch results. Enter the query parameter (usually s or q) and click [Save]. This will allowGoogle Analytics to track any searches made on your website so you can learn more about whatyour visitors are looking for on specific pages.Google Digital Marketing @ Peter Lo 202011
Tutorial 1Google Analytics Report2.1 Introduction2.1.1 Building BlocksReports in Google Analytics convert raw data into presentable information. In addition, links andoptions within reports provide interactive segmentation that enables you to reorganize the data onthe fly. There are two fundamental building blocks to any report in Google Analytics: Metrics andDimensions.2.1.1.1 MetricsMetric is defined as a numerical measure of the user interaction on your website. Metrics have thefollowing characteristics: Metrics always express in the form of a number.Metrics are standalone entities. When you look at a metric in a standalone fashion, itprovides you with information about the site-wide performance. Metrics will form the columns of a report structure in Google Analytics.Some of the common metrics you will find in Google Analytics are visits, pageviews, bounce rate,etc.2.1.1.2 DimensionsDimensions have the following characteristics: Dimensions are non-numerical data fields.Unlike metrics, dimensions are not standalone entities, i.e., dimensions are not generallymeaningful when viewed individually. Dimensions, when coupled with metrics, provide meaningful context to the data.Dimensions can be used to segment a metric.Google Digital Marketing @ Peter Lo 202012
Tutorial 12.1.2 Report LayoutGoogle Analytics is a great tool to understand how your website is doing and what areas needimprovement. However, sometimes it can produce an overwhelming amount of data, making itdifficult to know what reports to look at, or how to understand what that data is telling you.2.1.2.1 GraphThe graph is automatically plotting your sessions. You can change what the graph is showing bychanging the metric. You can also compare one metric to another. The arrow underneath the graphwill open annotations. Here, you can make notes on the graph that were important. For example,you can mark the day your website was revamped, the day your AdWords campaign started to run,or when new content was added to your website.2.1.2.2 Date RangeThis determines the date range of the data you are looking at. Google automatically shows the last30 days of your website activity. You can also compare data of two different date ranges. Forexample, if you make SEO improvements to your website, you can compare the data from beforeand after you made the changes, to see if there was an impact.Google Digital Marketing @ Peter Lo 202013
Tutorial 12.1.2.3 SegmentsSegment is used to compare different sets of data. The default is “All Users.” You can choose up tofour segments to compare.2.2 Types of Google Analytics ReportsGoogle Analytics provides several main report categories. Here is quick summary provides anoverview of the available reports along with their definitions and significance, accessible in the leftsidebar.2.2.1 Real-Time ReportThe Real-Time Reports section in Google Analytics allows you to monitor activity on your site inreal time, as it happens. It can be a useful way of “taking the pulse” of the website in a specificmoment, or tracking the response to a campaign in real-time. A visitor to your site qualifies for thereal-time report if they have triggered an event, or pageview, within the last five minutes. This isdifferent from the other types of standard report, where a session is defined by a 30-minute window.Google Digital Marketing @ Peter Lo 202014
Tutorial 12.2.2 Audience ReportsThese reports tell you everything you want to know about your visitors. In them, you will finddetailed reports for your visitors' age and gender (Demographics), what their general interests are(Interests), where they come from (Geo Location) and what language they speak (Geo Language), how often they visit your website (Behavior), and the technology they use to view yourwebsite (Technology and Mobile).2.2.3 Acquisition ReportsThese reports tell you everything you want to know about what drove visitors to your website (AllTraffic). You will see your traffic broken down by main categories (All Traffic Channels) andspecific sources (All Traffic Source/Medium).You can learn everything about traffic from social networks (Social). You can also connect GoogleAnalytics to AdWords to learn more about campaigns and to Google Webmaster Tools / SearchConsole to learn more about search traffic.Google Digital Marketing @ Peter Lo 202015
Tutorial 12.2.4 Behavior ReportsThese reports will tell you everything you want to know about your content. Particularly, the toppages on your website (Site Content All Pages), the top entry pages on your website (SiteContent Landing Pages), and the top exit pages on your website (Site Content Exit Pages).If you set up Site Search, you will be able to see what terms are searched for (Site Search SearchTerms) and the pages they are searched upon (Site Search Pages).You can also learn how fast your website loads (Site Speed) as well as find specific suggestionsfrom Google on how to make your website faster (Site Speed Speed Suggestions).2.2.5 Conversions ReportIf you set up Goals within your Google Analytics, you can see how many conversions your websitehas received (Goals Overview) and what URLs they happened upon (Goals Goal URLs). Youcan also see the path that visitors took to complete the conversion (Goals Reverse Goal Path).Speaking of goals and conversions, most of the tables within Google Analytics standard reports willtie specific data to your conversions. For example, you can see the number of conversions made byvisitors in the Audience Geo Location report. You can see the number of conversions madeby visitors from Facebook in the Acquisitions All Traffic Source/Medium report. You can seethe number of conversions made by visitors who landed on specific pages in the Behavior SiteContent Landing Pages report.Google Digital Marketing @ Peter Lo 202016
Tutorial 12.3 Important Data to Focus2.3.1 UsersThis represents the number of people who have come to your site. Even if they have visited yoursite multiple times, it will only count as one user.2.3.2 New UsersThis represents an estimated percentage of sessions that came from new users.2.3.3 SessionsThis represents the number of times a user was active on your website. A session will reset after 30minutes of inactivity, or at the end of the calendar day. This metric does not recognize users; it willcount a new session if the user has been to your site before.Google Digital Marketing @ Peter Lo 202017
Tutorial 12.3.4 Page ViewsThis represents the total number of pages that were viewed on your website. This includes repeatedsite users and repeated page views.2.3.5 Pages/SessionThis represents the average number of pages that were viewed in a session. This includes repeatedpage views.2.3.6 Average Session DurationThis represents the average amount of time a user spends during a session on your website.Google Digital Marketing @ Peter Lo 202018
Tutorial 12.3.7 Bounce RateThis is the percentage of users who only visit one page of your website and leave. They do not visitany other pages. Normally, you want this rate to be as low as possible. A good average rate is40-60%.2.3.8 DemographicsLanguage, Country, City are important information if you want to sell your product worldwide, youmust make the local languages and refer the IP to related currency, language and domain, so thatyou can ignore the market that is useless for your business2.3.9 Operation SystemOperating System will show the ratio that clients operation system, it is very important that relatedyour product for some business, for example if u sell windows software, u need to set a filter to skipthe related client to get your real client dataGoogle Digital Marketing @ Peter Lo 202019
Tutorial 12.3.10 Screen ResolutionIt decides your mobile first resolution, if u have many clients using mobile, u should make aResponsive website. For example, some website is a desktop website, which is not easy to explorein mobile.2.4 Report Distribution2.4.1 ExportThis is where you can export the data you are looking at. This comes in handy when you need it inExcel, where the data can be exported directly.Google Digital Marketing @ Peter Lo 202020
Tutorial 12.4.2 Share by EmailThis will allow you to e-mail the report you have to anyone you would like. You can also set it up toallow Google to e-mail you the report every month, week, etc. with updated data.2.4.3 Scheduling Reports in Google AnalyticsYou will need to use the drop down menu to select the frequency at which you want to send youremails out. You can also select the Include date comparison option which will allow GoogleAnalytics to compare the current results with the previous week or month based on the date rangethat you have selected.Google Digital Marketing @ Peter Lo 202021
Tutorial 1Some Useful Report3.1 The Real-Time ReportReal-time analytics allows you to monitor activity as it's happening on your site. You can see howmany people are on your site right now, top keywords being searched, top active pages, as well asthe location(s) of those accessing your site.3.2 The Audience ReportThe audience report is one of the most useful reports that you can view for your site. Based on aselected period of time, this report shows the total number of sessions, users, and page views, aswell as other valuable information such as the average session duration and the bounce ratepercentage.Demographic, system, and mobile statistics also can be viewed on the same dashboard as theaforementioned numbers. This allows you to see what county and city your site visitors are comingfrom, what browser and operating system they are using, as well as what type of mobile device andscreen resolution they’re viewing your site on.Google Digital Marketing @ Peter Lo 202022
Tutorial 13.3 The Age Group ReportThe ages reported on are segmented into seven age ranges: 18-24, 25-34, 35-44, 45-54, 55-64 &65 . Note that under 18’s are not part of the age demographic report.3.4 The Gender ReportBoth genders are reported on, as you would expect. Google currently has slightly more data ongender than age. For example, one area of the website may perform better for females and anothermay perform better for males. Looking at just the overall statistics won’t show this difference, asthey may cancel each other out. These generic statistics can lead to incorrect, or even hazardousconclusions about demographic performance.Google Digital Marketing @ Peter Lo 202023
Tutorial 13.5 The Language ReportThe Languages report is among the most cryptic of the reports in Google Analytics. It looks likeyou need a secret decoder ring to figure out what it is telling you. The codes are not specific toGoogle Analytics; in fact, they are based on two ISO standard specifications: ISO 639 specifies 2-letter and 3-letter codes for languages. ISO 3166 specifies 2-letter and 3-letter codes for countries, as well as 3-digit codes.In most cases, languages in the Google Analytics report have a 2-letter language code (for example,“en” for English). Optionally, though, there may also be a 2-letter country code, with a hyphenseparating the two parts (for example, “en-us” for US English).3.6 The Location ReportGoogle Analytics determines locations from a visitor’s IP addresses and where internet serviceproviders assign those ranges. Data at the country level is pretty accurate worldwide; Google saysthat mobile devices may show inaccurate cities. Also keep in mind that a VPN can fool this sort oftracking.Google Digital Marketing @ Peter Lo 202024
Tutorial 13.7 The Mobile ReportThese days we can access the Internet on a whole host of devices – from TVs to mobile phones togame consoles and e-readers. The poor desktop is getting dusty in the corner while everyone findsmore portable and shinier ways to access online content. This makes it important to ensure that yourwebsite will work on the range of devices available.This report is broken down by Device Category of which there are three types: desktop, mobile andtablet. However, there really could be more than three types of device category so you will need toremember the following: Desktop also contains laptops, netbooks and games consoles such as PlayStation 3 and theNintendo Wii / Wii U. Mobile Phones covers smart phones and handheld games consoles such as the Nintendo 3DSand PlayStation Vita. Tablets includes standard iPads, Google Nexus, Galaxy Tabs, and also e-readers such as theKindle Fire.Initially we come to the Mobile Device Info Report. This effectively shows us the name of thedevice, including the branding and the model. Reviewing the reports here we can identify the highsand lows across different devices.Google Digital Marketing @ Peter Lo 202025
Tutorial 13.8 The Acquisition ReportThe acquisition report allows you to view how users are getting to your site. For example, you cansee the number of users who arrived on your site via organic search, via direct navigation, or viaother avenues such as email.Additionally, each avenue allows you to drill down further for more in-depth information. You canview the keywords users have searched for on search engines that led them to your site, the directURL they entered, as well as which social network they clicked a link to your site from.ChannelExplanationOrganicOrganic mean organic search, the traffic from google, yahoo that is from searchengine, but not from ad.DirectDirect always from the user type your domain directly or your domain internallinkReferralReferral is from another websiteSocialSocial media such as Facebook, YouTube or related social mediaDisplayDisplay is the paid advertisement that display in websitePaid SearchPaid Search is Google advertisementAffiliatesThis is google partner advertisement.Google Digital Marketing @ Peter Lo 202026
Tutorial 13.9 The Source / Medium ReportThe traffic Source is the place where the traffic originated. For most optimized websites, that’sGoogle. However, it can also be referring sites. The Medium is the type of traffic: organic search,paid search, referral, and so forth.Source/Medium gives you the most complete data, so it is the default view. As you can see from thescreenshot below, Source/Medium shows each combination of source and medium separately.Google organic search traffic is shown and then Bing organic search traffic.3.10 The Search Queries ReportUse the Search Queries report to see the actual search queries that resulted in a display of yourAdWords ads. Insight into exactly how users are searching for your type of product or service givesyou an opportunity to refine your AdWords keyword list, reach a broader audience, and display yourads more effectively.Google Digital Marketing @ Peter Lo 202027
Tutorial 13.11 The Site Content ReportThe site content report is another handy report, as it shows you which pages are the most visited onyour site. You can view the total number of page views for a specific page, as well as other usefulstats such as the average amount of time a user spends on a given page.This report can be incredibly helpful when “cleaning up” your site content, as it aids in painting apicture of what visitors are looking for most on your site.3.12 The Behavior Flow ReportThe Behavior Flow report visualizes the path users traveled from one page or Event to the next.This report can help you discover what content keeps users engaged with your site. The BehaviorFlow report can also help identify potential content issues.Google Digital Marketing @ Peter Lo 202028
Tutorial 1Custom Report4.1 OverviewGoogle analytics provides you with the ability to create custom reports which can be emailed to youdaily, weekly or monthly. You can set up these reports so they are suitable to your needs and thismeans you can ignore the noise and focus on what is important to your business.4.2 Creating the Report1. In Google Analytics select the customization option followed by [New Custom Report].2. Input the following informationGoogle Digital Marketing @ Peter Lo 202029
Tutorial 1A. Enter the overall name of the custom reportB. You can have multiple sub reports within one report, press [ add report tab] to create it.C. Enter the name for the sub reportD. Decide on the type of report you want. Explorer Report – This is the same style you are used to when looking at Googleanalytics data. Flat Table – The flat table report is if you want a very basic table report, you’llprobably use this if you want to export your report to excel. Map Overlay – The map overlay report is a report that shows you your data on a map.Use this if you want to see results by country.E. Metric Groups – These are the rows within the table that you want displayed.F. Dimension Drill Down – This is how you want the metrics above displayed.G. Filter – You may want to filter out some traffic or data from your report.H. Additional Profiles – If you have more than one website you may want to use this reportfor other websites/profiles.4.3 Running the ReportWhen you run the report, you see a graphical display which shows the information you want. Youcan drill down to deeper level for analysis.Google Digital Marketing @ Peter Lo 202030
Tutorial 14.4 Google Data StudioGoogle Data Studio turns your data into informative dashboards and reports that are easy to read,easy to share, and fully customizable. Dashboarding allows you to tell great data stories to supportbetter business decisionsGoogle Digital Marketing @ Peter Lo 202031
Tutorial 1Custom Alert5.1 OverviewA custom Google Analytics alert sends you an email or SMS when a key change in traffic occursbased upon your chosen metrics. Setting the metrics around sessions, transactions, hits or revenue isrecommended. Never use the “Users” metric as that is deprecated and will cause other alerts to stopworking.5.2 Setup Google Analytics Custom Alert1. Select “Custom Alert” in Admin panel2. Press the [New Alert] buttonGoogle Digital Marketing @ Peter Lo 202032
Tutorial 13. Define the Alert rule and save.5.3 Example5.3.1 Site Up-Down Status MonitoringGoogle Digital Marketing @ Peter Lo 202033
Tutorial 1GlossaryDimension: This is a descriptive or characteristic attribute of an object which can be differentnumerical values. Some of the dimensions that appear by default in Google Analytics are Browserand Session Length.Metrics: Are individual elements of a dimension that can be measured as a sum of proportion. Forexample, Average Session Duration and Pages/Session are metrics used by GA.Users: Refers to a person that has had at least one session during a certain period of time. Thisincludes both new users as well as returning ones.Session: The time period during which a user is navigating on your website, within a given periodof time. Thus, all the use information (Screen Visualization, Events, etc.) is associated with asession.Number of page views: Shows the total quantity of page views. Repeated views of the same pageare included in this metric.Pages/Session: This is the average number of pages viewed during a session. It includes repeatedviews of the same page.Average Session Length: Shows the average amount of time of a session.Bounce Rate: It is the percentage of views to a certain page (for example, views in which peopleleave your site from the Home Page without interacting with the page).New Session: Displays an estimated percentage of visitors that entered your site for the first time.Objectives: Allow you to measure how often users carry out specific actions on your website.Conversions: Show the number of time in which the objectives have been completed on yourwebsite.Campaigns: Allow you to add settings to any URL from your website to obtain more informationabout your referral traffic.Referral Traffic: This is the segment of traffic that enters your website through an external source,for example a link in another domain.Acquisition: Shows how you acquire users.Behavior: Name given to a set of data designed to improve your content.Google Digital Marketing @ Peter Lo 202034
Tutorial 1 Google Digital Marketing @ Peter Lo 2020 13 2.1.2 Report Layout Google Analytics is a great tool to understand how your website is doing and what areas need improvement. However, sometimes it can produce an overwhelming amount of data, making it difficult to know what reports to lo