Transcription
Food photography I: the perception of food portion size fromphotographsBY M.NELSON, M. ATKINSON A N D S . DARBYSHIREDepartment of Nutrition and Dietetics, King’s College London, Campden Hill Road,London W8 7AH(Received 8 October 1993 - Revised I 1 January 1994 - Accepted 15 February 1994)Fifty-one male and female volunteers aged 18-90 years from a wide variety of social and occupationalbackgrounds completed 7284 assessments of portion size in relation to food photographs. Subjects wereshown six portion sizes (two small, two medium and two large) for each of six foods, and asked tocompare the amount on the plate in front of them to (a) a series of eight photographs showing weightsof portions from the 5th to the 95th centile of portion size (British Adult Dietary Survey), or (b) asingle photograph of the average (median) portion size. Photographs were prepared either in colour orin black and white, and in two different sizes. The order of presentation of foods; use of black and whiteor colour; the size of photographs; and presentation of eight or average photographs were eachrandomized independently. On average, the mean differences between the portion size presented and theestimate of portion size using the photographs varied from -8 to 6 g (- 4 to 5 %) for the series ofeight photographs, and from -34 to -1 g (-23 to 9%) for the single average photograph. Largeportion sizes tended to be underestimated more than medium or small portion sizes, especially when usingthe average photograph (from - 79 to - 14 g, -37 to - 13 %). Being female, 65 years and over, orretired, or seeing photographs in colour, were all associated with small but statistically significantoverestimations of portion size. Having a body mass index 2 30 kg/m2 was associated with an 8%underestimate of portion size. We conclude that use of a series of eight photographs is associated withrelatively small errors in portion size perception, whereas use of an average photograph is consistentlyassociated with substantial underestimation across a variety of foods.Food photography: Dietary survey: EpidemiologyPhotographs of food have often been used in dietary surveys to help subjects estimateportion size. Typically, photographs are taken of small, medium and large portions whichare judged to be representative of the range of portion sizes actually consumed. Subjectsare then asked to identify which photograph best reflects either their usual portion size (e.g.in a diet history) or actual portion size (e.g. in a 24 h recall). Alternatively, a singlephotograph of average portion size is displayed, and subjects are asked to estimate theirown portion size as a fraction, multiple or percentage of the amount shown in thephotograph.A complex process takes place when a photograph is used to identify portion size duringan interview or questionnaire completion. This process has three main elements : perception, conceptualization, and memory. Perception involves a subject’s ability to relate anamount of food which is present in reality to an amount depicted in a photograph.Conceptualization concerns a subject’s ability to make a mental construct of an amount offood which is not present in reality, and to relate that to a photograph. Memory will affectthe precision of the conceptualization.A number of studies have examined portion size assessment and the use of photographs.Guthrie (1984) reported that between 14 and 67 YOof assessments of food portion size were26-2Downloaded from https://www.cambridge.org/core, on subject to the Cambridge Core terms of use, available at https://www.cambridge.org/core/terms. https://doi.org/10.1079/BJN19940069649British Journal of Nutrition (1994), 72, 649-663
M. NELSON AND OTHERSin error by more than 50% when no aid was used. Pietinen and co-workers (19880,b)compared estimates of nutrient intake from weighed records with those from foodfrequency and amount questionnaires (FAQ) administered either with or withoutphotographs. The use of photographs improved the level of agreement between the FAQand the weighed records. Whereas some studies have used a set of photographs for eachfood depicting several portion sizes (Chu et al. 1984; Pietinen et al. 1988a; Edington et al.1989; Hankin et al. 1991; Tjonneland et al. 1991), others have used only a singlephotograph (Byers et al. 1985; Irish National Food Survey, 1990) while others still haveused photographs in conjunction with other aids (e.g. models, cups) (Rutishauser, 1982;Samet et al. 1984). The diversity of methods in these studies makes it difficult to compareoutcomes regarding the value of different approaches to portion size assessment.The general conclusion from these studies is that photographs are of benefit in helpingsubjects to assess portion size. It is inevitable, however, that inaccuracies in portion sizeassessment will remain. These errors will lead to misclassification of subjects according tothe amount of food consumed or the level of nutrient intake. The degree of misclassificationcan be reduced only if the components of the error are fully described.There is no research to date which looks specifically at the errors associated with eachof the elements of the process involved in estimating food portion sizes from photographs.This paper reports for the first time the errors associated with perception. It examines theseerrors in relation to factors which are potential influences on perception, such as the sizeand number of photographs displayed or whether the photographs are in black and whiteor colour. It also looks at factors relating to the subjects themselves (sex, age, body size)and to the type and amount of food being assessed.METHODSSampleThe aim was to obtain a good cross-section of men and women aged between 18 and 90years from a wide variety of social and occupational backgrounds. Table 1 shows thesamplecomposition. Recruitment of employed subjectswas mainly through local employersand the local authority, and for subjects retired or not employed, through voluntary groupsand day centres. All subjects were volunteers.Choice of foodsSix commonly eaten foods were chosen. They excluded foods which are easy to describe inhousehold measures (e.g. slices of bread, biscuits, eggs). The aim was to include foods forwhich some aid to portion size assessment would be necessary in an interview orquestionnaire, and to span selected characteristics of appearance which were likely toinfluence perception of amounts from photographs: area and depth of pieces or moundson a plate; number and size of pieces; area and thickness of slices; and depth in a bowl.The six foods chosen and their main characteristics for assessment in relation to perceptionwere: (1) boiled potato, number and size of pieces; (2) mashed potato, depth and area ofa mound of dry, stiff food; (3) quiche, area and depth of triangular slice; (4) cornflakes,depth of mound in bowl; ( 5 ) roast carcass meat, area, thickness and number of slices; (6)spaghetti, depth and area of serving of ‘slippery’ food.Portion sizes in photographsPortion size data were derived from the British Adult Dietary Survey (Gregory et al. 1990).For each food the distribution of reported food portion or serving weights was used todetermine portion weights corresponding to the 5th, 50th and 95th centiles.Downloaded from https://www.cambridge.org/core, on subject to the Cambridge Core terms of use, available at https://www.cambridge.org/core/terms. https://doi.org/10.1079/BJN19940069650
Table 1. Occupation and age group offifty-one subjects completing measurements ofperception of food portion size from photographsOccupation.Age group (years)18-2930-4445-64Over 64TotalMenWomenManual Non-manualManual Non-manual Non-working*333333624342222222627*Non-working women are those not currently in paid employment.Nine photographs were taken for each food. One photograph (referred to as the‘Average’) showed portion weight at the 50th centile. Eight photographs were takenshowing portion sizes between the 5th and 95th centiles, one each at the 5th and 95thcentiles, and the remaining six photographs at equal intervals between these two portionsizes. The values for the weights of food shown in the photographs are shown in theAppendix.Preparation of photographsPhotographs were taken under standard lighting conditions in a professional studio. Allfoods except cornflakes were photographed on a white 10” diameter dinner plate with adinner knife to the right of the plate and a dinner fork to the left against a whitebackground. Cornflakes were photographed in a white 6” diameter bowl with a dessertspoon to the right of the bowl. Contrast between the white plate or bowl and the whitebackground was achieved through lighting effects. All photographs were taken from anangle of 42” above the horizontal, which was assessed as an average angle of viewing fora subject seated at a dining table.All photographs were printed in the landscape orientation in both black and white andin colour. The ‘Average’ photographs were printed in two sizes, A5 (approximately150 x 200 mm) and A6 (approximately 100 x 150 mm). The series of eight photographs wasalso printed in two sizes, A6 and A7 (approximately 75 x 100 mm).Portion sizes for assessmentSix portions were prepared for each food. Two different portions were prepared in each ofthree size intervals: small (food weight between the weights shown in the first and thirdphotograph in the series of eight); medium (food weight between the third and sixthphotograph); and large (food weight between the sixth and eighth photograph). Theweights of the foods presented to the subjects are shown as two series (A and B) in Table 2.The two series relate to the randomization carried out during the assessment procedure(see below). The portion sizes selected for boiled and mashed potato were identical.Assessment procedureSubjects were invited in groups of four to attend the Nutrition Department at King’sCollege London for two 2 h sessions. At the first session each subject completed a shortDownloaded from https://www.cambridge.org/core, on subject to the Cambridge Core terms of use, available at https://www.cambridge.org/core/terms. https://doi.org/10.1079/BJN1994006965 1FOOD P O R T I O N S I Z E P E R C E P T I O N FROM P H O T O G R A P H S
M. N E L S O N A N D OTHERSTable 2. Food portion sizes ( g ) presented to subjects during the course of assessment ofperception*(Values for categories show the range of food weights in the photographs: small, photographs 1-3;medium, photographs 3-6; large, photographs 6-8 (see Appendix))Portion wt (9) FoodCategoryMashed potatoSmall 58-139Medium 140-259Large 26&345Small 5&139Medium 14C259Large 260-345Small 62-105Medium 106169Large 170-218Small 1 6 3 2Medium 33-59Large 60-77Small 54-159Medium 16&319Large 3 2 W 2 5Small 2 6 6 9Medium 70-139Large 14&190Portion APortion B8724327 4174863173573782178 Boiled potatoQuicheCornflakesSpaghettiSliced meat*802024035399189For details of subjects and procedures, see Table 1 and pp. 65&653.questionnaire providing personal details on age, sex, height, weight, occupation, colourblindness, and weight gain or weight loss in the previous year. Working in a taste panelroom in which subjects were screened from one another, each subject was presented witha plate or bowl of one food in one of the six portion sizes given in Table 2, together withthe photograph(s) of that food. The plate or bowl was identical to that in the photographs.In any one session, subjects evaluated foods either in relation to the sets of eightphotographs or in relation to the average photographs. The eight photographs werepresented on a single sheet and numbered from ‘1’ (smallest) to ‘8’ (largest).Within any one session, subjects saw either single average photographs only or the seriesof eight photographs only. Within any half session, subjects saw either black and whitephotographs only or colour photographs only. The order of presentation of the series ofeight or single average photographs and black and white or colour photographs wasrandomized between sessions. Four randomized series of order of presentation regardingsize of photograph, food, and portion size were generated. Within each half session thesame randomized sequence was used for every subject. The randomization thereforeincluded eight v. average photographs, black and white Y . colour, foods, portion size, andsize of photograph, and each of these contrasts was treated as independent for the statisticalanalyses.Each half session lasted not more than 45 min, in which each subject completed thirtysix assessments. Subjects had a short tea break between half-sessions. At the end of both2 h sessions, each subject had completed 144 assessments. A total of 7344 (51 x 144)assessments was planned.At the start of each half session involving the use of series of eight photographs, subjectswere given a sheaf of six pages stapled together. Six plate numbers in the randomizedDownloaded from https://www.cambridge.org/core, on subject to the Cambridge Core terms of use, available at https://www.cambridge.org/core/terms. https://doi.org/10.1079/BJN19940069652
653sequence were listed on each page, each of which was headed with the followinginstruction: ‘The points 1 to 8 on the scale represent the eight photographs of portion sizepresented for each food. Please mark a cross at any position on the line which you thinkmost closely represents the portion size of the food presented. ’ Foods were presented in theorder in which they were listed on the page. Subjects were presented with an 11.5 cm visualanalogue scale (VAS) as shown below:PLATE NUMBER12345678I1III1IIEach food was passed through a serving hatch on a numbered plate with the correspondingphotographs, and the subject was asked to place a cross at the point on the line accordingto the instruction above.For the average photographs, subjects were given two stapled sheets in each half sessionand, again, foods were presented in the order in which they were listed on the page. Subjectswere asked to write down a number which expressed the amount on the plate as a fraction,multiple or percentage of the amount shown in the photograph. After assessing each foodportion, the plate was handed back through the serving hatch, and the next food andphotograph(s) were presented.Statistical analysisData were analysed using the SPSSX computer program on a Digital VAX computer. Foreach assessment the weight of the food actually presented was subtracted from the weightestimated from the VAS (for the eight photographs) or the fraction or multiple (of theaverage photograph). Thus, a positive value indicates an overestimate of the weight, anda negative value an underestimate. The percentage difference was the difference in gramsdivided by the weight of the food portion presented multiplied by 100.Differences between estimated and actual food portion sizes were assessed using thepaired t test. Statistical analysis of the differences in the error of estimate between colourv . black-and-white, eight photographs v . average photograph, portion size effect, and theother variables, were carried out using analysis of variance with food as the covariate.The study was approved by the King’s College Human Experimentation Committee.RESULTSOf the 7344 assessments, 160 (2.2 YO)were not usable, either because there were two or moremarks on the VAS used with the eight photographs, or because the fraction, multiple orpercentage indicated (e.g. ‘ -400% less’) could not be sensibly interpreted.Table 3 shows for each food the mean difference between estimated and actual weight,the mean percentage difference, and the rank correlation between estimated and actualweights. Portion size tended to be underestimated rather than overestimated, significantlymore so using the average photograph than the eight photographs. Because of the verylarge number of observations, the estimated weights were statistically significantly differentfrom the actual weights (paired t test, P 0.01) for every food except for cornflakes whenestimated using the average photograph. Similarly, the percentage differences werestatistically significantly different from zero with the exceptions of mashed potato,cornflakes and sliced meat (for eight photographs) and quiche and spaghetti (for theDownloaded from https://www.cambridge.org/core, on subject to the Cambridge Core terms of use, available at https://www.cambridge.org/core/terms. https://doi.org/10.1079/BJN19940069FOOD P O R T I O N SIZE P E R C E P T I O N FROM P H O T O G R A P H S
0.890.810.800.7437-6.9***31.444.1- tato49.167.3- 6snCornflakesMean value obtained using one average photograph was significantly different from that obtained using eight photographs:t For details of subjects and procedures, see pp. 65e653. Estimated weight minus actual weight.0 ((Estimated-actual weight)/actual weight) x 100.11 Correlation of observed v . actual weight. All values were statistically significant (P 0,001).No. of assessments8 photosAverage photoMean wt differences (g)t8 photosAverage photoMean wt differences (YO)§8 photosAverage photoRank correlation coefficient118 photosAverage photoFood .(Mean values and standard 4-2-233*** 36.3-31.8***-3.3602588MeanSlicedmeat* P 005, ** P 0.01, *** P Table 3. DifSerence in weight ( g ) between estimated and actual food portion size, and percentage dixerence in weight for six foodsaccording to use of eight photographs or one average photograph?5z0v)rDownloaded from https://www.cambridge.org/core, on subject to the Cambridge Core terms of use, available at rg/10.1079/BJN19940069
Mean SDMean SD*********13.2 32.4-5.818.1-13.4 1786.2 58.5-7.7 17.0- 18.7 24.94 4 66.324.8-22.6 21.9- 16.78.6 19.28.1 17.4-0-7 13.4******11.6 28.3-9.3 27.1-25.5 33.42.3 40.48.6 23.00.4 16-6****4.1 41.6- 15.2 32.5-58.0 76.03.2 46.61.4 21.8-72 17.3*****3.1 603-34.0 55.8-67.3 66.2***1-5 29.616.0 43.80 1 50.42 9 44.32.9 48.4-21.6 504*7.5 16.711.8 25.4-1.6 4204198204QuicheBoiled potato***45-0 2902.0 164-19.4 18.2***7.2128656-2749510.8 25.60.8 16.6-8.3 an SDCornflakes***29.2 81.6-1.6 21.3-20.6 19.0**-10.1 47.71.6 18.9-5.2 16.8***24.4 68.2-8.4 63-2-79.1 72.8**-8.5 38.83.9 47.8-20.8 64.3190200199199204204Mean SDSpaghetti***-7-7-24.0-37.2***t For details of subjects and procedures, see pp. 650-653.** P 0.01, *** P 0@01. Estimated weight minus actual weight.((Estimated weight-actual weight)/actual weight) x 100.* P e 005,53.423.815.09.0 46.8-2.6 31'5-5.9 13.923.621.4274***-6.6-22.0-68.1***3.8 21.8--2.610.9 28.325.5188200200204194204Mean SDSliced meatDifference in mean weight differences and mean percentage weight differences between portion sizes was significantly different by analysis of variance:PMean wt differences (%)§8 photosSmallMediumLargePAverage photoSmallMediumLargePAverage photoSmallMediumLargePNo. of assessments8 photosSmallMediumLargeAverage photoSmallMediumLargeMean wt differences (g) 8 photosSmallMediumLargeMean SDFood. . Mashed potato(Mean values and standard deviations)Table 4.Diference in weight ( g ) between estimated and actual food portion size, and percentage difference in weight for six foods,according to portion size (small, medium or large)?ululo\w0nDownloaded from https://www.cambridge.org/core, on subject to the Cambridge Core terms of use, available at rg/10.1079/BJN19940069
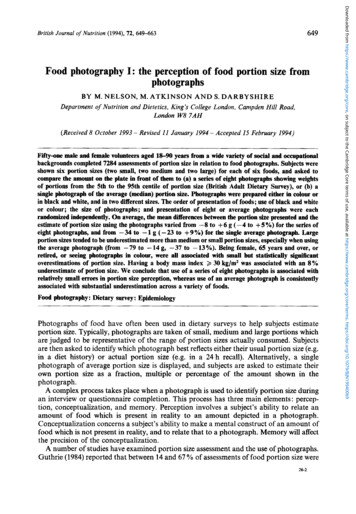
M. N E L S O N A N D OTHERS(a)60-In.wOver- or underestimate of actual portion size (g)10080a.wcE 60 am0r& 40szr)r200Over- or underestimateof actual portion size (g)Fig. 1. Differences between actual portion weights of mashed potato and estimates obtained using (a) eightphotographs and (b) average photographs, by portion size. (O),small portion; (a),medium portion; (m), largeportion.average photographs). The correlation coefficients show that the estimated portion sizeswere ranked more closely to the actual weights using the eight photographs than using theaverage photograph. The apparent discrepancy between the negative mean weightdifferences and the positive mean percentage weight differences for cornflakes, spaghettiand sliced meat is a mathematical artifact which is resolved when differences in portion sizeare taken into account.Table 4 gives results as for Table 3 shown according to portion size. The large portionsDownloaded from https://www.cambridge.org/core, on subject to the Cambridge Core terms of use, available at https://www.cambridge.org/core/terms. https://doi.org/10.1079/BJN19940069656
f 7 0 or moref60I 1 0 0 or moreYOf 10& 20f 30f 40k 50 9080k 60k70f 50f40& 30h 10f 20gPhotographs.Food 97498.398.999.41008 89.192.8100AvSlicedmeat Table 5 . Cumulative percentages of estimates of portion size (as g or %) made using eight photographs or one average photograph towithin a specijied range of the actual portion size051w0cdw00t,Downloaded from https://www.cambridge.org/core, on subject to the Cambridge Core terms of use, available at rg/10.1079/BJN19940069
M. NELSON A N D OTHERSTable 6 . Mean percentage differences between estimated and actual portion weights, bysex, age group, occupational group, and body size group, for assessments using eightphotographs or one average photograph*?(Mean values and standard deviations)Eight photographsVariableSexMaleFemaleAge group (years)I &2930-4445-6465Body mass index (kg/mz) 2525-29.930Occupation groupNon-manualManualUnemployed ornot workingRetiredAverage photographnMeanSDMeanSD2427- 1.42.827.128.8- 8.9- 2.538.842.61.o7.026.426.824.633.1-6.9-7.8-5.1- 1.142-838.239.144.0 121611120.92.4- 7.527.829.223.1-8.3 27204- 1.0- 7.136.744.449.320166-0.83.022.726.335.0-8 7-5.8- 1.837439446.296.035.40.146.1-2.0-2.0-0.8*For details of subjects and procedures, see pp. 65W653.All analyses of variance between variables controlling for food and portion size, by eight photographs oraverage photograph, P 001.twere consistently underestimated, with the exception of boiled potato using eightphotographs. The underestimates were most pronounced for the average photograph,where the large portion size was underestimated on average from 14 g (for cornflakes) toas much as 79 g (for spaghetti), or in percentage terms, from 13 YO(for quiche) to 37 %(for sliced meat). For every food the size of the portion had a statistically significant effecton the amount of under- or overestimation of portion weight, although the degree of underor overestimation was consistently much lower when using the eight photographs thanwhen using the average photograph. The range of variation, reflected in the standarddeviation, was generally greater for the average photograph than for the eight photographs.The typical range of variation is shown in Fig. 1, whch plots for each assessment ofmashed potato the under- or overestimate of portion weight according to portion size usingeight photographs or the average photograph. Using eight photographs, 71 YO ofassessments were within 50 g of the actual weight. The errors were smaller for the smallportion and larger for the large portion. In contrast, only 49 YOof the assessments using theaverage photograph were within 50 g of the actual weight, and for the large portion, only20 % were within 50 g, the majority (74 %) being more than 50 g below the actual weight.For all foods, estimated portion sizes were within & 20 YOof the actual weight for between59% (for sliced meat) and 73% (for cornflakes) of observations when using eightphotographs. With the average photographs, between 23 Yo(for sliced meat) and 64 % (forquiche) of estimates were correct to within &20Y0. The details of the number ofobservations correctly classified to within a specified range are given in Table 5.In dietary surveys, sex, age, body size and occupation are potential confoundingDownloaded from https://www.cambridge.org/core, on subject to the Cambridge Core terms of use, available at https://www.cambridge.org/core/terms. https://doi.org/10.1079/BJN19940069658
659Table 7. Mean percentage diyerences between estimated and actual portion weights, byblack and white or colour photographs, and by size of photograph, for assessments usingeight photographs or one average photograph*(Mean values and standard deviations)Eight photographsVariableBlack-and-whiteor colourtBlack-and-whiteColourSize of photographA5 (150 x 200 mm)A6 (1OOx 150mm)A7 (75 x 100 mm)Mean- 0.21.9SDMeanSD26.529.6-6.6-4.343.338.6- 4.945.2365-1.20.4Average photograph29.4268- 6.0-*For details of subjects and procedures, see pp. 65&653.Analyses of variance between variables controlling for food or portion size, by eight photographs or averagephotograph, P 0.01.- variables. The mean percentage differences in weight across all foods and portion sizes inrelation to eight or average photographs are shown for these variables in Table 6. Theobserved differences between males and females, age groups, body mass index (BMI)groups and occupational groups are highly statistically significant (P 0.01 ; analysis ofvariance controlling for food and portion size). Males underestimated portion sizescompared with females, the difference in the error being greater for the averagephotographs than the eight photographs. The 65 age group tended to overestimateportion size for the eight photographs, and underestimate less than the other groups usingthe average photographs. Subjects with high BMI ( 30 kg/m2) underestimated portionsize compared with the other groups when using eight photographs. Being retired wasassociated with overestimating portion size, but this effect disappeared when age was takeninto account.Table 7 shows the effects of black and white v. colour photographs, and differentphotograph size on the estimates of portion size. Colour photographs were associated witha slight overestimation using the eight photographs, and with less underestimation usingthe average photographs (analysis of variance controlling for food and portion size,P 0.01). Small differences in the mean percentage difference using different sizephotographs were not statistically significant.DISCUSSIONThe results from this study point to clear and consistent biases in the perception of foodportion size from photographs. Specifically: (1) use of single or average photographs isassociated with much larger errors in estimate of portion size than use of a series of eightphotographs; and (2) large portions are likely to be underestimated, more so using averagephotographs than eight photographs.The subjects were all volunteers who knew of the general nature of the study at theoutset. While they cannot be said to be representative of the population as a whole, theydo represent a good cross-section of people from all walks of life. There is no reason tobelieve that the subjects are different with regard to their perception of food fromphotographs than other members of the population.Downloaded from https://www.cambridge.org/core, on subject to the Cambridge Core terms of use, available at https://www.cambridge.org/core/terms. https://doi.org/10.1079/BJN19940069F O O D P O R T I O N S I Z E P E R C E P T I O N FROM P H O T O G R A P H S
M. NELSON AND OTHERS350 300 -ln5E 250 200 -lnmy.2a,150-a5 100 -z50 n"012345678Position of mark on visual analogue scale9Fig. 2. Position of the mark placed by subjects on a visual analogue scale in relation to eight photographsfor all six foods (n 3625 assessments).The majority (974%) of the assessments were completed successfully. There was nosingle food or set of assessments which was more problematic than another, although thesubjects reported having more difficulty in assessing amounts as a fraction or multiple ofthe average photograph than in using the VAS. Many subjects reported a progressiveawareness of the factors which might influence their perception of portion size such asthickness of slices or size of pieces, but there were no obvious learning or fatigue effects.The underestimate of portion size using the average photograph shown in Table 3 isexplained largely by the underestimate associated with the medium and large portion sizes(Table 4). For all six foods the size of the error for the large portions (both in absoluteand percentage terms) was at least three to four times as great using the averagephotographs compared with the eight photographs. Moreover, the spread of errors (asshown by the standard deviations) was wider using the average photographs.The largest errors occurred for mashed potato and spaghetti, and the smallest forcornflakes. Subjects found it difficult to estimate the depth of the mashed potato andspaghetti in the photog
British Journal of Nutrition (1994), 72, 649-663 649 Food photography I: the perception of food portion size from photographs BY M. NELSON, M. ATKINSON AND S. DARBYSHIRE Department of Nutrition and Dietetics, King’s College London, Campden Hill Road, London W8 7AH (Received 8 October 1993 -
