Transcription
8Managing Soil pHand Crop NutrientsFabián G. FernándezDepartment of Crop Sciencesfernande@illinois.eduRobert G. HoeftDepartment of Crop Sciencesrhoeft@illinois.eduThe inherent complexity of crop production systemsrequires integrating many factors to ensure maximum crop yields with the least risk to the environment.Assessing present- and reserved-nutrient status of the soil,understanding its nutrient-release and nutrient-holdingcapacity, and knowing the plant and environmental factorsthat impact nutrient availability are necessary to guidefertilization rates, sources, and method of application ofadditional nutrients. The information here is intended toprovide fundamental principles to help the reader understand what to do, and why, when making managementdecisions related to phosphorus (P), potassium (K), secondary macronutrients (calcium [Ca], magnesium [Mg],and sulfur [S]), micronutrients (boron [B], chlorine [Cl],copper [Cu], iron [Fe], manganese [Mn], molybdenum[Mo], and zinc [Zn]), and pH.Factors Impacting Plant-NutrientAvailabilityNutrient availability can be impacted by soil chemicaland physical properties, including parent material andnaturally occurring minerals; amount of organic matter;depth to bedrock, sand, or gravel; and permeability, waterholding capacity, and drainage. In addition, environmental conditions and crop characteristics have an importantimpact on nutrient availability. It is not unusual for cropsin fields or portions of fields to show nutrient deficienciesduring periods of the growing season, even where an adequate nutrient management plan is followed. The fact thatnutrients are applied does not necessarily mean they areManaging Soil pH and Crop Nutrientsavailable. Plants obtain most of their nutrients and waterfrom the soil through their root system. Any factor that restricts root growth and activity has the potential to restrictnutrient availability. This is not because nutrients are notplant-available in the soil, but because the ability of thecrop to take up those nutrients is restricted. Understandinghow these factors can cause nutrient deficiency in crops isimportant to avoiding excessive concern about the need foradditional fertilization when a sound nutrient program isalready in place.Soil compaction can limit or completely restrict root penetration and effectively reduce the volume of soil, includingnutrients and water, which can be accessed by the plant.To limit soil compaction, avoid entering fields that are toowet, and minimize the weight per axle by decreasing loadweight and/or increasing tire surface area in contact withthe soil. Planting when soils are wet can create a compacted wall next to the seed that will prevent the seedlingfrom developing an adequate root system. Tilling wet soilswill result in clods that become hard and dry out quicklyon the surface, preventing roots from accessing resourcesinside the clod.Soil water content is critical not only to supply the waterneeds of the crop but also to dissolve nutrients and makethem available to the plant. Excess water in the soil, however, depletes oxygen (O2) and builds up carbon dioxide(CO2) levels. While O2 is needed by roots to grow and takeup nutrients, high CO2 levels are toxic.Temperature is important in regulating the speed of soilchemical processes that make nutrients available. Undercool soil temperatures, chemical reactions and root activ-91
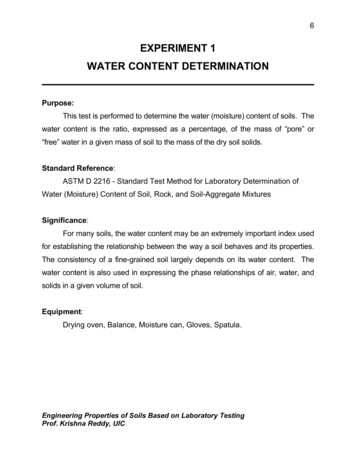
ity decrease, rendering nutrients less available to the crop.Portions of the plant nutrients are taken up as roots extractsoil water to replenish water lost through the leaves. Coolair temperatures can lower evapotranspiration and reducethe convective flow of water and nutrients from the soil tothe root.Light intensity is low on cloudy days. Low light intensityreduces photosynthetic rates and nutrient uptake by thecrop. Since low light intensity sometimes occurs whensoils are waterlogged or temperatures are cool, cloud covercan exacerbate the capacity of the crop to take nutrients.Diseases and pests can have an important impact oncrop-nutrient uptake by competing for nutrients, affectingphysiological capacity (such as reduction in photosynthesisrates), and diminishing root parameters through root pruning or tissue death.Estimating Nutrient AvailabilitySoil AnalysisSoil tests are not perfect, so a soil test value should beconsidered not a single value, but rather a value within arange. There are multiple reasons why soil tests are notperfect: a soil test represents a measurement at one pointin time, while a crop takes nutrients through an extendedperiod, and typically under very different soil-water andtemperature conditions than at the time of sampling; theinformation generated typically comes from a sample fromthe plow layer, but the crop roots extract nutrients belowthat layer; laboratory precision is typically within 5% to10% of the true value. Despite these imperfections, soiltesting is the most important guide to profitable application of phosphorus, potassium, and lime because it provides a framework for determining the fertility status ofa field. In contrast, plant tissue analysis is typically morereliable than soil testing for secondary macronutrients andmicronutrients. Since crop yield response to applicationof these nutrients has been very limited in Illinois, thereis not a large enough database to correlate and calibratesoil-test procedures. Ratings in Table 8.1 can provide aperspective on the reliability, usefulness, and cost effectiveness of soil tests as a basis for planning a soil fertilityand liming program for Illinois field crops.Traditionally, soil testing has been used to decide howmuch lime and fertilizer to apply to a field. With increasedemphasis on precision agriculture, economics, and the environment, soil tests are also a logical tool to determine areaswhere adequate or excessive fertilization has taken place. Inaddition, they are used to monitor the impact of past fertilitypractices on changes in a field’s nutrient status. Of course aTable 8.1. Ratings of soiltests.TestWater pHRatinga100Salt pH30Buffer pH30Exchangeable H10Phosphorus85Potassium60Boron: alfalfa60Boron: corn andsoybeans10Iron: pH 7.530Iron: pH 7.510Organic y60Sulfur40Zinc45soil test report can onlybe as accurate as thesample sent for analysis. In fact, the spatialvariability of available nutrients in a fieldmakes soil samplingthe most common andgreatest source of errorin a soil test. To collectsamples that provide atrue measurement ofthe fertility of an area,one must determine thesampling distribution;collect samples to theproper depth; collectsamples from preciselythe same areas of thefield that were sampledin the past; and collectsamples at the propertime.Field soil. A soil probeis the best implementManganese: pH 7.510for taking soil samples.Copper: organic soils20An auger or a spadeCopper: mineral soils5can also be used asaOn a scale of 0 to 100, 100 indilong as care is taken tocates a very reliable, useful, andcollect an exact depthcost-effective test, and 0 indicatesa test of little value.with a constant slicethickness (Figure 8.1).A soil sample, or sampling point in the field, should bea composite of at least five soil cores taken with a probefrom within a 10-foot radius around the sampling point.Composite samples should be placed in bags with labelsidentifying the places where the samples were collected.Manganese: pH 7.540Sampling distribution. The number of soil samples takenfrom a field is a compromise between what should be done(information) and what can be done (cost). The most common mistake is taking too few samples to represent a fieldadequately. Shortcuts in sampling may produce unreliableresults and lead to higher fertilizer costs, lower returns, orboth. Determine a soil sampling strategy by first evaluating cost, equipment to be used, past fertilization practicesused, and the potential response to fertilizer application.Possible strategies include sampling for the following:uniform fertilizer applications. For this approach, sampling at the rate of one composite from each2-1/2-acre area is suggested (see Figure 8.2, diagram a,for sampling directions).lW hole-field92Illinois Agronomy Handbook
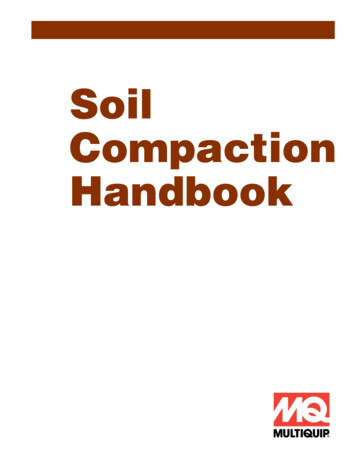
Soil slice1/2'' thick165 ft165 ftS 1330 ftSoil probeAugerSpadeS 2lC onservationtillage fields with fertilizer band applications. There is not presently enough research data todefine an accurate method for sampling these fields, sothe following methods are given as suggestions. Whenthe location of the band is known, collect the regular7-inch depth sample 6 inches off the side of the band.Another approach would be to multiply a factor (0.67)by the distance (in inches) between bands to determinehow many cores need to be collected from outside theband for each sample collected in the band. For example,in a 30-inch band distance, collect 20 cores from outsidethe band for each sample collected in the band. If thelocation of the band is not known, the best approach isto increase the number of samples (20 to 30) and to varysampling position in relation to the row so the band doesnot bias test results.Sampling depth. The proper sampling depth for pH,phosphorus, and potassium is 7 inches. This is because thefertilizer recommendation system in Illinois is based oncrop response to fertility levels in the top 7 inches of thesoil. For fields where conservation tillage has been used,Managing Soil pH and Crop NutrientsS 4110 ftS 1S 12S 6b5 SS 12330 ft330 ft13 SS 10S 9220 ftS 13220 ftS 11220 ftS 4330 ft220 ft110 ft220 ftS 314 SOne sample per 2.5 acres220 ftS 2330 ft11 S330 ft330 fta330 ft6 S330 ft330 ftS 15330 ft3 S16 S330 ftS 10330 ftlS ite-specific9 S330 ftS 7Figure 8.1. How to take soil samples with a soil probe, anauger, and a spade.applications for fields where large variations in test values over a short distance are suspected.Under these conditions, collecting one sample from each1.1-acre area (Figure 8.2, diagram b) will provide abetter representation of the actual field variability. Thegreater sampling intensity will increase cost of the baseinformation but allows for more complete use of technology in mapping soil fertility patterns and thus moreappropriate fertilizer application rates.lZ ones with common characteristics. This is a directedsampling approach that is also known as “smart” orzone sampling. This method integrates informationincluding such details as yield maps, crop canopydata, soil type or other characteristics, past manage ment history, and the like. It defines sampling zoneswith common characteristics that may influencecrop productivity and nutrient and water supplies.The size of such zones varies depending on fieldcharacteristics, but it seldom exceeds 10 acres.330 ftS 8220 ftS 14220 ftS 16220 ft220 ft220 ftS 35220 ftS 27S 21S 36S 26220 ftS 22220 ftS 25220 ftS 23220 ftS 15220 ftS 24220 ftS 34220 ftS 28220 ftS 33220 ft220 ft220 ft220 ft220 ft220 ft5 S8 S17 S20 S29 S32 S220 ft220 ft220 ft220 ft220 ft220 ftS 7220 ftS 18S 19S 30220 ftS 31220 ftOne sample per 1.1 acresFigure 8.2. How to collect soil samples from a 40-acrefield. Each sample (diagram a) should consist of five soilcores, 1 inch in diameter, collected to a 7-inch depth fromwithin a 10-foot radius around each point. Higher frequencysampling (diagram b) is suggested for those who can usecomputerized spreading techniques on fields suspected ofhaving large variations in test values over short distances.accurate sampling depth is especially important, as suchtillage results in less thorough mixing of lime and fertilizers than a tillage system that includes a moldboard plow.This stratification has not adversely affected crop yield,but misleading soil test results may be obtained if samplesare not taken to the proper depth. Shallow samples will93
overestimate actual soil status, leading to underapplication of lime or fertilizers, while samples that are too deepor where some part of the top portion falls off duringsampling will underestimate current soil status, causingoverapplication of lime or fertilizers.If surface soil pH is too high or too low, the efficacy ofsome herbicides and other chemical reactions may beaffected. Thus, in addition to the regular 7-inch depthsampling, if either limestone (which raises pH) or nitrogen(which lowers pH) is applied to the soil surface and not incorporated with tillage, it is important to monitor surfacesoil pH by collecting samples to a depth of 2 inches fromat least three areas in a 40-acre field. These areas shouldrepresent the low, intermediate, and high ground of thefield.Precise sample locations. Variations in values are oftenobserved across soil tests in the same field. Given the inherent variability of soils over even short distances (relatedto soil forming factors) and management effects for whichthere is no record (such as non-uniform distribution offertilizer), it is important to collect samples from preciselythe same points each time a field is tested. Sample locations can be identified using a global positioning system(GPS) unit or by accurately measuring the sample pointswith a device such as a measuring wheel.When to sample. Sampling every 4 years is stronglysuggested when soils are at an optimum level of fertility.When maintenance levels are not being applied in cropping systems that remove large quantities of nutrients, suchas hay or corn silage, soil testing should be done everyother year. To improve the consistency of results, collectsamples at the same time of year and, if possible, undersimilar soil-water conditions. Sampling done within a fewmonths of lime or fertilizer treatment will be more variable than after a year.Late summer and fall are the best seasons for collectingsoil samples, because K test results are most reliable then.Results of the K test tend to be cyclic, with low levels inlate summer and early fall and high levels in late Januaryand early February. Phosphorus and pH levels are typicallynot seasonally affected in most soils in Illinois. In coarsetextured (sandy) soils with low buffer capacity, pH levelscan increase as much as one unit under wet conditions.Sending soils for analysis. Find information about commercial testing services available in your area at www.soiltesting.org, or contact an Extension office or a fertilizerdealer.The best fertilizer recommendations are based on bothsoil test results and knowledge of field conditions that willaffect nutrient availability. Because the person makingthe recommendation does not know the conditions in eachfield, it is important to provide adequate information witheach sample.The information needed includes cropping intentionsfor the next 4 years; the name of the soil type or, if notknown, the nature of the soil (clay, silty, or sandy; lightor dark color; level or hilly; eroded; well drained or wet;tiled or not; deep or shallow); fertilizer used (amount andgrade); lime applied in the past 2 years; and proven yieldsor yield goals for all proposed crops.The following tests should be performed:l pH:The water pH test.The Bray P1 test for plant-available soilP. This test has been used to measure P availability inIllinois since it was developed in the 1940s. It was notdeveloped to test alkaline soils, so it should be restrictedto soils with pH less than 7.3. The Mehlich-3 test wasdeveloped in North Carolina for routine analysis of P, K,Ca, Mg, and several micronutrients. Research in Iowahas shown that the P results obtained with this test arenearly identical to those obtained with the Bray P1 teston neutral-to-acid soils as long as the analysis is doneby the colorimetric procedure. In soils or portions ofa field where pH is above 7.3, the Bray P1 test resultsin high test values. Under those soil conditions, yieldresponse to P may be better correlated with the Mehlich-3 procedure. Samples extracted by the Mehlich-3procedure and analyzed by inductively coupled plasmaemission spectroscopy (ICP) result in higher valuesthan those analyzed by the colorimetric procedure. Thevalues obtained from ICP analysis cannot be adjusted tocolorimetric values by a numerical conversion. A thirdprocedure, referred to as the Olsen or sodium bicarbonate test, was developed for high-pH soils in westernstates and should not be used for acid soils. The resultsobtained with this test on high-pH soils are lower thanthose obtained with the Mehlich-3 procedure.lP hosphorus:The ammonium acetate test has been therecommended test. Research in Iowa has shown thatresults from the Mehlich-3 extractable K test are similarto the ammonium acetate test.lP otassium:Tests are available for most secondary nutrients and micronutrients, butinterpretation is less reliable than with tests for lime, P,and K. Complete field history and soil information areespecially important in interpreting results. Even thoughthese tests are less reliable, they may be useful in twoways. First is troubleshooting, or diagnosing symptomsof abnormal growth; paired samples representing areasof good and poor growth are needed for analyses. SecondlS econdary nutrients and micronutrients:94Illinois Agronomy Handbook
is “hidden-hunger checkup,” or identifying deficienciesbefore symptoms appear. Soil tests are of little value inindicating marginal levels of secondary nutrients and micronutrients when crop growth is apparently normal. Forthis purpose, plant analysis may yield more information.Interpreting soil test results and formulating soil treatment programs. A soil pH test reports soil reaction aspH units; phosphorus and K tests are typically reportedin pounds of element per acre. Formulate a soil treatmentprogram by preparing field soil test maps to observe areasof similar test levels that will benefit from similar applications. Areas with differences in soil test pH of 0.2 unit, Ptest of 10 pounds of P per acre, and K test of 30 pounds ofK per acre are reasonable to designate for separate treatment. See page 96 for suggested pH goals, page 100 for Pinformation, and page 103 for K information.Spatial variability in soil test results. When soil testvalues vary across a field, there are two patterns and twopossible ways to address the issue:definite pattern of distinct high- and low-test values indifferent parts of the field. This likely indicates differentsoil types or different past management practices. Splitthe fertilizer or lime application to treat each area differently to meet the specific needs.lA consistent pattern of high- and low-test values. Selectthe median test (the one that falls in the middle of aranking from low to high). If no explanation for largedifferences in tests is found, consider taking a new set ofsamples.lN oCation exchange capacity. Chemical elements exist in solution as cations (positively charged ions) or anions (negatively charged ions). In the soil solution, the plant nutrientshydrogen (H), Ca, Mg, K, ammonium (NH4), Fe, Mn, Zn,and Cu exist as cations. The same is true for non-plantnutrients such as sodium (Na), barium (Ba), and metals ofenvironmental concern, including mercury (Hg), cadmium(Cd), chromium (Cr), and others. Cation exchange capacity (CEC) is a measure of the amount of attraction for thesoil with these chemical elements.In soil, a high CEC is desirable, but not necessary, forhigh crop yields, as it is not a direct determining factorfor yield. CEC facilitates retention of positively chargedchemical elements from leaching, yet it gives nutrientsto a growing plant root by an exchange of H. Cationexchange capacity in soil arises from negatively chargedelectrostatic charges in minerals and organic matter.The CEC of organic residues is low but increases as theresidues convert to humus, which requires from 5 yearsto centuries. Thus, farming practices that reduce soil erosion and maintain soil humus favor the maintenance ofManaging Soil pH and Crop NutrientsCEC. It is influenced very little by fertilization, slightlydecreased with soil acidification, and slightly increasedwith liming.Depending on the amount of clay and humus, soil typeshave the following characteristic amounts of cation exchange (in units of milliequivalent per 100 grams of soil):l Sandysoils: less than 4silt-loam soils: 8 to 12l Dark-colored silt-loam soils: 15 to 22l Clay soils: 18 to 30l Light-coloredPlant AnalysisPlant analyses can be useful in diagnosing nutrientproblems, identifying hidden hunger, and determiningwhether current fertility programs are adequate. Criticaltissue-nutrient level (below which deficiency occurs) is theconcentration needed for a crop to complete its life cycle.These concentrations are largely independent of soil orgrowing conditions, so the values typically apply acrossenvironments and provide a more reliable measurement formicronutrients and secondary nutrients than do soil tests.How to sample. When diagnosing a fertility problemthrough plant analysis, select paired samples of comparable plant parts representing the abnormal and normalplants. Abnormal plants selected should represent the firststages of a problem. Samples taken at stages other thanthose described in Table 8.2 might not correlate with thesuggested critical nutrient levels.After collecting the samples, deliver them immediatelyto the laboratory. Samples should be air-dried if theycannot be delivered immediately or if they are going tobe shipped. Soil factors (fertility status, temperature, andmoisture) and plant factors (cultivar and developmentstage) may complicate the interpretation of plant analysisdata. The more information provided concerning a particular field, the more reliable the interpretation will be.Soil pHEffect of Soil Acidity on Plant GrowthSoil pH is a measure of the acidity or alkalinity of soil.Since pH is measured using a logarithmic scale, a decreaseof 1 unit of pH means that the acidity increases by a factorof 10, so small changes in pH values can have importantconsequences. For most of Illinois, soil acidification isa concern, as acidity is created by removal of bases byharvested crops, leaching, and an acid residual left in thesoil from N fertilizers. If surface soil pH is too high or toolow, the efficacy of some herbicides and other chemicalreactions may be affected. Also, soil acidity affects plant95
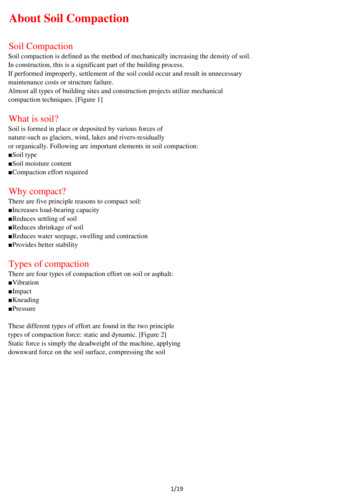
Table 8.2. Suggested critical plant nutrient levels for various crops and stages of sampling.N pm)B(ppm)Upper 6 in. at early bloom—0.252.001.000.250.22152520725Leaf opposite and belowthe ear at lly developed leaf andpetiole at early podding—0.252.000.400.250.15153020525WheatEntire aboveground portionat tillering4.70.223.200.360.120.15152525510CropPlant partAlfalfaCornN—nitrogen; P—phosphorus; K—potassium; Ca—calcium; Mg—magnesium; S—sulfur; Zn—zinc; Fe—iron; Mn—manganese; Cu—copper;B—boron.growth in several ways. Whenever soil pH is low (andacidity is high), several situations may exist:lT heconcentration of soluble metals, especially aluminum and Mn, may be toxic.lP opulationsand the activity of the organisms responsibleto transform N, S, and P to plant-available forms may bereduced.lC alciummay be deficient. Usually this occurs onlywhen the CEC of the soil is extremely low.lS ymbioticN fixation in legume crops is greatly impaired. The symbiotic relationship requires a narrowerrange of soil reaction than does the growth of plants notrelying on N fixation.lA cidicsoils—particularly those low in organic matter—are poorly aggregated and have poor tilth.For cropping systems with alfalfa, clover, or lespedeza,aim for a pH of 6.5 or higher unless the soils have a pHof 6.2 or higher without ever being limed. In those soils,neutral soil is just below plow depth; it probably will notbe necessary to apply limestone.Raising soil pH (liming). In addition to soil test value andcropping system, liming rates are determined based onsoil type, depth of tillage, and limestone quality. Suggested limestone rates for different soil types in Table 8.3 arebased on typical limestone quality and a tillage depth of 9inches. For details on adjusting rates to specific conditions,see table footnotes.Limestone quality is defined by its effective neutralizingvalue (ENV), a measurement of the neutralizing value andthe fineness of grind. The neutralizing value of limestoneis determined by its calcium carbonate (CaCO3) equiva-lT heavailability of mineral elements to plants may beaffected. Figure 8.3 shows the relationship betweensoil pH and nutrient availability (the wider the dark bar,the greater the nutrient availability). For example, theavailability of P is greatest in the pH range between 5.5and 7.5, dropping off below 5.5. In other words, for agiven soil, if P is applied at pH 6, there will be more ofit available than if the same amount is applied when thesoil pH is below 5.5. Because the availability of Mo isincreased greatly as soil acidity is decreased, Mo deficiencies usually can be corrected by liming.Suggested pH goals. A soil test every 4 years is thebest way to check pH levels. For cash grain systems andpasture grasses (not alfalfa or clover), maintaining a pH ofat least 6.0 is a realistic goal. If the soil test shows that thepH is 6.0 or less, apply limestone. After the initial investment, it costs little more to maintain a pH at 6.5 than at6.0. The profit over 10 years will be little affected becausethe increased yield will approximately offset the cost ofthe extra limestone plus interest. In contrast, a profitableyield response from raising the pH above 6.5 in cash grainsystems is agnesiumIronManganeseBoronCopper and ZincMolybdenum4.05.06.07.08.09.0pHFigure 8.3. Available nutrients in relation to pH.96Illinois Agronomy Handbook
Table 8.3. Suggested limestone rates based on soil type, pH, cropping system, and 9-inch depth of tillage.SoiltypeaSoil pH value4.54.64.74.84.95.05.15.25.3 5.4 5.55.65.75.85.96.06.16.26.36.46.57.0bTons of typical limestone to apply to grain farming systemsA8.08.08.08.08.08.07.87.06.3 5.5 04.5 4.0 03.6 3.3 62.4 2.2 2.01.81.61.41.21.0OptionalE4.03.63.22.82.42.0Tons of typical limestoneb to apply to forage farming systems (alfalfa, clover, lespedeza)A11.0 11.0 11.0 11.0 11.0 11.0 11.0 10.3 9.6 8.9 8.17.46.76.05.34.63.93.12.41.71.0OptionalB11.0 11.0 11.0 10.49.98.2 7.7 7.1 .18.78.27.87.36.9 6.4 6.0 55.35.04.84.54.3 4.0 3.8 94.33.83.22.72.1 1.6 1.09.38.8Note: If plowing is less than 9 in., reduce the amount; if it is more than 9 in., increase it. A chisel plow, disk, or field cultivator rather than a moldboard plow may not mix limestone deeper than 4 to 5 in.; for no-till or pasture systems, use the equivalent of a 3-in. tillage depth (one-third of theamount suggested).aSoil A: Dark-colored silty clays and silty clay loams (CEC 24). Soil B: Light- and medium-colored silty clays and silty clay loams; dark-coloredsilt and clay loams (CEC 15–24). Soil C: Light- and medium-colored silt and clay loams; dark- and medium-colored loams; dark-colored sandyloams (CEC 8–15). Soil D: Light-colored loams; light- and medium-colored sandy loams; sands (CEC 8). Soil E: Muck and peat. Soil color isusually related to organic matter.Light-colored soils 2.5% organic matter; medium-colored soils 2.5–4.5% organic matter; dark-colored soils 4.5% organic matter.bTypical limestone: 10% of the particles are greater than 8-mesh; 30% pass an 8-mesh and are held on 30-mesh; 30% pass a 30-mesh and are heldon 60-mesh; and 30% pass a 60-mesh. A calcium carbonate equivalent (total neutralizing power) of 90%. Effective neutralizing value (ENV) of thismaterial is 46.35 for 1 year after application, and 67.5 for 4 years after application. To correct the rate of application based on the ENV of the material available, follow calculations in the worksheet on page 98.lent: the higher this value, the greater the limestone’sability to neutralize soil acidity. The fineness of grinddetermines the rate of reaction: finer limestone will neutralize soil acidity faster. Relative efficiency factors havebeen determined for various particle sizes (Table 8.4). Ifyou are liming an acid soil just before seeding alfalfa, it isimportant to have highly reactive particles; the figures for1 year are the best guide. If you apply lime before corn,the 4-year values are adequate.The ENV can be calculated for any liming material byusing the efficiency factors in Table 8.4 and the CaCO3equivalent for the limestone in question. The IllinoisDepartment of Agriculture, in cooperation with the Illinois Department of Transportation, collects and analyzeslimestone samples from quarries that wish to participate inthe Illinois Voluntary Limestone Program. These analyses,along with the calculated correction factors, are availablefrom the Illinois Department of Agriculture, Bureau of Agricultural Products Inspection, P.O. Box 19281, Springfield,IL 62794-9281, in the annual publication Illinois VoluntaryLimestone Program Producer Information. To calculatethe ENV and the correction factor needed to determine rateof application for materials not reported in that publication,obtain the analysis of the material in question from theManaging Soil pH and Crop NutrientsTable 8.4. Efficiency factors for various limestoneparticle sizes.Efficiency factorParticle sizes1 yr afterapplication4 yr afterapplicationGreater than 8-mesh5158- to 30-mesh204530- to 60-mesh50100Passing 60-mesh100100supplier and use the worksheet for lime-rate calculation onpage 98 (or online at iah.ipm.illinois.edu/limestone rate).Examples of Rate CalculationAs an example, consider a limestone that has a CaCO3equivalent of 86.
92 Illinois Agronomy Handbook ity decrease, rendering nutrients less available to the crop. Portions of the plant nutrients are taken up as roots extract soil water to replenish water lost through the leaves. Cool air temperatures can lower evapotranspiration and reduce the co