Transcription
INFRARED SPECTROSCOPY(IR)Theory and Interpretation ofIR spectraASSIGNED READINGS Introduction to technique 25 (p. 833-834 inlab textbook) Uses of the Infrared Spectrum (p. 847-853) Look over pages 853-866 after viewing thispresentation for additional examples ofvarious functional groups. Emphasis is on data interpretation, not ondata memorization.1
ORGANIC STRUCTURE DETERMINATIONHow do we know: how atoms are connected together? Which bonds are single, double, or triple? What functional groups exist in themolecule? If we have a specific stereoisomer?The field of organic structure determination attemptsto answer these questions.INSTRUMENTAL METHODS OFSTRUCTURE DETERMINATION1.Nuclear Magnetic Resonance (NMR) – Excitation of the nucleus ofatoms through radiofrequency irradiation. Provides extensiveinformation about molecular structure and atom connectivity.2.Infrared Spectroscopy (IR) – Triggering molecular vibrationsthrough irradiation with infrared light. Provides mostly informationabout the presence or absence of certain functional groups.3.Mass spectrometry – Bombardment of the sample with electronsand detection of resulting molecular fragments. Provides informationabout molecular mass and atom connectivity.4.Ultraviolet spectroscopy (UV) – Promotion of electrons to higherenergy levels through irradiation of the molecule with ultraviolet light.Provides mostly information about the presence of conjugated πsystems and the presence of double and triple bonds.2
SPECTROSCOPY - Study of eDetectinginstrumentVisual (most common)representation, orSpectrumUpon irradiation with infrared light, certain bonds respondby vibrating faster. This response can be detected andtranslated into a visual representation called a spectrum.SPECTRUM INTERPRETATIONPROCESS1. Recognize a pattern.2. Associate patterns with physical parameters.3. Identify possible meanings, i.e. proposeexplanations.Once a spectrum is obtained, the main challenge is toextract the information it contains in abstract, or hidden form.This requires the recognition of certain patterns, theassociation of these patterns with physical parameters, andthe interpretation of these patterns in terms of meaningfuland logical explanations.3
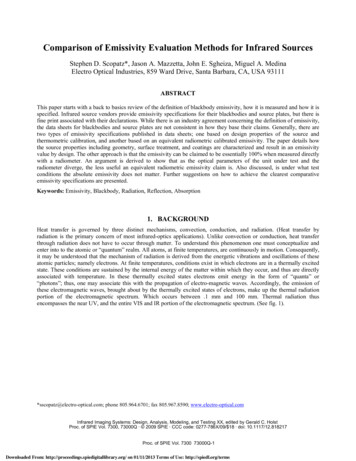
ELECTROMAGNETIC SPECTRUMMost organic spectroscopy uses electromagnetic energy, or radiation,as the physical stimulus.Electromagnetic energy (such as visible light) has no detectable masscomponent. In other words, it can be referred to as “pure energy.”Other types of radiation such as alpha rays, which consist of heliumnuclei, have a detectable mass component and therefore cannot becategorized as electromagnetic energy.The important parameters associated with electromagnetic radiation are: Energy (E): Energy is directly proportional to frequency, and inverselyproportional to wavelength, as indicated by the equation below. Frequency (μ) Wavelength (λ)E hμEFFECT OF ELECTROMAGNETIC RADIATIONON MOLECULESGraphics source: Wade, Jr., L.G. Organic Chemistry, 5th ed. Pearson Education Inc., 20034
Infrared radiation is largely thermal energy.It induces stronger molecular vibrations in covalent bonds, which canbe viewed as springs holding together two masses, or atoms.Specific bonds respond to (absorb) specific frequenciesGraphics source: Wade, Jr., L.G. Organic Chemistry, 5th ed. Pearson Education Inc., 2003VIBRATIONAL MODES Covalent bonds can vibrate in several modes, including stretching,rocking, and scissoring. The most useful bands in an infrared spectrum correspond tostretching frequencies, and those will be the ones we’ll focus on.Graphics source: Wade, Jr., L.G. Organic Chemistry, 5th ed. Pearson Education Inc., 20035
TRANSMISSION vs. ABSORPTIONWhen a chemical sample is exposed to the action of IR LIGHT, it canabsorb some frequencies and transmit the rest. Some of the light canalso be reflected back to the source.IRsourceChemicalsampleTransmitted lightDetectorFrom all the frequencies it receives, the chemical samplecan absorb (retain) specific frequencies and allow therest to pass through it (transmitted light).The detector detects the transmitted frequencies, and by doing so also reveals thevalues of the absorbed frequencies.AN IR SPECTRUM IN ABSORPTION MODEThe IR spectrum is basically a plot of transmitted (or absorbed) frequenciesvs. intensity of the transmission (or absorption). Frequencies appear in thex-axis in units of inverse centimeters (wavenumbers), and intensities areplotted on the y-axis in percentage units.The graph above shows a spectrum in absorption mode.6
AN IR SPECTRUM IN TRANSMISSION MODEThe graph above shows a spectrum in transmission mode.This is the most commonly used representation and the one found in mostchemistry and spectroscopy books. Therefore we will use this representation.CLASSIFICATION OF IR BANDSIR bands can be classified as strong (s), medium (m), or weak (w),depending on their relative intensities in the infrared spectrum. A strongband covers most of the y-axis. A medium band falls to about half of they-axis, and a weak band falls to about one third or less of the y-axis.7
INFRARED ACTIVE BONDSNot all covalent bonds display bands in the IR spectrum. Only polarbonds do so. These are referred to as IR active.The intensity of the bands depends on the magnitude of the dipolemoment associated with the bond in question: Strongly polar bonds such as carbonyl groups (C O) produce strongbands. Medium polarity bonds and asymmetric bonds produce mediumbands. Weakly polar bond and symmetric bonds produce weak or nonobservable bands.INFRARED BAND SHAPESInfrared band shapes come in various forms. Two of the most commonare narrow and broad. Narrow bands are thin and pointed, like adagger. Broad bands are wide and smoother.A typical example of a broad band is that displayed by O-H bonds, suchas those found in alcohols and carboxylic acids, as shown below.8
INFORMATION OBTAINED FROM IR SPECTRA IR is most useful in providing information about the presence orabsence of specific functional groups. IR can provide a molecular fingerprint that can be used whencomparing samples. If two pure samples display the same IRspectrum it can be argued that they are the same compound. IR does not provide detailed information or proof of molecularformula or structure. It provides information on molecular fragments,specifically functional groups. Therefore it is very limited in scope, and must be used in conjunctionwith other techniques to provide a more complete picture of themolecular structure.IR ABSORPTION RANGEThe typical IR absorption range for covalent bonds is 600 - 4000 cm-1. The graphshows the regions of the spectrum where the following types of bonds normallyabsorb. For example a sharp band around 2200-2400 cm-1 would indicate thepossible presence of a C-N or a C-C triple bond.Graphics source: Wade, Jr., L.G. Organic Chemistry, 5th ed. Pearson Education Inc., 20039
THE FINGERPRINT REGIONAlthough the entire IR spectrum can be used as a fingerprint for the purposes ofcomparing molecules, the 600 - 1400 cm-1 range is called the fingerprint region.This is normally a complex area showing many bands, frequently overlapping eachother. This complexity limits its use to that of a fingerprint, and should be ignored bybeginners when analyzing the spectrum. As a student, you should focus youranalysis on the rest of the spectrum, that is the region to the left of 1400 cm-1.Focus your analysis on this region. This is where most stretchingfrequencies appear.Fingerprint region: complex and difficult tointerpret reliably.Graphics source: Wade, Jr., L.G. Organic Chemistry, 6th ed. Pearson Prentice Hall Inc., 2006FUNCTIONAL GROUPS AND IR TABLESThe remainder of this presentation will be focused on the IRidentification of various functional groups such as alkenes, alcohols,ketones, carboxylic acids, etc. Basic knowledge of the structures andpolarities of these groups is assumed. If you need a refresher pleaseturn to your organic chemistry textbook. The inside cover of the Wadetextbook has a table of functional groups, and they are discussed indetail in ch. 2, pages 68 – 74 of the 6th edition.A table relating IR frequencies to specific covalent bonds can befound on p. 851 of your laboratory textbook. Pages 852 – 866 containa more detailed discussion of each type of bond, much like thediscussion in this presentation.10
IR SPECTRUM OF ALKANESAlkanes have no functional groups. Their IR spectrum displays only C-C and C-Hbond vibrations. Of these the most useful are the C-H bands, which appeararound 3000 cm-1. Since most organic molecules have such bonds, most organicmolecules will display those bands in their spectrum.Graphics source: Wade, Jr., L.G. Organic Chemistry, 5th ed. Pearson Education Inc., 2003IR SPECTRUM OF ALKENESBesides the presence of C-H bonds, alkenes also show sharp, medium bandscorresponding to the C C bond stretching vibration at about 1600-1700 cm-1.Some alkenes might also show a band for the C-H bond stretch, appearingaround 3080 cm-1 as shown below. However, this band could be obscured by thebroader bands appearing around 3000 cm-1 (see next slide)Graphics source: Wade, Jr., L.G. Organic Chemistry, 5th ed. Pearson Education Inc., 200311
IR SPECTRUM OF ALKENESThis spectrum shows that the band appearing around 3080 cm-1 can be obscuredby the broader bands appearing around 3000 cm-1.Graphics source: Wade, Jr., L.G. Organic Chemistry, 6th ed. Pearson Prentice Hall Inc., 2006IR SPECTRUM OF ALKYNESThe most prominent band in alkynes corresponds to the carbon-carbontriple bond. It shows as a sharp, weak band at about 2100 cm-1. Thereason it’s weak is because the triple bond is not very polar. In somecases, such as in highly symmetrical alkynes, it may not show at all due tothe low polarity of the triple bond associated with those alkynes.Terminal alkynes, that is to say those where the triple bond is at the end ofa carbon chain, have C-H bonds involving the sp carbon (the carbon thatforms part of the triple bond). Therefore they may also show a sharp, weakband at about 3300 cm-1 corresponding to the C-H stretch.Internal alkynes, that is those where the triple bond is in the middle of acarbon chain, do not have C-H bonds to the sp carbon and therefore lackthe aforementioned band.The following slide shows a comparison between an unsymmetricalterminal alkyne (1-octyne) and a symmetrical internal alkyne (4-octyne).12
IR SPECTRUM OF ALKYNESGraphics source: Wade, Jr., L.G. Organic Chemistry, 6th ed. Pearson Prentice Hall Inc., 2006IR SPECTRUM OF A NITRILEIn a manner very similar to alkynes, nitriles show a prominent band around 2250cm-1 caused by the CN triple bond. This band has a sharp, pointed shape justlike the alkyne C-C triple bond, but because the CN triple bond is more polar, thisband is stronger than in alkynes.Graphics source: Wade, Jr., L.G. Organic Chemistry, 6th ed. Pearson Prentice Hall Inc., 200613
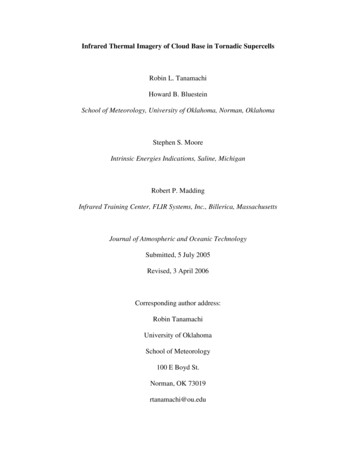
IR SPECTRUM OF AN ALCOHOLThe most prominent band in alcohols is due to the O-H bond, and it appears as astrong, broad band covering the range of about 3000 - 3700 cm-1. The sheer sizeand broad shape of the band dominate the IR spectrum and make it hard to miss.Graphics source: Wade, Jr., L.G. Organic Chemistry, 6th ed. Pearson Prentice Hall Inc., 2006IR SPECTRUM OF ALDEHYDES AND KETONESCarbonyl compounds are those that contain the C O functional group. Inaldehydes, this group is at the end of a carbon chain, whereas in ketones it’s inthe middle of the chain. As a result, the carbon in the C O bond of aldehydes isalso bonded to another carbon and a hydrogen, whereas the same carbon in aketone is bonded to two other carbons.Aldehydes and ketones show a strong, prominent, stake-shaped band around1710 - 1720 cm-1 (right in the middle of the spectrum). This band is due to thehighly polar C O bond. Because of its position, shape, and size, it is hard tomiss.Because aldehydes also contain a C-H bond to the sp2 carbon of the C O bond,they also show a pair of medium strength bands positioned about 2700 and 2800cm-1. These bands are missing in the spectrum of a ketone because the sp2carbon of the ketone lacks the C-H bond.The following slide shows a spectrum of an aldehyde and a ketone. Study thesimilarities and the differences so that you can distinguish between the two.14
IR SPECTRUM OF ALDEHYDES AND KETONESGraphics source: Wade, Jr., L.G. Organic Chemistry, 6th ed. Pearson Prentice Hall Inc., 2006IR SPECTRUM OF A CARBOXYLIC ACIDA carboxylic acid functional group combines the features of alcohols and ketonesbecause it has both the O-H bond and the C O bond. Therefore carboxylic acidsshow a very strong and broad band covering a wide range between 2800 and3500 cm-1 for the O-H stretch. At the same time they also show the stake-shapedband in the middle of the spectrum around 1710 cm-1 corresponding to the C Ostretch.Graphics source: Wade, Jr., L.G. Organic Chemistry, 6th ed. Pearson Prentice Hall Inc., 200615
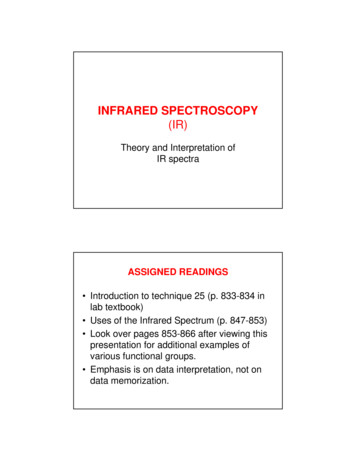
IR SPECTRA OF AMINESThe most characteristic band in amines is due to the N-H bond stretch, and it appears as aweak to medium, somewhat broad band (but not as broad as the O-H band of alcohols). Thisband is positioned at the left end of the spectrum, in the range of about 3200 - 3600 cm-1.Primary amines have two N-H bonds, therefore they typically show two spikes that make thisband resemble a molar tooth. Secondary amines have only one N-H bond, which makesthem show only one spike, resembling a canine tooth. Finally, tertiary amines have no N-Hbonds, and therefore this band is absent from the IR spectrum altogether. The spectrumbelow shows a secondary amine.Graphics source: Wade, Jr., L.G. Organic Chemistry, 6th ed. Pearson Prentice Hall Inc., 2006IR SPECTRUM OF AMIDESThe amide functional group combines the features of amines and ketones becauseit has both the N-H bond and the C O bond. Therefore amides show a verystrong, somewhat broad band at the left end of the spectrum, in the range between3100 and 3500 cm-1 for the N-H stretch. At the same time they also show thestake-shaped band in the middle of the spectrum around 1710 cm-1 for the C Ostretch. As with amines, primary amides show two spikes, whereas secondaryamides show only one spike.Graphics source: Wade, Jr., L.G. Organic Chemistry, 6th ed. Pearson Prentice Hall Inc., 200616
IR EXERCISE GUIDELINESNow that you are an IR whiz, you’re ready to download the IR InterpretationExercise posted in Dr. Cortes’ website and work on it. The due date isindicated in the syllabus. If you have any questions please ask Dr. Cortes oryour lab instructor.Go to http://utdallas.edu/ scortes/ochemHave fun, and good luck!17
turn to your organic chemistry textbook. The inside cover of the Wade textbook has a table of functional groups, and they are discussed in detail in ch. 2, pages 68 – 74 of the 6th edition. A table relating IR frequencies to specific covalent bonds can be found on p.