Transcription
Journal of Business Cases and ApplicationsVolume 24Netflix the battle for your free time: Strategy guided by customerlifetime valueMark R. YoungWinona State UniversityABSTRACTThis spreadsheet-based case study introduces students to calculating customer lifetimevalue (CLV) and assessing proposed marketing strategies based on their CLV impact. Key termsand calculations are introduced and illustrated using Netflix data. Students are encouraged torecreate the worked example within the case. The assignment uses current Netflix data to assessproposed strategies involving potential changes to price, content, cross selling, marketingspending, and introducing commercials. This case is intended for undergraduate marketingstudents who have completed Principles of Marketing and have basic spreadsheet skills. Aftercompleting this case, students should be able to:1. Explain customer lifetime value and the key terms that are associated with its calculation.2. Calculate customer lifetime value using a spreadsheet-based process.3. Assess the customer lifetime value impact of proposed marketing strategies.4. Recommend a marketing strategy given the customer lifetime value analyses of proposedstrategies.Keywords: customer lifetime value, marketing strategy analysis, spreadsheets, NetflixCopyright statement: Authors retain the copyright to the manuscripts published in AABRIjournals. Please see the AABRI Copyright Policy at http://www.aabri.com/copyright.htmlNetflix: Battle for your free time, Page 1
Journal of Business Cases and ApplicationsVolume 24INTRODUCTIONWhat do you do during your free time? For nearly half of American households andmillions of international subscribers, Netflix provides an attractive value proposition.Commercial free streaming of TV, movies, and video Netflix provides a real bargain in videoentertainment. Netflix’s business model is simple: acquire the rights to distribute relevantcontent from TV and movie corporations and stream it over the internet to paying customers. Aslong as the revenue from customers exceeds the cost to acquire and keep them, plus content cost,Netflix is successful.The competitive landscape is rapidly changing with content producers like Disney, CBS,and HBO now offering direct streaming of their content. Distributors of content, such as cable’sComcast Corp., Charter Communications and satellite businesses DirecTV and Dish, are alsostarting to create their own content, as well as the merger of companies in both industries such asATT and Time Warner. Competitors outside these traditional media and distribution industries,such as Amazon and Apple, are also emerging. Will content now owned by direct Netflixcompetitors still be available in the future? Will internet service providers like ATT slow downstreaming speeds and/or increase the cost of broadband to make their streaming services moreattractive? As the competitive rivalry heats up (200 streaming US companies), the US marketis also maturing (Netflix 49% weekly user penetration) suggesting the cost to acquire newcustomers will increase as well as the costs to deliver content.Given the competitive US market, Netflix is expanding rapidly into international markets.Each new market presents its own programing and delivery challenges and Netflix has beeninvesting in local content through local broadcasters. Their content strategy seems to be workingas their third quarter international streaming revenue grew by 49%, compared to 25%domestically. In addition to US and International Streaming divisions, Netflix still offers itsdomestic DVD mail order option.“Our job is to make Netflix stand out so that when consumers have free time, they choose tospend it with our service.”Netflix, IncEnhancing Netflix’s Value PropositionWhat are the key elements of Netflix’s value proposition and how can it be enhanced toremain on top of the streaming industry? At the core of Netflix’s value proposition are thealgorithms that mine the viewing data of subscribers (Likewhere Blog Post). In order to providepersonalized recommendations and a curated organization to the tremendous number ofprograming options, they save the subscriber time and develop a sense of affiliation with theNetflix community of watchers. This viewing data also provides a clear direction for Netflix bypurchasing relevant content and in creating its own content. Netflix spent over 12 billion oncontent in 2018, shifting more to original programing and relying less on licensed programingfrom rival competitors (Ramachandran and Maidenberg, 2018). Covering these rapidly growingcontent costs creates the imperative of an in-depth understanding of how to attract and retain itscustomers. Examining potential value proposition strategies should include an assessment of thestrategies effect on subscribers current and future relationship with Netflix. The monetary valueNetflix: Battle for your free time, Page 2
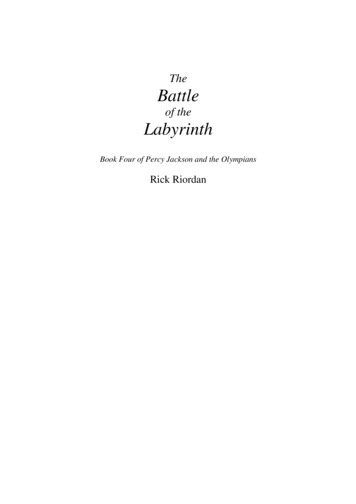
Journal of Business Cases and ApplicationsVolume 24of a customer can be summarized as Customer Lifetime Value. Will proposed strategies enhanceor diminish Customer Lifetime Value? What is a Netflix subscriber worth?CUSTOMER LIFETIME VALUE CALCULATIONGraphic 1 conceptually displays the CLV concept and there are various methods andformulas that can be used to estimate CLV. They vary in assumptions, data requirements andcalculations. The method illustrated in this case follows the traditional income statement formatand utilizes Excel (Figure 4). The following Customer Lifetime Value illustration andspreadsheet utilize Total Streaming data from Netflix’s 2017 Income State provided in Figure 5(Netflix Annual Report, 2018). Regardless of calculation method, CLV is an estimate of theprofitability of one customer over his/her relationship with the company.Customer Acquisition Cost (CAC)The cost to obtain new Netflix subscribers can be estimated by dividing the amount spenton marketing by the number of new customers acquired. CAC may also be referred to asMarketing Acquisition Cost (MAC). Most companies readily know the total budget spent onmarketing but must make an assumption on the percent attracting new customers versus retainingexisting customers. Netflix offers free trial periods, examples presented in Graphic 2, to attractnew customers, spends more than 1 billion on digital and traditional advertising campaigns, andcompensates partners for signing up new subscribers. In addition, spending on new content alsoattracts new subscribers and is critical for its success. From Figure 5, Netflix’s income statementprovides the amount spent on marketing ( 1,436,281,000 for 2017), whereas, the cost of contentis listed in the cost of revenues. For simplicity in this case analysis we will assume 90% of thetotal marketing spending was to acquire new customers and the remaining 10% was to retainexisting customers (referred to as Customer or Marketing Retention Costs).An estimate of the number of new customers is also needed to calculate CAC. Netflixprovides new and total membership data but does not publish Churn Rates (number of customerslost). An independent research company, Parks Associates (2015), estimates Churn rates for thisstreaming industry as presented in figure 2. Netflix’s 9% Churn Rate estimate can be varied tosee its effect on lifetime value.Netflix reports Paid Members, Paid net member additions, as well as Free Trials in theIncome Statement (Figure 5). Because the one-month free trials often result in cancelations andno revenue is generated they are not considered new members until they actually start paying.Netflix ended 2017 with Paid Members of 110,644,000 an increase of 21,554,00 over 2016.However, it also had to replace the customers who dropped during the year (9% churn);therefore, an additional 8,018,100 (9% of 2016 Paid Members 89,090,000) new customers had tohave been acquired. Thus, for 2017, Netflix acquired 29,572,100 (8,018,100 21,544,000) newcustomers. In Figure 4, this is calculated in cell B9.Customer Acquisition Cost for 2017 can be estimated as 90% of the Total StreamingMarketing budget divided by the number of new customers (90% X 1,436,281,000 / 29,562,100 43.71). In Figure 4, this is calculated in cell B15. Thus, Netflix’s spends 44 to acquire anew customer. Typically, CAC increases as a market matures thus the domestic streamingmarket may be quite different from the international market. Acquiring new customers, atNetflix: Battle for your free time, Page 3
Journal of Business Cases and ApplicationsVolume 24reasonable costs, and managing Churn is the key challenge that all subscription-based businessesface.Revenue per CustomerGraphic 3 displays the three different Netflix pricing plans with different monthly pricesprimarily differentiated by number of users simultaneously streaming per account and HDcontent. Prices were raised in January 2019. The average annual revenue per payingmembership is the Total Streaming Revenue divided by the Number of Paid Members( 11,242,216,000 / 110,644,000 101.61), Figure 4 cell C13.Gross Profit per Customer (GPM)Revenue minus Cost of Revenue equals Gross Profits. Gross Profit can be expressed as apercent of Revenue, referred to as Gross Profit Margin (GPM). For the Total Stream division in2017, GPM ( 11,242,216,000 - 7,830,475,000) / 11,242,216,000 30.35%). The GPM canthen be multiplied by average revenue per member to calculate yearly gross profit permembership ( 101.61 X 30.35% 30.84), Figure 4 cell C14.Marketing Retention Cost (MRC)The cost to maintain and keep the customer is also referred to as Customer RetentionCosts (CRC). Examples include reminder advertising, billing, customer service, andcommunications of new programming to existing customers. Recall that this case analysisassumed 10% of the marketing budget was specifically targeted at keeping existing customers(10% X 1,436,281,000 / 110,644,000 1.30 per customer per year), Figure 4 cell C16.Netflix might also consider some of the content creation as retention costs; however, all of thecontent costs is included in the Costs of Revenues.Retention Rate (RR)Retention Rate is the percent of customers who remain loyal and continue to subscribefrom time period to time period. The Retention Rate is the complement to Churn. RetentionRate 1 – Churn Rate. Our estimate of 9% Churn for Netflix implies that the Retention Rate is91%. Retention rates are a reaction to the value proposition after customers have tried Netflixservice. For subscription-based businesses, this is very high indicating their value propositionmeets or exceeds customer expectations. The first time period retention is always 100%, cellC17. Each time period afterwards is the retention rate times the previous time period’s retentionrate. Year 2 is 91% times 100% 91%, cell D17; year 3 is 91% times 91% 83%, cell E17;year 4 is 91% times 83% 75%, cell F17; etc.Customer Lifetime (LT)A common assumption in calculating CLV is that the lifetime of a customer is estimatedby LT 1 / (1- Retention Rate). For Netflix, this implies an 11.1-year life (1 / (1-.91)). ParksAssociates estimates average length of time subscribing to Netflix at 42 months, Figure 3. GivenNetflix: Battle for your free time, Page 4
Journal of Business Cases and ApplicationsVolume 24uncertainty in the competitive marketplace, many companies will cap estimates of customerlifetimes at some reasonable time such as 3 to 5 years even if they generate high retention rates.In this case example we will assume a 4-year life time.Net Marketing Contribution (NMC)Gross Profit minus the Marketing Retention Costs provides Net Marketing Contribution,which is adjusted for retention rates by multiplying it times the time period’s retention rate.(Year 1: NMC ( 30.84 - 1.30) X 100% 29.54, cell C18; Year 2: NMC ( 30.84 - 1.30)X 91% 26.88, cell D18; etc.).Net Present Value (NPV)CLV is an estimate of the forecasted profit of customers in the future. Given the timevalue of money, Net Present Value allows us to discount future profits back into today’s dollars(Net Present Value Net Marketing Contribution / (1 Discount Rate) time period). TheDiscount rate is the cost of capital for a particular company. It can be found online for mostpublic companies, e.g. gurufocus.com lists Netflix’s weighted average cost of capital as 9.75%.Using this discount rate the NPV for Year 1 ( 29.54) / (1 .0975) 1 26.91), cell C19.Thus, the net marketing contribution of 29.54 received after year 1 is worth 26.91 in today’sdollars. Year 2 ( 26.88) / (1 .0975) 2 22.32), cell D19.Customer Lifetime Value (CLV)CLV is the cumulated sum of the discounted future profits over the life time of thecustomer, minus the cost of acquiring the customer. The CLV spreadsheet in figure 4 followsthe company’s income statement format, providing a complete listing of the factors impactingCLV, and provides flexibility in varying the different elements impacting the value proposition.The last row in the spreadsheet adds the NPV from one time period to the CLV from theprevious time period; therefore, the final time period is a sum of the all the NPVs, which is theCLV. If we assume constant revenue and margins over the customer’s 4-year life, thespreadsheet in Figure 4 can be used to estimate the 2017 Total Streaming division’s CLV 39.36, cell F20.Customer Equity (CE)CLV is the worth of one customer; whereas, Customer Equity is the sum of all thecompany’s customer lifetime values. CE represents the company’s future earning potentialbased on its Customer Relationship Management strategy and capability (Multiply the CLVtimes the number of customers). It can be calculated for the company overall or for eachcustomer segment and then summed. Netflix’s 2017 Total Streaming CLV was 39.36 with110,644,000 subscribers thus providing CE 4,355,068,000, cell B22.Figure 4 presents the above concepts in the form of an Excel spreadsheet. The numbersin the top box are from Figure 5
Netflix ended 2017 with Paid Members of 110,644,000 an increase of 21,554,00 over 2016. However, it also had to replace the customers who dropped during the year (9% churn); therefore, an additional 8,018,100 (9% of 2016 Paid Members 89,090,000) new customers had to