Transcription
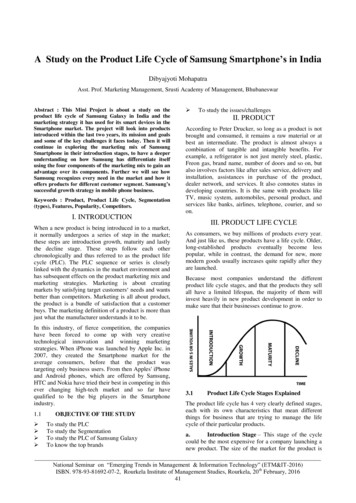
Shackleton, N.J., Curry, W.B., Richter, C., and Bralower, T.J. (Eds.), 1997Proceedings of the Ocean Drilling Program, Scientific Results, Vol. 1549. LIFE CYCLE(S) OF SEDIMENT PHYSICAL PROPERTIES, CEARA RISE1Timothy D. Herbert,2 Steven DiDonna,3 Franck Bassinot,4 Jens Gruetzner,5 and Kate Moran6ABSTRACTSediments recovered during Leg 154 exhibit an unusually wide variation of interbedded lithologies down to the deepestlayers recovered (900-m burial depth). We report here on relations of properties as a function of lithology and burial depth.Lithologies have been characterized by a large number of carbonate determinations on samples used for discrete physical properties measurements. Carbonate determinations have been supplemented by quartz determinations using infrared spectroscopy,and by shipboard determinations of biogenic opal content. Physical properties show coherent patterns with carbonate contentover discrete zones that average several hundred meters of thickness. The relation between seismic velocities and carbonatecontent is strong enough to detect a velocity calibration problem for an interval of Site 925 shipboard measurements.The shallowest Ceara Rise sediments show a weak positive dependency of bulk density and a more pronounced positiverelationship of seismic velocities on carbonate content. The difference between bulk-density and carbonate relations on CearaRise and well-known relations established in siliceous settings can be explained by the high quartz contents (15%-16% on acarbonate-free basis) of the Pleistocene section.For each type of physical property, inversions are encountered, where the sense of the correlation between property andlithology changes. For example, both bulk densities and seismic velocities become negatively correlated to carbonate content atdepths of 100-250 meters below seaßoor on the Ceara Rise, but then become positively correlated on further burial. Theseinversions are interpreted to result from the competition between mechanical and chemical compaction in pelagic sediments.Bulk density, in particular, shows a complex evolution with depth that often results in a parabolic relation of density to carbonate content in more deeply buried Ceara Rise sediments. Nevertheless, the relations between physical properties and carbonatecontent on Ceara Rise are sufÞciently systematic that predictive models can be generated to relate lithology to signals sensed byborehole logging tools and by seismic imaging.INTRODUCTIONMeasurements of sediment physical properties describe in variousways the density of sediment particles, their packing relations, andconnections between particles. These quantities are of fundamentalimportance to paleoceanographic, geochemical, and geophysical investigations of pelagic sediments. The dry bulk density of sediments,in addition to sedimentation rate, is a crucial parameter for reconstructing sediment fluxes over time. Paleoceanographers devote considerable effort to refining stratigraphies and to assessing uncertainties in dating that can affect sedimentation rate. Only some are aware,however, that variation in bulk density as a function of sediment typeand burial depth can be an equally, and in some cases, more importantcomponent of the mass accumulation equation. Accurate characterization of diagenetic transformations in pelagic sediments also depends on a good understanding of physical properties. For example,diagenetic equations coupling reactions with diffusion through porefluids require that diffusion coefficients be modified for porosity andtortuosity effects (cf. Berner, 1980). Stratigraphic variations in pelagic sediments can be imaged by seismic techniques, but here againgood models relating physical properties such as bulk density andseismic velocity to both primary and diagenetic controls are essentialfor interpretation of reflection profiles (Mayer, 1979; Fulthorpe et al.,1989; Nobes et al., 1991).1 Shackleton, N.J., Curry, W.B., Richter, C., and Bralower, T.J. (Eds.), 1997. Proc.ODP, Sci. Results, 154: College Station, TX (Ocean Drilling Program).2 Department of Geological Sciences, Brown University, Providence, RI 02912,U.S.A. Timothy Herbert@brown.edu3 Geoscience Research Division, Scripps Institution of Oceanography, La Jolla, CA92093-0215, U.S.A.4 Centre des Faibles Radioactivites, 91198 Gif-sur-Yvette, France.5 GEOMAR, Wischhofstra§e 1-3, D-24148 Kiel, Federal Republic of Germany.6 Bedford Institute of Oceanography, New Bedford, Canada.Previous ChapterGeneralized curves of pelagic sediment physical properties trendswith burial depth have been available for some time (Hamilton, 1974,1976), but these do not do justice to the variability and structure ofphysical properties encountered by deep-sea sampling. The severedisturbance caused by rotary coring in the upper hundreds of metersof the sediment column damaged all but the most evident trends inphysical properties data collected by the Deep Sea Drilling Project.Hydraulic piston coring by the Ocean Drilling Program (ODP) has revealed for the first time the full complexity of the physical evolutionof pelagic sediments. It is now clear that initial differences in the fabric of pelagic sediments are related to differences in lithology, highfrequency variations in physical properties exist in the sediment column, and primary differences in physical properties persist throughat least some stages of compaction (Mienert, 1984; Wilkens andHandyside, 1985; Mayer, 1991; Herbert and Mayer, 1991; Nobes etal., 1991; Rack and Palmer-Julson, 1992; Taylor, 1991). Some simple relations often apply. For example, the porosity and bulk densityof equatorial Pacific sediments can be modeled as a mixing of twoend-member types of material, carbonate and biosiliceous-terrigenous components, with characteristic packing geometries (Mayer,1991; Herbert and Mayer, 1991). Variations in bulk density and seismic velocity as a function of depth in such settings are functions ofthe composition of the sediment (Lyle and Dymond, 1976; Mayer,1979; Mienert, 1984; Nobes, 1989).Sediments recovered by Leg 154 provide a chance to expand ourknowledge of how physical properties variation is determined bylithological variability and diagenetic changes (Fig. 1). Leg 154 sediments are characterized by an essentially continuous alternation oflithologies at a decimeter scale, to burial depths approaching a kilometer (Fig. 1A). However, they are quite different from the mixed siliceous-carbonate sediments studied extensively in previous physicalproperties-sediment-type studies (e.g., Mayer, 1979; Mienert, 1984;Nobes et al., 1991; Rack and Palmer-Julson, 1992). Figure 1B displays corrected bulk densities (see below) measured on discrete sam-Table of ContentsNext Chapter157
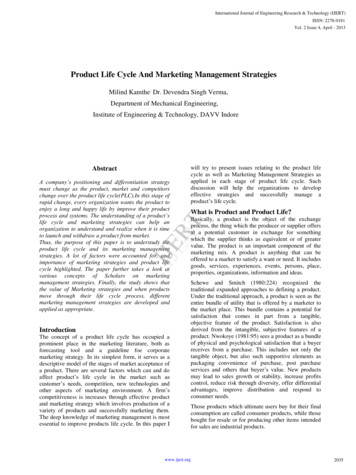
T.D. HERBERT ET AL.Figure 1. A. Estimated carbonate content (from calibrationof color reflectance data to measured percent carbonate) atSite 925. Ceara Rise sediments consist of alternating beds ofvarying carbonate content. B. Variations in the initial bulkdensity and subsequent compaction behavior can influencephysical properties trends with depth, such as the bulk density profile (estimated from discrete samples).ples at Site 925. As with other physical properties, there is a generalmonotonic trend of bulk density with depth that is related to mechanical and chemical compaction of the sediments. The focus of this contribution is to gain a better understanding of the factors that controlchanges in depth-dependent gradients as well as in sample-to-sampledepartures from monotonic trends of physical properties in a predominantly carbonate–terrigenous sediment province. Because compaction behavior in this sedimentary setting has not been well definedbefore, some surprises can be expected.SIMPLE MODEL FOR RELATIONSBETWEEN PHYSICAL PROPERTIESAND LITHOLOGY IN PELAGIC SEDIMENTSAs we will demonstrate below, Leg 154 physical properties measurements indicate that there are coherent relations of physical properties variations with sediment type, but that these evolve significantly with burial depth. We will focus our analysis on inversions of sediment physical properties as a function of depth at the Ceara Rise.The first scale we will define as the vertical dimension of bedding,where different lithologies may be juxtaposed on a scale of 10 20 cmwith virtually no difference in diagenetic boundary conditions suchas overburden, pore water chemistry, or temperature. On this scale,inversions can occur where physical parameters deviate from simpleexponential or other monotonic functions of burial depth. In many,but not all, cases, the fine-scale inversions are dictated by “Milankovitch” cycles in sediment composition.So long as the physical properties of different end-member lithologies evolve in parallel with depth, simple rules can be constructed topredict physical properties from knowledge of sediment composition, or to invert the physical properties data to estimate lithology(Mayer, 1991; Herbert and Mayer, 1991). For example, Figure 2Ashows that varying mixtures of end-members A and B would producea range of intermediate physical properties measurements as a function of depth. Although both end-members show a monotonic physical properties trend with depth, inversions could occur when, for ex-158ample, the sediment switched from an overlying composition of nearly pure end-member lithology B to nearly pure end-member A.Typical scales for such physical properties inversions or anomaliesare decimeters to several tens of meters.Figure 3 shows typical relations between a simple index of lithology, carbonate content, and bulk density in near surface ( 20 metersbelow seafloor [mbsf] burial depth) pelagic sediments from severallocations. Each sediment province has a curvilinear relation betweensediment bulk density and carbonate, with a different intercept at thecarbonate-free end of the curve. The bulk density at the pure carbonate end-member is thus a pivot point; the bulk density of the noncarbonate components is the lever in the system. Grain density variations between major noncarbonate minerals in pelagic sediments aretoo small to cause the variability in bulk densities (Herbert and Mayer, 1991); rather packing geometry (porosity) must vary as a functionof mineralogy (in mineralogy, we have grouped a number of relatedfeatures such as grain size, grain shape, and electrostatic forces). Thebulk densities of the noncarbonate fraction vary because the characteristic packing densities of opal (seen in data from the equatorial Pacific) are different from a mixed opal-clay end-member (seen in datafrom the tropical Atlantic) and are further distinguished from thepacking of a nearly pure clay end-member (north central Atlantic).Physical properties variations on the first scale, therefore, can arisesimply by changing the sediment composition over time. For example, climatically driven carbonate-silica cycles in the equatorial Pacific lead to substantial bulk density oscillations around the mean(Mayer, 1991; Herbert and Mayer, 1991; Hagelberg et al., 1995).A second scale of inversion encountered on Ceara Rise occurswhen boundaries in the burial cycle of sediments are crossed. In thelatter case, the relation between lithology and physical propertieschanges sense over a transition zone of relatively short length (Fig.2B). Note that inversion zones may occur when both end-membersfollow monotonic trends of physical properties with depth, but withdifferent slopes; an abrupt change in physical properties with depth isnot required. Systematic relations between physical properties andsediment type are again observed, but with opposite sense on either
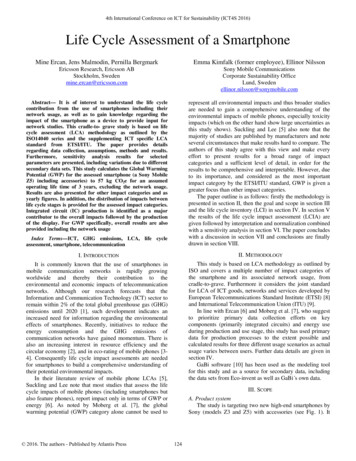
LIFE CYCLE(S) OF SEDIMENT PHYSICAL PROPERTIESFigure 2. A. Idealized two-component system,where end-member lithologies have significantlydifferent physical properties that evolve in parallel with depth. Oscillations in the measuredproperty can be mapped as a mixing of the twoend-member sediment types, with an appropriatedepth correction. An example of such a system isthe bulk density–carbonate relation in equatorialPacific sediments. Sediment physical propertiescould be predicted from measurements of endmember percentages, or end-member percentages could be estimated from physical propertiesmeasurements. B. If the slopes of the end-member physical properties curves as a function ofdepth are not parallel, then inversions can occur.Physical properties variations in the sedimentcolumn still match changes in the lithology, butwith a different sense on opposite sides of theinversion zone.1.7Bulk Density (g/cc)1.61.5N.-C. Atl. (clay)1.4Eq. Pac. (siliceous)1.3Trop. Atl. (siliceous/clay)1.2Ceara Rise sediments, although the surficial bulk density–carbonateinversion is accomplished within 40 m of the sediment-water interface (see below).We contend that the simplest way of relating physical propertiesvariations to lithology in Ceara Rise sediments is by measuring or estimating carbonate content. We recognize that using carbonate as themaster variable hides many details of importance—for example,grain size, clay mineralogy, and others. Indeed, the presence of biosiliceous material in intervals of the middle Miocene and early Oligocene/late Eocene at Ceara Rise significantly alters the carbonate physical properties relations at Site 929 (Curry, Shackleton, Richter,et al., 1995). Nevertheless, we will show that most variance of physical properties variations as a function of burial depth in sedimentssimilar to those recovered by Leg 154 can be described by measuringor estimating carbonate content. We have implicitly assumed that either noncarbonate mineralogy does not change substantiallydownsection or that such changes do not affect physical propertiestrends to a significant degree.METHODS1.1020406080100Carbonate Content and Noncarbonate Mineralogy% CaCO3Figure 3. Typical bulk density–carbonate relations seen in uncompactedpelagic sediments with different noncarbonate components (following Herbert and Mayer, 1991). The greatest sensitivity of bulk density to carbonatecontent occurs in the highly siliceous equatorial Pacific sediments; lowersensitivities in other settings reflect the absence of opaline silica and theadmixture of quartz. Equatorial Pacific (Eq. Pac.) data modeled from resultsof DSDP Leg 85 and ODP Leg 138, tropical Atlantic (Trop. Atl.) data modeled from results of ODP Leg 108, and north-central Atlantic (N.-C. Atl.)data modeled from results of DSDP Leg 94.side of the inversion. These inversions are highly significant, becauseerroneous application of rules developed from sampling one intervalof the sediment column could seriously misrepresent the physicalstate of the other, and could confound efforts to predict lithologiesfrom physical properties information. Zones bounded by such physical properties inversions are typically hundreds of meters thick inCarbonate determinations are taken from shipboard measurements through coulometric determinations made at the Scripps Institution of Oceanography (SIO) and from those of other shore-basedstudies. For this study, we concentrated on determining carbonatecontents on the same samples used for bulk density and seismic velocity analyses at Site 925. In addition, we used proxy measurementsof carbonate to substantiate the results obtained from Site 925 at otherCeara Rise sites. Calibrations of reflectance, natural gamma counts,and magnetic susceptibility to carbonate content can be made by relating the proxy measurements to discrete carbonate measurements.Both natural gamma measurements and magnetic susceptibility arevolume measurements; carbonate content is naturally a weight measure. The significance of a given natural gamma count or susceptibility reading is rather different in surficial sediments, which containnearly 80% water by volume, as compared to the same measurementin lithified sediments. Rather than applying a continuous porositycorrection to natural gamma and magnetic susceptibility data, wehave chosen to use color reflectance, which seems not to require a po-159
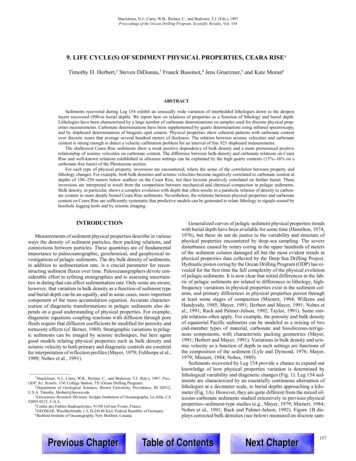
T.D. HERBERT ET AL.rosity adjustment, as our index of carbonate content. We use astretched exponential fit of reflectance at 700 nm to carbonate contentat each site (of the form R C1 exp(%CaCO3 · C2). The typical correlation coefficient of the fits is about 0.9.Because previous work suggested that quartz in pelagic sedimentscan significantly reduce porosity in comparison to a pure clay matrix(Herbert and Mayer, 1991), we also estimated the quartz percentage(on a carbonate-free basis) of 50 samples from Site 925. Sampleswere made into KBr disks by mixing powdered, carbonate-free residue with spectroscopic grade KBr at a ratio of 0.5% sample to 99.5%KBr. Disks were analyzed using a Perkin-Elmer Fourier TransformInfrared (FTIR) spectrometer. To estimate quartz content, we usedabsorbance at wavenumbers 800 and 780 cm 1, calibrated to finelyground quartz standards (Herbert et al., 1992). Analyses of replicatedisks suggest that the FTIR method provides results with a relativeuncertainty of about 5%.Biogenic opal estimates were obtained from shipboard geochemical determinations, shipboard smear-slide estimates, and FTIR analyses at SIO of selected Site 925 samples. Only a small fraction of thesections studied contain appreciable (10% 30% on a carbonate-freebasis) amounts of biogenic silica.observe the largest deviations in samples analyzed for wet volume bypycnometer: calculated grain densities range as high as 3.40 g/cm3and as low as 2.3 g/cm3 in the upper 100 mbsf of sediment (Curry,Shackleton, Richter, et al., 1995).We suspect that the pycnometer may not always produce reliableestimates of wet volume and have modified some density estimatesfrom those reported in the Initial Reports volume. More detailedanalyses than ours have indicated that pycnometer results on wetsamples often give internally inconsistent and suspect results for index properties (O’Brien and Manghnani, 1992; Nobes et al., 1992;Bassinot et al., 1993). However, Nobes et al. (1992) confirm that thepycnometer gives accurate volume determinations on dry samples.As a check on grain densities, we measured the dry volume of a number of samples with the pycnometer (Table 1). With the exception ofa few samples rich in biosiliceous material (Cores 154-929A-51Xand 52X), all gave estimates of almost exactly 2.7 g/cm3. Therefore,we have reestimated bulk density using this measured grain densityand the wet and dry weights of physical properties samples accordingto the following relations:Porosity ( φ ) ( WW – DW ) ( GD ) ( [ WW – DW ] GD DW [ GD – 1.025 ] – WW 0.025 ) ,Edited MST DataBoth gamma-ray attenuation porosity evaluator (GRAPE) densityand P-wave logger data from Leg 154 suffered from calibration problems. In addition, the GRAPE detector often showed periods of erratic behavior suggestive of power supply problems and of electrical interference with other MST sensors. GRAPE data are still useful, provided that they are carefully edited with an eye to agreement withdiscrete measurements, to continuity of data, and to agreement withvalues obtained on offset holes. The data evaluated here have beenscreened to edit the effects of core disturbance (most frequently encountered in the top 20 75 cm of advanced hydraulic piston corer[APC] and extended rotary barrel [XCB] cores), fractures, and instrumental malfunctions. Where multiple GRAPE determinations weremade on one point of a core, as happened during the long countingtimes for natural gamma measurements, we found that the GRAPEdensity tended to increase from beginning to end. After carefullycomparing data for internal consistency with GRAPE estimates justbefore and after the interval of multiple recordings, and for consistency with discrete measurements, we decided to discard all replicatevalues except the last. The cause for drift is unknown, but may involve sensor interference.P-wave logger data need to be continuously adjusted to discretemeasurements to give reliable low-frequency estimates of velocities(see Grutzner et al., this volume). However, because we are especially interested in the relative sense of velocity anomalies with changesin lithology, we found that P-wave logger measurements were veryuseful for confirming at high resolution the velocity–carbonate relations that will be detailed later using discrete measurements.Bulk Density–Porosity RelationsVolumes used to compute densities during the Leg 154 cruisewere determined by three methods: by pycnometer in the shallowestparts of the recovered sections, by constant-volume cylinder in somewhat more consolidated intervals, and by measuring the dimensionsof sawed cubes in more lithified sections. Dry density and mineralgrain density are indirectly determined from wet and dry weights andthe volume estimates. The variance of grain density estimates is agood indication of measurement accuracy, because with only a fewexceptions (not typical of the dominant components of most Leg 154sediments), the grain density of common pelagic sediment mineralsranges from 2.6 to 2.7 g/cm3. Large scatter and implausible grain densities usually indicate volume and/or weight measurement errors. We160Dry density ( 1 – φ ) GD,andBulk density ( 1 – φ ) GD φ 0.025,where WW is the measured wet weight of the sample, DW is theweight after drying at 100 C overnight, GD is the average mineralgrain density, 1.025 g/cm3 is the density of seawater, and 0.025 is thecontribution of sea salt to pore fluid density.GRAPE estimates of bulk density can be converted to dry densityor porosity estimates using our measured average of 2.7 g/cm3 for average grain density at Ceara Rise (see Boyce [1976] or Herbert andMayer [1991] for equations relating bulk, dry, and grain densities). Itis important to note that in most cases the differences between ournew estimates and shipboard results are small. The primary effect isto reduce erroneous variance in calculations of bulk density, dry density, and porosity. This increase in precision gives an important gainin detecting the lithologic dependence of relatively small (order of2% 3% around the mean) deviations of discrete bulk densities froma monotonic function of depth.EVOLUTION OF PHYSICAL PROPERTIESBulk Density–PorosityContrary to the results of ODP drilling in many other locations,there is not a strong positive relationship between bulk density andcarbonate content on the Ceara Rise, and what relationship does existquickly inverts in the zone of mechanical compaction. GRAPE density logs cannot be used to estimate carbonate content reliably for Leg154 cores, as they can elsewhere (cf. Mayer, 1991; Herbert and Mayer, 1991; Hagelberg et al., 1995). Why does the frequent density–carbonate relationship fall apart on Ceara Rise? There appear to be twomain reasons. First, the Ceara Rise sediments are unusually “muddy”—carbonate contents in the upper 10 mbsf do not exceed 50%,and average only about 30%. A glance at established carbonate–density relations reveals that bulk density is generally not a very sensitiveindex of carbonate content below 50% in most settings because of thecurvilinear form of the relation (Fig. 3). A second, and perhaps decisive factor, is the presence of large amounts of terrigenous quartz inCeara Rise surficial sediments. Our FTIR results indicate that an average of 16% of the noncarbonate fraction consists of quartz over the
LIFE CYCLE(S) OF SEDIMENT PHYSICAL PROPERTIESTable 1. Grain densities measured by pycnometer on dry samples.Core, section,interval 3)154-926B9H-5, 107 10922H-3, 121 123 24H-3, 42 4425H-3, 61 6327H-5, 117 11929X-1, 40 4229X-4, 74 7629X-5, 145 14732X-7, 10 1234X-1, 102 10434X-3, 141 14335X-1, 117 11935X-2, 58 6036X-1, 137 13936X-4, 25 2741X-1, 53 5549X-4, 40 4250X-5, 132 13450X-6, 25 2755X-4, 47 4956X-6, 55 5758X-3, 148 15058X-1, 120 12260X-1, 46 4880.57209.89 2, 81–83 4H-2, 114 11617H-5, 139 141 18H-3, 46 4821.81 31.64159.89 7, 39 4126X-2, 53 5527X-4, 145 14729X-CC, 5 731X-1, 42 4431X-6, 70 7232X-2, 114 11644X-5, 141 14344X-6, 142 14446X-4, 144 662.6932.7292.715154-929A25X-4, 126 12835X-6, 63 6536X-1, 97 9937X-6, 39 4141X-1, 75 7744X-3, 26 2844X-4, 101 10347X-3, 59 6148X-2, 42 4451X-4, 44 4651X-5, 104 10651X-6, 15 1752X-1, 26 2852X-6, 30 3253X-2, 70 7253X-4, 12 1454X-3, 14 1654X-4, 94 54-929B6H-2, 20 22 6H-4, 81 8349.18 52.81Note: composite of two or more samples at indicated depths.upper 200 mbsf at the Ceara Rise drill sites. Unlike clay minerals,quartz tends to produce a tight packing fabric. One of the prime factors that can differentiate the packing of carbonate-rich and carbonate-poor pelagic sediments is therefore greatly reduced at the CearaRise. Thus, although there is demonstrably an initial positive correspondence between bulk density anomalies and positive excursionsin estimated carbonate content in Leg 154 records (Figs. 4, 5), it isweak. It seems likely that it is the high quartz content of Ceara Risesediments that leads to the first of the larger scale inversions in sediment–physical properties relationships observed on Leg 154.The first 100 mbsf of the sediment column on Ceara Rise has arapid increase in bulk density (Fig. 1B). To separate the effect ofdecimeter-scale variations in carbonate content from gradual compactional effects, we fit a smooth spline function to GRAPE profiles,and recalculated GRAPE variations as anomalies from the trends. Weused GRAPE and reflectance data because discrete measurementswere too sparse to capture the depth evolution of bulk density in theupper 100 mbsf. Deviations of individual bulk density measurementsfrom a smooth trend give negative anomalies if the measured sampleis less dense (more porous) than expected and positive if it moredense (less porous). When anomalies are compared to estimated carbonate content in 10-m windows of data, it becomes clear that the initial weak positive correlation of bulk density to carbonate content becomes inverted to a stronger, negative correlation with a few tens ofmeters of burial (Fig. 5). A transition zone from about 30 to 60 mbsfat Hole 929A shows large scatter before the deeper relationship becomes well defined. This changing sense of the bulk density carbonate relationship indicates that mechanical compaction by rearrangement of grains proceeds more efficiently in the less calcareous intervals in Ceara Rise sediments. The tighter packing of carbonate-poorintervals below the inversion is, we suspect, greatly enhanced by theabundance of quartz (note that the internal porosity provided by biogenic carbonate particles may also play a role in creating relative differences in porosity and bulk density at depth, but that our conclusionthat the carbonate-free layers suffer relatively more mechanical compaction remains valid).Two processes determine the density and porosity at a givendepth. Mechanical compaction becomes significant within 10 20 mof the surface, and favors compaction of the less calcareous zones inCeara Rise sediments (Fig. 5), with the exception of siliceous intervals. Note that by 100-m burial depth, a pure carbonate would be lessdense by about 0.15 g/cm3 than would a clay and/or quartz end-member. Associated signatures of mechanical compaction are increasedseismic velocities and increased seismic anisotropy (see below).Chemical compaction, which favors more calcareous intervals, doesnot become a significant porosity-reducing process until a burialdepth of at least 300 m. In addition to affecting bulk density and porosity, chemical compaction increases seismic velocities without increasing anisotropy. Because the mechanical and chemical processesoperate with different depth dependencies, a rather complex relationbetween bulk density and carbonate content results.To trace the evolution of compaction in the more deeply buriedsection of Ceara Rise, we compared bulk density anomalies to measured carbonate content at Site 925 over 50-m windows. In this case,we computed anomalies from a linear fit of discrete bulk density datato depth. We present selected windows from Holes 925A in Figure 6.Data from the other deep hole (929E) are not plotted but show similarfeatures. What is evident is that bulk density generally varies systematically with carbonate content, but with a changing form with depth.From depths below the first significant density inversion (about 30mbsf on Ceara Rise) to about 200 mbsf, bulk density is negatively,and nearly linearly, correlated to carbonate content (Fig. 5). Withprogressive burial, the relation becomes more evidently nonlinear(Fig. 6). The highest bulk densities and the lowest porosities occur forcarbonate contents of 40% 50% between 200 and 300 mbsf at Hole925B (Fig. 5). From 350 to 400
9. LIFE CYCLE(S) OF SEDIMENT PHYSICAL PROPERTIES, CEARA RISE 1 Timothy D. Herbert, 2 Steven DiDonna, 3 Franck Bassinot, 4 Jens Gruetzner, 5 and Kate Moran 6 ABSTRACT Sediments recovered during Leg 154 exhibit an unusually wide variation of interbedded lithologies d