Transcription
CADET: A Systematic Method For DebuggingMisconfigurations using Counterfactual ReasoningMd Shahriar Iqbal University of South Carolinamiqbal@email.sc.eduRahul Krishna Columbia Universityrahul.krishna@columbia.eduBaishakhi RayColumbia Universityrayb@cs.columbia.eduMohammad Ali JavidianPurdue Universitymjavidia@purdue.eduPooyan JamshidiUniversity of South Carolinapjamshid@cse.sc.eduAbstractModern computing platforms are highly-configurable with hundreds of interacting configuration options. However, configuring these systems is challenging.Erroneous configurations can cause unexpected non-functional faults resultingin significant performance degradation in non-functional system properties likelatency, energy consumption, heat dissipation, etc. This paper proposes CADET(short for Causal Debugging Toolkit)—a method that enables users to identify,explain, and fix the root cause of non-functional faults early and in a principledfashion. CADET builds a causal model by observing the performance of thesystem under different configurations. Then, it uses causal path extraction followedby counterfactual reasoning over the causal model to (a) identify the root causesof non-functional faults, (b) estimate the effects of various configuration optionson the non-functional system properties, and (c) prescribe candidate repairs tothe relevant configuration options to fix the non-functional faults. We evaluateCADET on 5 highly-configurable software systems deployed on 3 NVIDIA Jetsonhardware platforms. We compare CADET with four state-of-the-art machinelearning (ML)-based debugging approaches. The experimental results indicatethat CADET can find repairs for faults with (on average) 8% better accuracyin multiple non-functional properties 7 faster than the next best performancedebugging method.1IntroductionModern computer systems are composed of multiple components, each of which are highlyconfigurable, and are increasingly being deployed on heterogeneous hardware platforms (e.g.,System-on-a-Chip, System-on-Module, IoT devices, cloud platforms) with different deploymentconfigurations (local, distributed, multi-cloud). For example, most modern ML systems, cyberphysical systems, self-driving cars, robotics, and big data systems have such characteristics. Theconfiguration space in such systems is combinatorially large with thousands of software and hardwareconfiguration options that interact non-trivially with one another [1, 2, 3]. Unfortunately, configuringthese systems to achieve specific goals is challenging and error-prone. Incorrect configurations(misconfigurations) happen as a result of unexpected interactions between software and hardwareconfiguration options across the system stack resulting in non-functional faults, i.e., faults in termsof non-functional system properties such as latency, energy consumption, and/or heat dissipation.These non-functional faults—unlike regular software bugs—do not cause the system to crash or Joint First author.34th Conference on Neural Information Processing Systems (NeurIPS 2020), Vancouver, Canada.
exhibit an obvious misbehavior [4, 5, 6]. Instead, misconfigured systems remain operational whilebeing compromised, resulting in severe performance degradation in latency, energy consumption,and/or heat dissipation [7, 8, 9, 10]. The sheer number of modalities of software deployment is solarge that exhaustively testing every conceivable software and hardware configuration is impossible.Swap Mem.GPUGrowthLatencyConsequently, identifying the root cause of nonfunctional faults is notoriously difficult [11]with as much as 99% of them going unnoticed or unreported for extended durations [12].Non-functional faults have tremendous monetary repercussions costing companies worldwidean estimated 5 trillion in 2018 and 2019 [13].They also dominate discussions on online forums where some developers are quite vocal inexpressing their dissatisfaction [14, 15]. Therefore, we seek methods that can identify, explain,and fix the root cause of non-functional faultsearly and in a principled fashion.512 Mb1GbSwapMemoryResourcePressure2Gb4GbGPU Growth(a)3GbLatencyGPU Growth(b)(c)Figure 1: Observational data (in Fig. 1a) (incorrectly) shows that high GPU growth leads to highlatency. The trend is reversed when the data is segregated by swap memory (Fig. 1b). Causal modelconstructed on the observational data indicates thatGPU growth indirectly influences latency via swapExisting work. Much recent work has focused memory (Fig. 1c).on configuration optimization aimed at findinga near-optimal configuration that optimizes a performance objective [16, 17, 18, 19]. Finding theoptimum configuration using push-button optimization approaches are not applicable here because wetackle an essentially different problem—to find and repair the root causes of an already observed nonfunctional fault. The global optima do not give us any information about the underlying interactionsbetween the faulty configuration options that caused the non-functional fault. This information issought after by developers seeking to address these non-functional faults [4, 20].Some previous works have used ML-based performance modeling in fixed [21, 22, 23, 24, 25, 26,27] and variable environments [28, 29, 30, 31]. Several works attempted to debug systems usingnoisy logs [32], anomaly diagnosis [33, 34], sampling [2], data-driven approaches [35, 36, 37, 38],explanation tables [39], query-based diagnosis [40], statistical debugging and association rule miningbased approaches [41, 42, 43, 44, 45, 46], and similarity analysis [47]. These approaches areadept at describing if certain configuration options influence performance, however, they lack themathematical language to express how or why the configuration options affect performance. Withoutthis knowledge, we risk drawing misleading conclusions. They also require significant time togather the training samples, and this time grows exponentially with the number of configurations [48,1]. Recent work has employed causal inference for detecting functional bugs (Holmes [49]) andintermittent failures of databases (AID [50]). These works are orthogonal to performance debuggingof highly-configurable systems.Limitations of existing work. In Fig. 1, we present an example to help illustrate the limitations ofthe current techniques. Here, the observational data gathered so far indicates that a configurationoption GPU growth is positively correlated with increased latency (as in Fig. 1a). A black-boxML-model built on this data will, with high confidence, predict that larger GPU growth leads to largerlatency. However, this is counter-intuitive because higher GPU growth should, in theory, reducelatency not increase it. When we segregate the same data on swap memory (as in Fig. 1b), we seethat there is indeed a general downward trend for latency, i.e., within each group of swap memory,as GPU growth increases the latency decreases. We expect this because GPU growth controls howmuch memory the GPU can “borrow” from the swap memory. Depending on resource pressureimposed by other host processes, a resource manager may arbitrarily re-allocate some swap memory;this means the GPU borrows proportionately more/less swap memory thereby affecting the latencycorrespondingly. This is reflected by the data in Fig. 1b. If the ML-based model were to consult theavailable data (from Fig. 1a) unaware of such underlying causal structure, these models would beincorrect. With thousands of configurations, inferring such nuanced information from optimization orML-based approaches would require a considerable amount of measurements and extensive domainexpertise which can be impractical, if not impossible, to possess in practice.Our approach. In this paper, we propose the use of causal models [51, 52] to express the complexinteractions between the configuration options and the performance objectives with causal models—a2
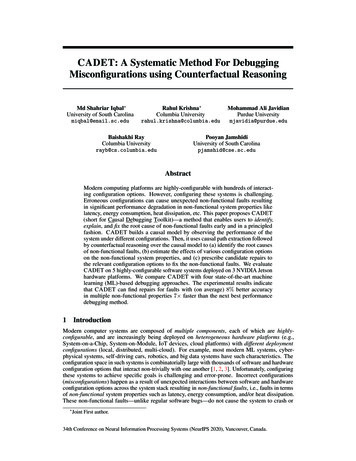
CADET1PeformanceFault2X1X2X5X4Y13X3X6X5X2X5Y1Rank paths usingX3X6Y2Avg. Causal EffectX5X1Y24X1Y1X6CounterfactualQuery EngineRepair with thehighest causal EffectY2What is the root-cause of my fault?What shoud I do to improve myperformance objective Y?Observationaldata collectionCausal PathExtractionCausal StructureDiscoveryFigure 2: Overview of CADET.rich graphical representation that can be learned from performance data and that can be reasonedupon using the mathematics of causal inference. To this end, we design, implement and evaluateCADET that uses causal structural discovery algorithms [53, 54] to construct a causal model usingobservational data. Then, it uses counterfactual reasoning [55] over the causal model to (a) identifythe root causes of non-functional faults, (b) estimate the effects of various configurable parameterson the non-functional properties(s), and (c) prescribe candidate repairs to the relevant configurationoptions to fix the non-functional fault. In the example of Fig. 1, CADET constructs a causal modelfrom observational data (as in Fig. 1c). This causal model indicates that GPU growth indirectlyinfluences latency (via a swap memory) and that the configuration options may be affected bycertain other factors, e.g., resource manager allocating resources for other processes running onthe host. CADET uses counterfactual questions such as, “what is the effect of GPU growth onlatency if the available swap memory was 2Gb?” to diagnose the faults and recommend changesto the configuration options to mitigate these faults. We evaluate CADET on 5 real-world highlyconfigurable software systems including image recognition using Xception [56], natural languageprocessing (NLP) using BERT [57], speech recognition using DeepSpeech [58], database managementsystem using SQLite [59], and video encoder using x264 [60] deployed on 3 architecturally differentNVIDIA Jetson devices such as TX1, TX2 and X AVIER [61, 62]. The key reason we evaluatedthese systems is that they expose numerous intrinsic non-linear interactions between options thatare beyond the visibility of software developers who use them. We compare CADET with state-ofthe-art ML-based performance debugging approaches including D ELTA D EBUGGING [63], CBI [41],B UG D OC [42], and E N C ORE [43]. Overall, we find that CADET is (on average) 7 faster indetecting the root cause of non-functional faults with 8% better accuracy and recommending fixeswith 11% higher gain from the corresponding fault when compared to the next best ML-basedapproaches in some cases. We also present a real-world case study where we demonstrate thatCADET finds repair with 14% higher gain than the experts’ advice in 24 minutes. The dataset andthe scripts to reproduce our findings are available in https://github.com/softsys4ai/CADET.2Motivation — A Real-World ExampleWe present an instance of a non-functional fault that was reported in the NVIDIA developer forum 2 .Here, a developer notices some strange behavior when trying to transplant their code for real-timecomputation of depth information from stereo-cameras for object detection from NVIDIA JetsonTX1 to TX2. Since TX2 has twice the compute power as TX1, the developer expects to have atleast 30% – 40% lower latency in TX2. However, the developer observed that TX2 had 4 thelatency as TX1. To solve this problem, the developer solicits advice from the developer forums. Afterdiscussions spanning two days, the developer learns that she/he has made several misconfigurations: Wrong compilation flags: The compilation does not take into account the microarchitecturaldifferences between the two platforms that may be fixed by setting the -gencode arch parameter andcompiling the code dynamically by disabling the CUDA USE STATIC flag. TX1 is based on Maxwellmicroarchitecture, while TX2 is based on Pascal microarchitecture. These two microarchitectureshave significant differences in terms of power usage and compute speed [64]. Wrong CPU/GPU clock frequency: The hardware configuration is set incorrectly. These maybe fixed by setting the configuration -nvpmodel MAX-N which changes the CPU and GPU clocksettings. The Max-N setting in TX2 provides almost twice the performance of TX1 [65] due toincreased clock speeds and TX2’s use of 128-bit memory bus width versus the 64-bit in TX1 [64].2https://forums.developer.nvidia.com/t/504773
c1c2.cn(Configurable Options)(Sys. Events)GPU Growth Swap MemResource Use0.252 Gb10%0.51 Gb20%.1.04 Gb40%Latencyetc.1 sec, . . .2 sec, . . .0.1 sec, . . .Resource PressureSwap Mem.GPU Growth(a) Sample Observational DataLatency(d) Partial Ancestral Graph (PAG)from FCIGPU GrowthGPU GrowthSwap Mem.(c) FCI SkeletonResource PressureResource Pressure0.6Swap Mem.Latency(b) Dense GraphResource PressureGPU GrowthResource Pressure0.40.80.2Swap Mem.Latency0.90.1Latency(e) DAG from NOTEARSGPU GrowthSwap Mem.Latency(f) Final ADMGFigure 3: From observational data to fully connected, skeleton graph, and partial ancestral graph (PAG). Wrong fan modes: The fan modes need to be configured correctly to account for higher CPU/GPUclock speeds. Otherwise, TX2 will thermal throttle the CPU and GPU to prevent overheating [66]and invariably increasing the latency [67].This is only one of many examples in a single system, in which misconfigurations severely impact thenon-functional properties of the system. Examples abound from many other systems and domains,including IoT (e.g. Amazon Alexa) [68, 69] and production-scale cloud-based systems [11].3CADET: Causal Debugging ToolkitThis section presents a brief description of CADET (outlined in Fig. 2). We gather a few dozensamples of observational data, by measuring the non-functional properties of the system (e.g., latency,etc) under different configuration settings (see 1 in Fig. 2) to construct a graphical causal model usingthe observational data (see 2 in Fig. 2). Then, we find paths that lead from configuration options tolatency, energy consumption, and thermal output (see 3 in Fig. 2). Next, a query engine generatesseveral counterfactual queries (what-if questions) about specific changes to each configuration option(see 4 in Fig. 2) and finds which of these queries has the highest causal effect on remedying thenon-functional fault(s). Finally, we generate and evaluate the new configuration to assert if the newlygenerated configuration mitigates the non-functional fault(s). If not, we repeat the process by addingthis to the current observational data.Causal structure discovery. In this stage, we express the relationships between configurationoptions (e.g., CPU freq, etc.) and the non-functional properties (e.g., latency, etc) using a causalmodel. A causal model is a acyclic directed mixed graph (hereafter, ADMG) [70, 71]. The nodesof the ADMG have the configuration options and the non-functional properties (e.g., latency, etc).Additionally, we enrich the causal graph by including several nodes that represent the status ofinternal system events, e.g., resource pressure (as in Fig. 1). Unlike configuration options, thesesystem events cannot be modified. However, they can be observed and measured to understandhow the causal-effect of changing configurations propagates to latency, energy consumption, or heatdissipation, e.g., resource pressure in Fig. 1 determines how GPU growth affects latency. To buildthe causal model we gather two dozen samples of observational data (resembling Table 3a). Toconvert observational data into a causal graph, we use a prominent structure discovery algorithmcalled Fast Causal Inference (hereafter, FCI) [53]. We picked FCI because it accommodates forthe existence of unobserved confounders [53, 72, 73]. This is important because we do not assumeabsolute knowledge about the configuration space, hence there could be certain configurations wecould not modify or system events we have not observed. First, we build a dense graph by connectingall pairs of variables with an undirected edge (as seen in Fig. 3b). Next, we use Fisher’s exact test [74]to evaluate the independence of all pairs of variables conditioned on all remaining variables. Pruningedges between the independent variables results in a skeleton graph as shown in Fig. 3c. Next, weorient undirected edges using edge orientation rules [53, 72, 73, 75] to produce a partial ancestralgraph (as in Fig. 3d). We compare all the partially directed edges from the FCI’s PAG (Fig. 3d) withtheir corresponding counterparts from NOTEARS’ DAG (Fig. 3e). The final causal model would bean ADMG that resembles Fig. 3f.Causal path extraction. In this stage, we extract paths from the causal graph (referred to as causalpaths) and rank them based on their average causal effect on latency, energy consumption, and heatdissipation (our three non-functional properties). A causal path is a directed path originating fromeither the configuration options or the system events and terminating at a non-functional property4
(i.e., latency, energy consumption, or heat dissipation). To discover causal paths, we backtrack fromthe nodes corresponding to each non-functional property until we reach a node with no parents. Forexample, from Fig. 3f, we can extract two paths: (1) GPU growthswap memoryLatency,and (2) Resource Pressureswap memoryLatency.A complex causal graph can result in a large number of causal paths. Therefore, we rank the paths indescending order from ones having the highest causal effect to ones having the lowest causal effecton each non-functional property. For further analysis, we use paths with the highest causal effect.To rank the paths, we measure the causal effect of changing the value of one node (say GPU growthor X) on its successor in the path (say swap memory or Z). We express this with the do-calculusnotation such as E [Z do (X x)] that represents the expected value of Z (swap memory) if we setthe value of the node X (GPU growth) to x. To compute the average causal effect (ACE) of X Z(i.e., GPU growthswap memory), we find theP average over all permissible values the node X(GPU growth) can take, i.e., ACE (Z, X) N1 · a,b X E [Z do (X b)] E [Z do (X a)].Here, N represents the total number of values X (GPU growth) can take. If changes in GPU growthresult in a large change in swap memory, then the ACE (Z, X) will be larger, indicating that GPUgrowth on average has a large causal effect on swap memory. The prior equation can be extended tothe compute causal effect of a path PACE .Repairing non-functional faults. In this stage, we use the top K paths with the largest PACE valuesto: (a) identify the root cause of non-functional faults; and (b) prescribe ways to fix the non-functionalfaults. When experiencing non-functional faults, a developer may ask specific queries to CADET andexpect an actionable response. For this, we translate the developer’s queries into formal probabilisticexpressions that can be answered using the causal paths. We use counterfactual reasoning to generatethese probabilistic expressions. To understand query translation, we use the example causal graphof Fig. 3f where a developer observes a latency fault and has the following questions:? “What is the root cause of my latency fault?” To identify the root cause of a non-functionalfault we must identify which configuration options have the most causal effect on the performanceobjective. For this, we use the steps outlined above to extract the paths from the causal graph and rankthe paths based on their average causal effect (i.e., PACE from) on latency. For example, in Fig. 3f wemay return the path (say) GPU growthswap memoryLatency and the configuration optionsGPU growth and swap memory both being probable root causes.? “How to improve my latency?” To answer this query, we first find the root cause as describedabove. Next, we discover what values each of the configuration options must take so that thenew latency is better (low latency) than the fault (high latency). For example, we consider thecausal path GPU growthswap memoryLa
We evaluate CADET on 5 real-world highly configurable software systems including image recognition using Xception [56], natural language processing (NLP) using BERT [57], speech recognition using DeepSpeech [58], database management system using SQLite [59], and video encode