Transcription
1IEEE PES General MeetingPanel SessionThe use of CIM Standards in Managing Big Utility DataCIM-based Utility Data Model Solution forEnterprise AnalyticsJuly 2014National Harbor, MarylandShawn Hu, Xtensible Solutions, shu@xtensible.netTerry Saxton, Xtensible Solutions, tsaxton@xtensible.net
2Topics Covered Utilities and Big Data 2013 SurveyImportance of a Utility Data ModelRole of IEC CIM on Utility Data ModelDesign ConsiderationsScope of Business Areas IncludedSample BI Reports
North America Utilities Survey 151 North America utilities surveyed (April & May 2013) Less than half of utilities are using smart grid data toimprove customer service today Big opportunities also remain in operational analyticsto improve asset performance, reduce operations costs,and improve network reliability- Source: Oracle Utilities and Big Data: Accelerating the Drive to Value, July 23, 2013
Survey on Predictive Analytics 70% - Expect predictive analytics to improve revenueprotection 61% - Expect predictive analytics to reduce assetmaintenance costs- Source: Oracle Utilities and Big Data: Accelerating the Drive to Value, July 23, 2013
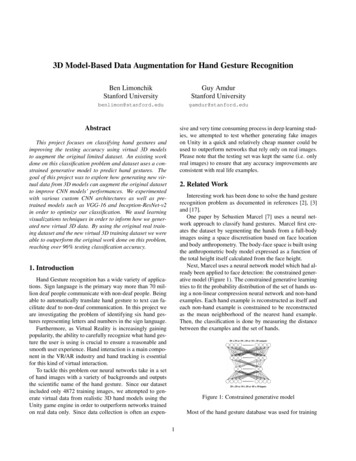
Utilities are Improving, but Underprepared- Source: Oracle Utilities and Big Data: Accelerating the Drive to Value, July 23, 2013
Opportunities to Drive Greater Customer Value Fewer than half of utilities today use smart grid data to provide alerts ormake other direct customer service improvements- Source: Oracle Utilities and Big Data: Accelerating the Drive to Value, July 23, 2013
Opportunities to Drive Greater Operational Value Currently, just half of utilities are fully leveraging smart grid data toimprove customer service through forecasting, demand management andimproved reliability- Source: Oracle Utilities and Big Data: Accelerating the Drive to Value, July 23, 2013
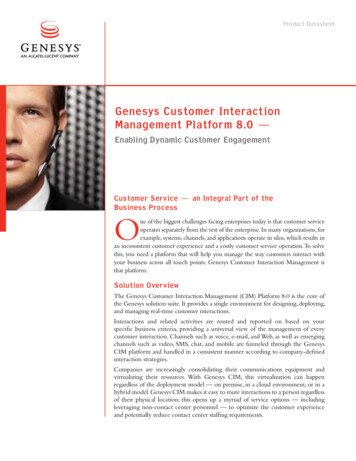
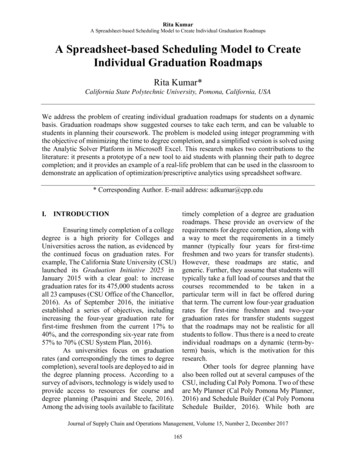
Data Aggregation Challenge- Example on Asset Health et EngineerOwner/ UserReviewReplacement PlanningMaintenance PlanningLong term planningSCADAHistorianThe OTDivideChallenging to bring the data together8OperationsManagerAlarmsCustomersShort Term planning
What is a Utility Data Model (UDM) Exactly? UDM is a pre-built, standards-based data warehouse solution UDM provides the following features:– Query and reporting for information Provides extraction of detailed and summary data– On-Line Analytical Processing (OLAP) for answering multi-dimensionalanalytical (MDA) queries swiftly Provides summaries, trends, and forecasts– Data mining for insight and prediction Provides knowledge discovery of hidden patterns and insights– It is aligned with the IEC CIM model
The CIM is acts as a Common Language to Provide RelevantInformation to a User Regardless of ConcernsMaintenanceConcerns
The IEC Common Information Model (CIM)- What Is It? A set of standards to enable system integration and information exchangebased on a common model of utility networks, operations and planning– Enables integration of applications/systems CIM Provides a common set of semantics for all system interactions Basis for defining interface profiles for each information exchange and associatedmessage/file schemas for all messages/files exchanged between systems– Enables data access in a standard way Common language to navigate and access complex data structures in any database Inspiration for logical data schemas (e.g., for a data warehouse) A key differentiator: The CIM standards are based on a Unified ModelingLanguage (UML) based information model representing real-world objectsand information entities exchanged within the value chain of the electricpower industry– Not tied to a particular application’s view of the world But permits same model to be used by all applications to facilitate information sharingbetween applications– Developed and standardized by IEC using Sparx Enterprise Architect modelingtools Responsible Standards Organization: www.iec.ch CIM Users Group: www.ucainternational.org
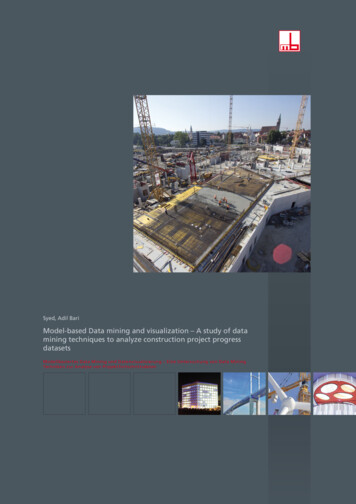
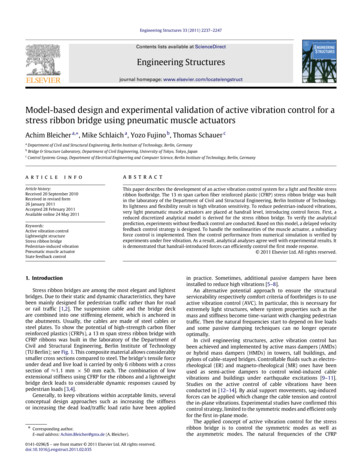
12CIM Model – Metering and Control Example IEC 61968-9 (sub set)cl a ss M et er i ngM et er Rea di ngsU sa geP oi nt0.1 UsagePointAssetContainer EndDevice EndDevicesIdentifiedObject 0.1EndDev i ce0.* UsagePoint0.1 EndDevice 0.1 UsagePoint0.10.*isVirtual :Boolean [0.1]isPan :Boolean [0.1]installCode :String [0.1]amrSystem :String [0.1]timeZoneOffset :Minutes [0.1]EndDev i ceFunct i on ActivityRecord EndDeviceEvents0.* RegistersM et er 0.* MeterReading0.1IdentifiedObjectformNumber :String [0.1] Meter0.1Regi st er isVirtual :Boolean [0.1]rightDigitCount :Integer [0.1]leftDigitCount :Integer [0.1]touTier :TimeInterval [0.1]touTierName :String [0.1]IdentifiedObjectM et er Rea di ng EndDeviceFunction0.*EndDev i ceEv ent MeterReadings0.*enabled :Boolean [0.1]0.1 EndDeviceEvents EndDeviceEvents0.* EndDeviceFunctions Register0.1 Channels0.* MeterReadingsvaluesInterval :DateTimeInterval [0.1] 0.*isCoincidentTrigger :Boolean [0.1]IdentifiedObjectC ha nnel isVirtual :Boolean [0.1]IdentifiedObjectA sset s::A sset Funct i on programID :String [0.1]firmwareID :String [0.1]hardwareID :String [0.1]password :String [0.1]configID :String [0.1]
Design Considerations How to deal with CIM inheritance? How to deal with CIM many-to-many relationships? How to deal with unique identifiers and multiplenames? Primary key: natural or surrogate? Normalization or de-normalization? Granularity? How to deal with CIM compound data types?
How to Use CIM to Build Data Model Example in CIM model (for UsagePoint and MeterReading)M D3i SB C ont ext Di a gr a mC ust omer A gr eement CustomerAgreement CustomerAgreementloadMgmt :String [0.1] 0.10.1 UsagePoints0.*U sa geP oi ntU sa geP oi nt Loca t i on UsagePointLocationaccessMethod :String [0.1]siteAccessProblem :String [0.1] 0.1remark :String [0.1] MeterReadings 0.*M et er Rea di ng MeterReadingsvaluesInterval :DateTimeInterval [0.1]0.*isCoincidentTrigger :Boolean [0.1] UsagePoints 0.* UsagePoint 0.1isSdp :Boolean [0.1]isVirtual :Boolean [0.1]phaseCode :PhaseCode [0.1]grounded :Boolean [0.1]servicePriority :String [0.1]serviceDeliveryRemark :String [0.1]estimatedLoad :CurrentFlow [0.1]checkBilling :Boolean [0.1]ratedCurrent :CurrentFlow [0.1]nominalServiceVoltage :Voltage [0.1]ratedPower :ActivePower [0.1]outageRegion :String [0.1]readCycle :String [0.1]readRoute :String [0.1]amiBillingReady :AmiBillingReadyKind [0.1]connectionState :UsagePointConnectedKind [0.1]minimalUsageExpected :Boolean [0.1]
CIM-based Data Model Example in UDM model- Bridge table added- NormalizedSource: Oracle Utilities Data Model (OUDM)
CIM-based Data Model Example (normalization)CIMcl a ss M et er i ngTy pesIdentifiedObjectRea di ngTy pe macroPeriod :String [0.1]aggregate :String [0.1]measuringPeriod :String [0.1]accumulation :String [0.1]flowDirection :String [0.1]commodity :String [0.1]measurementKind :String [0.1]interharmonic :ReadingInterharmonic [0.1]argument :RationalNumber [0.1]tou :Integer [0.1]cpp :Integer [0.1]consumptionTier :Integer [0.1]phases :String [0.1]multiplier :String [0.1]unit :String [0.1]currency :String [0.1]Source: Oracle Utilities Data Model (OUDM)
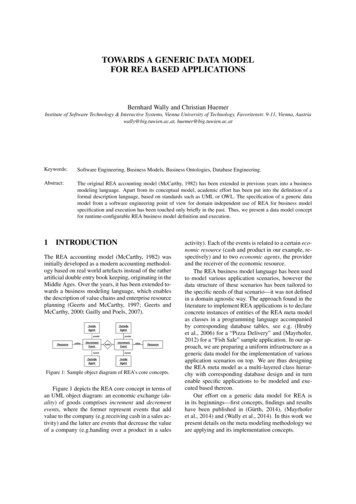
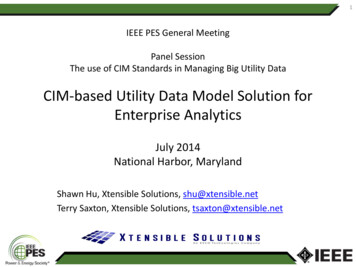
Physical Model – Star Schema Example Meter Reading TOU Month AggregateSource: Oracle Utilities Data Model (OUDM)
Typical Business Areas Included in UDMBusiness Areas:Account ManagementAsset ManagementCustomer ManagementMeter Reading and ControlNetwork OperationOutage ManagementWeather ModelWork Management
Subject AreasSubject Area: AccountSubject Area: Meter ReadingSubject Area: Account BalanceSubject Area: Meter Reading and Control OverviewSubject Area: Account Credit LimitSubject Area: Meter Reading Register and ChannelSubject Area: AgreementSubject Area: Meter Reading TypeSubject Area: AssetSubject Area: Meter Reading and EventsSubject Area: Asset Information ClassesSubject Area: Network OperationSubject Area: BillingSubject Area: Outage ManagementSubject Area: Business InteractionSubject Area: Party Organization Business UnitSubject Area: ChannelSubject Area: PaymentSubject Area: Connectivity ModelSubject Area: Premise and NodeSubject Area: CostSubject Area: Pricing StructureSubject Area: Curve ScheduleSubject Area: Promotion and CampaignSubject Area: CustomerSubject Area: Phase ModelSubject Area: Customer Account and AgreementSubject Area: Regulating Equipment ModelSubject Area: Demand Response ProgramSubject Area: SCADASubject Area: EmployeeSubject Area: Schedule ModelSubject Area: End Device ControlSubject Area: Substation, Feeder, and Transformer Hierarchy ModelSubject Area: End Device EventSubject Area: Switching Equipment ModelSubject Area: FinancialSubject Area: Tap Changer ModelSubject Area: Generating UnitSubject Area: Transformer ModelSubject Area: Line ModelSubject Area: Usage Point, Agreement, Account, Customer, and PremiseSubject Area: Load ModelSubject Area: Usage Point and End DeviceSubject Area: LocationSubject Area: Voltage Control ModelSubject Area: Meter AssetSubject Area: Weather ModelSubject Area: Meter Event and ReadingSubject Area: Work ManagementCopyright 2013Source: l Rights Reserved.
Sample Report – Meter Data Analysis Star Schema – Meter Reading by HourSource: Oracle Utilities Data Model (OUDM)
Sample Report – Meter Data Analysis Monthly Usage– Operational Zone– Geographical Zone– Utility Region
Sample Report – Meter Data Analysis Top N Customers by UsageMonthly Usage Season ProfileDaily Usage Season ProfileMonthly Total UsageLow Usage by Usage PointTOU Usage ProfileTOU Usage TreadTop N Customer with Usage ChangeCustomer Count by Usage Grouping
Sample Report – Meter Data Analysis Monthly Usage Season Profile by Operational Zones
Sample Report – Meter Data Analysis TOU Usage Profile
Sample Report – Outage Analysis Star Schema – Outage by Usage PointSource: Oracle Utilities Data Model (OUDM)
Sample Report – Outage Analysis Reliability by CityWorst Performing FeederTop N Customers by CMITop N Customers by # OutagesTop N Feeders by Outage CountTop N Feeders by Total Minutes LostTop N Feeders by Reliability IndicesTop N City by Outage CountTop N City by Total Minutes LostTop N City by Reliability IndicesTop N Region by Outage CountTop N Region by Total Minutes LostTop N Region by Reliability Indices
Sample Report – Outage Analysis Reliability by City
Sample Report – Outage Analysis Top N City by Outage Count
Comments & Questions?
30For Further Information CIM Users Group (CIMug) Sharepoint site (www.cimug.org) Contact Terry Saxton tsaxton@xtensible.net, 612-396-7099or Shawn Hu shu@xtensible.net, 612-860-0066
Less than half of utilities are using smart grid data to improve customer service today Big opportunities also remain in operational analytics to improve asset performance, reduce operations costs, and improve network reliability - Source: Oracle Utilities and