Transcription
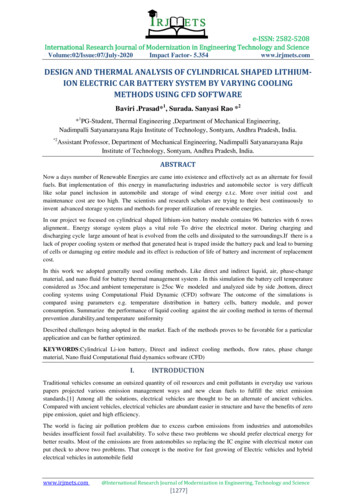
Journal of Quantitative Spectroscopy & Radiative Transfer 126 (2013) 160–168Contents lists available at SciVerse ScienceDirectJournal of Quantitative Spectroscopy &Radiative Transferjournal homepage: www.elsevier.com/locate/jqsrtSizing highly-ordered buckyball-shaped aggregates ofcolloidal nanoparticles by light extinction spectroscopyF.R.A. Onofri a,n, S. Barbosa a, O. Touré b, M. Woźniak a,c, C. Grisolia daCNRS, Aix-Marseille Université, IUSTI UMR 7343, Polytech’Marseille—Mechanical Engineering, 5 rue E. Fermi, TechnopôleChateau-Gombert, Marseille 13453 CEDEX 13, FrancebInstitut PASCAL, UMR 6602, CNRS/Université Blaise Pascal, Polytech’Clermont-Ferrand, 63174 Aubie re, FrancecChair of Electronic and Photonic Metrology, Wroclaw University of Technology, 50-317 Wroc!aw, PolanddCEA, IRFM, F-13108 Saint-Paul-lez-Durance, Francea r t i c l e in f oabstractArticle history:Received 5 June 2012Received in revised form13 August 2012Accepted 14 August 2012Available online 24 August 2012We produced self-assembled, densely-packed and highly-ordered aggregates of silicananoparticles arranged in a rather regular hexagonal–pentagonal surface lattice. Toinvestigate the formation of these aggregates, produced by means of a spray dryingmethod, we developed a light extinction setup and all related models. It is shown thatwith a geodesic dome model, to describe their morphology, and a T-matrix method tocalculate their extinction cross sections, the size distribution and concentration of theseflowing aggregates may be recovered from the inversion of transmission spectra.& 2012 Elsevier Ltd. All rights reserved.Keywords:AggregatesAerosolLight extinction spectrometryScattering modelsT-matrixInversion1. IntroductionThe optical, electrical or mechanical properties of nanoparticles are determined by their material properties,certain quantum effects and their unmatched specific surface (i.e., their size and shape). Because of the potential forinteresting new properties and applications based on newnanoparticle morphologies, many efforts are devoted to themanufacture of nanoparticles with specific and wellcontrolled shapes (nanotubes, nanowires, liposomes, etc.).We recently succeeded in producing, by means of a spraydrying method, large and highly ordered aggregates of silica(SiO2) nanoparticles of a new kind. Fig. 1 shows sometypical (a) scanning and (b) transmission electron microscopy (SEM, TEM) images of these aggregates. On theirnCorresponding author. Tel.: þ 33491106892; fax: þ33491106969.E-mail address: fabrice.onofri@polytech.univ-mrs.fr (F.R.A. Onofri).0022-4073/ - see front matter & 2012 Elsevier Ltd. All rights .018surfaces, the nanoparticles tend to self-organize into apentagonal–hexagonal lattice (with, however, somedefects), showing some similarities to that observed forfullerene molecules (also known as buckyballs, e.g., [1]).There are, however, two major differences with respect tofullerene molecules: silica nanoparticles (in close contact)replace distant atoms and the internal structure of these‘‘silica nanoparticle buckyballs (SNBs)’’ is quite denselypacked. Shell-structured (e.g., liposomes) or denselypacked aggregates of spheres have been widely studied inthe literature (e.g., [2–5]), but none of them is as regular, asdense or as large as the self-assembly aggregates that wehave observed. Understanding and controlling the formation mechanisms of SNBs require being able to performextensive parametric studies.This paper focuses on work aimed at developing a lightextinction spectrometer (LES) and the related models forthe in-situ and real-time characterization of the particlesize distribution (PSD) and concentration of these complex
F.R.A. Onofri et al. / Journal of Quantitative Spectroscopy & Radiative Transfer 126 (2013) 160–168161Fig. 1. (a) Scanning and (b) transmission electron microscopy images exemplifying the self-organisation of the highly-ordered buckyball-shapedaggregates of silica nanoparticles (SNBs).aggregates. The paper is organized as follows. Although it isunusual, for the sake of clarity, Section 2 directly describesthe setups used to produce and analyze the SNBs. Section3 details the work done to build aggregates similar toexperimental ones, which is a prerequisite for the calculation of their light scattering properties. Section 4 brieflyreviews the basic principle and requirements of LES,before presenting the light scattering calculations andinversion methods used to analyze light extinction spectra. In Section 5, we compare experimental resultsobtained with these different approaches, while Section6 is a conclusion.2. Experimental setup and correctionThe spray drying and optical setups are depicted inFig. 2. A Laskin nozzle aerosol generator (ATM220, TOPASGmbH)(1) is used to spray colloidal silica suspensions(Klebosols) (2) with dry and nanofiltered air at differentpressures (1–6 bar) (3). These suspensions, supplied by AZElectronic Materials France SAS, are anionic colloidalsuspensions containing, in terms of mass, 29% of SiO2particles and 0.2% Na2O as a stabilizer, the rest being purewater. The pH and zeta potential of these suspensions aremeasured at 8.5 and 56 mV, respectively. When asample of these suspensions is evaporated on a flat surface [6], the nanoparticles self-organize in the form of ahexagonal lattice. Lattice defects are mostly attributed tothe suspensions polydispersity with, for the mean diameter and standard deviation of the three suspensionsconsidered in our study: K30R50 (81716 nm), K30R25(6777 nm) and K30R12 (3176 nm). The aerosol ofFig. 2. Sketch of the spray drying and optical setups.microdroplets of suspension is directed to a diffusivedrier unit filled with silica gel grains (4). The role of thisdrier is to absorb the water vapor released during theslow evaporation process at atmospheric pressure. In ouropinion, this is the key mechanism responsible for theformation of SNBs. In fact, due to electric double layerrepulsion forces, the silica nanoparticles tend to maximizetheir inter-distances. However, during the evaporationprocess, the water/air interface increases the containmentand the nanoparticles gradually approach each other.Finally, capillary forces, and afterwards, van der Waalsforces, stick the nanoparticles together as Coulomb repulsive forces vanish [2]. The aerosol of dry aggregates isthen directed to a mixing chamber (5), equipped with
162F.R.A. Onofri et al. / Journal of Quantitative Spectroscopy & Radiative Transfer 126 (2013) 160–168several inlets/outlets (6) and a turbulence grid (7), andthen, to a test chamber mainly composed of a longPlexiglas pipe with a circular cross section (L W¼1000 90 nm) (8). Fused silica optical windows (9) allowthe LES probing beam (10) to pass through the testchamber. The aerosol is continuously pumped out fromthe test chamber (11). Aerosol samples are collected, onSEM carbon tips and TEM grids (12) located at the bottomof the test chamber, by a sedimentation process (i.e.,atomization and pumping processes are stopped).Classically (e.g., [7,8]), the LES probing beam is produced with a highly-stabilized halogen–deuterium lamp(13), and achromatic coupling and collimating optics (14)[8]. The detection part is symmetrical (15). The spectrometer has a maximum spectral range of 175–1050 nmwith an enhanced response in the UV range and a globalhalf-height resolution of 2–5 nm (16). Its acquisition rateis 160 spectra (2068 pixels; 16 bits depth) per second.Optical choppers used to record the reference signals arenot shown in Fig. 2.3. Particle model and sedimentation model3.1. Particle modelBased on the obvious fact that the surface of SNBs isorganized in a pentagonal and hexagonal lattice, it naturally occurs to us that a geodesic dome model is the mostsuitable to describe their morphology. The novelty of thismodel, which shows some similarity with Mackay’s icosahedron structure [9], lies in the fact that aggregates arebuilt as an assembly of spheres in contact and not as asurface lattice minimizing forces (fullerene molecules) [1]or post-lengths (domes used in architecture). Our modelis essentially composed of five steps.Of the five Platonic solids, we choose the icosahedronas it most closely fits the spherical shape. The icosahedronis composed of nFace ¼ 20 identical equilateral triangularfaces, nEdg. ¼30 edges and nVert. ¼12 vertices. By placinga (spherical) silica nanoparticle at each of its vertices,we obtain a buckyball of np ¼12 identical nanoparticles.The vertices of an icosahedron with an edge length l areall located on a circumscribed sphere with a radius rcirc. ¼lsina where a ¼2p/5, see Fig. 3. The vertices n ¼1 to 5 areall on a plane perpendicular to the z-axis and with anequation z0 ¼l[sina 1/(2sina)], and on a circle with �ffiffiffiffiffiradius r 0 ¼ l 1 þ1 ð4 cos2 a 1Þ. The two other coordinates of these vertices can be deduced by simple rotationsand symmetry considerations [10]. By placing nanoparticles with a radius rp at the icosahedron vertices, i.e., l ¼2rpthe radius of the circumscribed sphere that touches theouter surface of the np ¼12 nanoparticles is Rcirc. ¼ rcirc. þ1¼ 2rp(sina þ1).To build larger buckyballs, each edge of the icosahedron is divided into ni þ1 line segments of equal length(see Fig. 3a), where ni Z0 represents the number of newvertices introduced along each edge of the icosahedron.By introducing new line segments of equal length whichpass through these new vertices and being at the sametime parallel to the corresponding edges of the icosahedron, we produce (ni þ1)2 small regular triangles (seeFig. 3b) for a total number of vertices equal to:np,ni ¼ nVert: þ nFace ð3ni 2 þ nc,ni Þ, where the coefficient 3/2takes into account the fact that some vertices are commonto several faces of the icosahedron and nc,ni represents thenumber of vertices inside the considered icosahedronface, with nc,ni ¼ ni ðni 1Þ 2. Thus, the total number ofvertices and nanoparticles on the SNB surface is given by:np,ni ¼ nV er þni nFace ðni þ 2Þ2ð1ÞDue to the geometrical structure of this model, not allbuckyball sizes are allowed. The approximated edgelength of a buckyball of np nanoparticles is l ¼2rp(ni þ1)and its normalized external radius Rcirc:2ðnp nVer Þ¼ 2 sin a 1 þþ1ð2ÞnFacerpTo obtain a more spherical buckyball, the vertices of allsmall equilateral triangles are projected by a homothetictransformation onto the circumscribed sphere, seeFig. 3(c). The new coordinates of the �ffiffiffiffiffiffiffiffiffiffiffiffiffi are x0n ,y0n ,z0n ¼ gn xn ,yn ,zn with gn ¼ r circ: x2n þ y2n þ z2n .The drawback of this projection step is that the edges ofthe projected triangles are no longer regular. For molecules, this implies that interaction forces would beslightly different (as it is). For SNBs, the implication isthat the nanoparticles are necessarily slightly polydisperse and/or cannot all be in contact [10]. It is also thereason why Eq. (2) gives only an estimation (ratherFig. 3. Geodesic dome model: decomposition of (a) icosahedron elementary faces into (b) smaller regular triangle faces that are projected onto (c) thecircumscribed spheres: passing by the centres of the nanoparticles (not to scale) or touching them.
F.R.A. Onofri et al. / Journal of Quantitative Spectroscopy & Radiative Transfer 126 (2013) 160–168precise) of the external radius of SNBs. It is only whennp ¼12 that the nanoparticles can be simultaneouslymonodisperse and in contact with their first neighbors.For larger buckyballs, a last step is necessary tominimize gaps and (possible) overlapping between thenanoparticles. To do so, keeping the position of allnanoparticles constant, their size is adjusted iterativelywith a Monte Carlo procedure. This procedure, however,has its limits, and we did not succeed to ensure that allnanoparticles were in contact [10]. This could be aproblem when simulating the scattering properties ofmetallic aggregates (e.g., surface plasmon resonance).For dielectric materials such as those of silica nanoparticles, this problem is not thought to be critical.Even though there are extremely rare experimentalindications that, from time to time, some aggregates ofsilica nanoparticles may be empty, the vast majority ofthem are densely packed (see Fig. 1.). To simplify theproblem, we developed two simple filling proceduresusing (a) fractal aggregates with the maximum compactness achievable with a diffusion-limited aggregationmodel (i.e., a fractal dimension of Df ¼2.88) [11] and (b)aggregates with a 3D hexagonal–compact (HC) lattice.With these two procedures it is possible to obtain SNBswith a volume fraction of f E50% (i.e., the packing is notmaximal). For the HC case, which is used systematically inwhat follows, the buckyballs with np ¼12, 42, 92, 162,252, 362,y finally contain np-HC ¼13, 44, 111, 249, 509,749,y nanoparticles. For comparison with LES measurements, we calculated numerically [11] the orientationaveraged projected area and equivalent spherical diameter DS E2Rcirc. of these aggregates with, for r p ¼40:5 nm, DS E235, 366, 498, 644, 783, and 922 nm,y,respectively. Fig. 4(a) shows some 3D-rendering views(with POV-Ray software) of the surfaces of synthetic163buckyballs (with r p ¼ 1). Note that all nanoparticles with aradius rp r1 are filled in dark grey to emphasize that thesmallest nanoparticles are located at the centre of, andaround, the 12 pentagons. Fig. 4(b) shows, for a buckyballof np ¼162 spheres, three synthetic TEM images [11]: (a) thebuckyball is empty or (b) it is filled with an hexagonalcompact aggregate (np-HC ¼ 249; f ¼52%) or (c) with a fractalaggregate ðnp Df ¼ 234; f ¼ 49%; Df ¼ 2:88Þ. The resemblance with experimental TEM and SEM images is rathersatisfactory. However, the geodesic dome model cannot dealwith aggregates of less than 12 spheres, while they do existin the aerosol. To solve this problem, we simply model thesesmall aggregates with the HC model [2].3.2. Sedimentation modelSEM and TEM samples were obtained via a sedimentation process. In a Stokes regime [12], the settling velocity(or terminal velocity) of a non-Brownian spherical particleis given by Stoke’s law:v S ¼ D2 gðr rf Þð3Þð18mf Þwhere r, D, g, rf, mf are the density and diameter of thesilica particle, the gravity constant, and the density andviscosity of the fluid, respectively. For a finite settlingtime tSet, the raw PSD is necessary biased by the fact thatthe sample contains always more large particles thansmall ones. For a test chamber with a height W, theproportion WS of collected aggregates is related to theaggregates settling height hSet ¼ nStSet:(WS ¼ 1, for W r hSetð4ÞWS ¼ vSWtSet , for W 4hSetThe corrected (or ‘‘true’’) size distribution of aggregatesin the aerosol can be deduced from the raw PSD: nR and bycalculating the join probability: nC ¼nRWS. As SNBs arerather porous and irregularly shaped aggregates, we usethe drag reduction model introduced by Li and Logan [13]:vS-agg: ¼ wðDS , f,Df ÞD2S gðfr rf Þð18mf Þð5Þwhere f is the particle volume fraction within the aggregate and DS the diameter of the aggregate determinedwith the geodesic dome model (see Fig. 5), w is a function[13] which depends on the previous quantities plus theaggregate estimated fractal dimension [11]. For the reasongiven earlier, we arbitrarily fixed the fractal dimension atDf ¼2.88. In fact, our simulations showed that the dominant correction term in Eq. (5) is the reduced aggregatedensity fr (i.e., the value of Df has a weak influence).4. Light extinction spectrometry and SNB opticalproperties4.1. Principle and basic equationsFig. 4. Synthetic views of (a) the surfaces of SNBs with increasingnumber of spheres (for illustration purposes, nanoparticles with rp r 1are plotted in dark gray); (b) TEM images of SNBs with (i) a shellstructure (np ¼ 162) or a core–shell structure with (ii) a hexagonal–compact core (np HC ¼ 249) and (iii) a fractal core (np HC ¼ 234).Also known as the turbidimetry technique, this wellknown optical method is referred to here as the lightextinction spectrometry (LES) because of its fundamental
164F.R.A. Onofri et al. / Journal of Quantitative Spectroscopy & Radiative Transfer 126 (2013) 160–168Fig. 5. Correlations between the different morphological properties of synthetic aggregates.analogy with light absorption spectrometry. LES is mostlyused to characterize spherical particles, although it hasalso been used to characterize crystals or aggregates witha low fractal dimension. If the detection of single andmultiple scattered photons is negligible (e.g., [14,15]), themeasured transmission is simply an exponentiallydecreasing function of the probing distance L and theparticle system turbidity t. The turbidity is the product ofthe particle number concentration N and the meanextinction cross section of the particles illuminated bythe probing beam. The mean extinction cross section is anintegral quantity depending on the properties of eachparticle and its statistical weight in the particulate medium.Thus, the linearized and discretized form of the basic LESequation reads as [14]:ln½Tðli Þ ¼ NLmXC i,j njð6Þj¼1where li, with i¼1, 2, y, Nl, and nj, with j ¼1, 2, y, MD,stand, respectively, for selected wavelengths in the spectrum and the normalized number fraction of j-typeparticles. Later, the symbol Tm is used to represent thefirst member of Eq. (6) (i.e., the measured quantity).For the sizing of spherical particles, nj is simply the probability density function associated with the particle with adiameter Dj, and Ci,j its extinction cross section for thewavelength li. In the present study, nj refers to theprobability density function of SNBs with the same2D-projected area and equivalent spherical diameter DS,j.In other words, the vector n simply represents the normalized PSD in numbers of the SNBs. This choice was guidedby the idea of allowing a direct comparison between LESand SEM/TEM analyses. Since the morphology of the SNBis assumed and the refractive index spectrum of silicananoparticles is known, the correlations between DS,j andthe other properties of the buckyballs are simply derivedby analyzing the TEM images of synthetic buckyballs.As the number concentration of SNBs in the aerosol is alsounknown, the PSD is found by normalizing the twomembers of Eq. (6). The problem therefore is to solvethe following linear algebraic equation:CnTmþ¼0JCnJ JTm Jð7ÞOnce n is determined, the particle number concentration can be deduced directly from N ¼ JTm J ðLJCnJÞ.4.2. Inversion proceduresUnfortunately, because of the shape of C and its highcondition number, we are faced here with a discrete illposed problem [16–18]. We developed three methods toregularize and solve Eq. (7) in the least squares sense. Thefirst two inversion methods impose moderated constraints on PSD behavior: All of its elements are positiveand we only select solutions with continuity or smoothness properties. The first method is based on the Tikhonovregularization method [16] coupled with a nonnegativity-constrained least squares algorithm:no2Min JCn Tm J2 þ l JLðn n0 ÞJ2ð8Þn40Similarly, the second method uses the Phillips–Twomey regularization method [17]:noMin JðCT C þ gHÞn CT Tm J2ð9Þn40where l, g are regularization parameters whose magnitudes are estimated with the L-curve method [18], L, Hare continuity and smoothing matrices (identity matrixand its second derivative) [16–18] and n0 an initial guessfor the PSD (we set n0 ¼0). We obtained very satisfactoryresults with these methods, when characterizing narrowsize distributions of tungsten or silicon nanoaggregates
F.R.A. Onofri et al. / Journal of Quantitative Spectroscopy & Radiative Transfer 126 (2013) 160–168165[8,19], and even of micrometric bubbles [20]. But the factis that we did not succeed to obtain satisfactory results forSNBs (especially with the Tikhonov method, see below).For this r
b Institut PASCAL, UMR 6602, CNRS/Universite Blaise Pascal, Polytech’Clermont-Ferrand, 63174 Aubiere, France c Chair of Electronic and Photonic Metro