Transcription
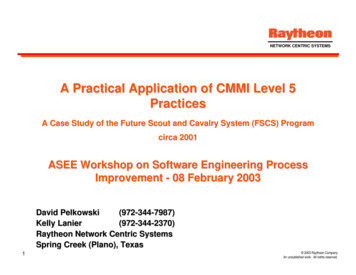
NETWORK CENTRIC SYSTEMSA Practical Application of CMMI Level 5PracticesA Case Study of the Future Scout and Cavalry System (FSCS) Programcirca 2001ASEE Workshop on Software Engineering ProcessImprovement - 08 February 2003David Pelkowski(972-344-7987)Kelly Lanier(972-344-2370)Raytheon Network Centric SystemsSpring Creek (Plano), Texas1 2003 Raytheon CompanyAn unpublished work. All rights reserved.
Topics2NETWORK CENTRIC SYSTEMS FSCS Program and Problem Overview Raytheon’s Foundation for Process Improvement Achieving Continuous Improvement on FSCS 2003 Raytheon CompanyAn unpublished work. All rights reserved.
NETWORK CENTRIC SYSTEMSAct OneFSCS Program and Problem Overview3 2003 Raytheon CompanyAn unpublished work. All rights reserved.
FSCS Program Overview Future Scout and Cavalry System (FSCS)— 42month ATD program (January ’99 - July ’02)— US/ UK joint program Advanced Long RangeReconnaissance Mission C130 Transportable FSCS Represents State of theArt in Architectures forCombat Vehicles— Systemsand software architecture— Computing4NETWORK CENTRIC SYSTEMSresources and electronics 2003 Raytheon CompanyAn unpublished work. All rights reserved.
FSCS Program Overview - SIL ntrollerCrew StationTest essingprocessing5INSControllerNETWORK CENTRIC ollerVehicleMountedSensorSuiteEmulator 2003 Raytheon CompanyAn unpublished work. All rights reserved.
FSCS Program Overview - System gerSystemMode rnalinterfacesinterfaces rollerNETWORK CENTRIC SControllerVLOSVStateVFLIRControllerCITVVFLIR 2003 Raytheon CompanyAn unpublished work. All rights reserved.
FSCS Program Overview – The Problem NETWORK CENTRIC SYSTEMSDuring System I&T, the Test team complainedabout defects that had escaped from SIL I&T— Defectswere in message sequences and software componentinter-relationships (i.e. behaviors)— Defects were not in message formats (i.e. ICDs)Defect Containment thresholds were exceeded forSystem I&T— Thresholdswere defined in the Quantitative Project Management(QPM) Plan— Discoveredduring the September 2001 Metrics Analysis danalysisanalysis7 2003 Raytheon CompanyAn unpublished work. All rights reserved.
FSCS Program Overview – The 91081010039Stage 8434810577%23%Detected In Stage:Total Escaped:SIT3422100003621GoalDetected In Stage:Total Escaped:Ex SystemI&TI&T8NETWORK CENTRIC SYSTEMSATMaint00000Totals1930150117498800453 80% 20%ed!QPMThresholds 2003 Raytheon CompanyAn unpublished work. All rights reserved.
NETWORK CENTRIC SYSTEMSAct TwoRaytheon’s Foundation for ProcessImprovement9 2003 Raytheon CompanyAn unpublished work. All rights reserved.
Process Improvement RoadmapNETWORK CENTRIC izeMeasure Improvementsand Rebaseline (CMMI 5)SigmaCommitSixAchieveDeploy Improvements (CMMI 5)Pilot Improvements (CMMI 5)Select And PrioritizeImprovements (CMMI 5)Causal Analysis andResolution (CMMI 5)Establish ProcessCapability Baseline (CMM 4)Set Objective Performanceand Quality Goals (CMM 4)10 2003 Raytheon CompanyAn unpublished work. All rights reserved.
CMM Level 4 FoundationProcess Improvement RoadmapNETWORK CENTRIC SYSTEMSNETWORK CENTRIC SYSTEMSVisualizeAchieveMeasure Improvementsand Rebaseline (CMMI mitDeploy Improvements (CMMI 5)Pilot Improvements (CMMI 5)Select And PrioritizeImprovements (CMMI 5)Causal Analysis andResolution (CMMI 5)Establish ProcessCapability Baseline (CMM 4)Set Objective Perform anceand Quality Goals (CMM 4) 2002 Raytheon CompanyAn unpublis hed work. All rights reserved.10 Quantitative Process Management Key Process Area— “Thepurpose of Quantitative Process Management is to control theprocess performance of the software project quantitatively.” - CMM V 1.1— FSCSused a Quantitative Process Management (QPM) Plan to measureand monitor the software process— TheDefect Containment Metric was Analyzed and Compared to theOrganization’s Expected Range Of Values based on the QPM Plan11 2003 Raytheon CompanyAn unpublished work. All rights reserved.
Applying CMMI Level 5 BehaviorsProcess Improvement RoadmapNETWORK CENTRIC SYSTEMSVisualizeAchieveMeasure Improvementsand Rebaseline (CMMI mit NETWORK CENTRIC SYSTEMSOrganizational Innovation andDeploymentDeploy Improvements (CMMI 5)— “ThePilot Improvements (CMMI 5)Select And PrioritizeImprovements (CMMI 5)Causal Analysis andResolution (CMMI 5)Establish ProcessCapability Baseline (CMM 4)Set Objective Perform anceand Quality Goals (CMM 4) 2002 Raytheon CompanyAn unpublis hed work. All rights reserved.10purpose of Organizational Innovation andDeployment is to select and deploy incrementaland innovative improvements that measurablyimprove the organization’s processes andtechnologies” - CMMI SE/SW v 1.1— FSCSpiloted selected improvements onsubsequent builds and deployed pilotedimprovements on subsequent builds of otherSoftware Configuration Items (SCIs) Causal Analysis and Resolution— “Thepurpose of Causal Analysis and Resolution is to identifycauses of defects and other problems and take action to preventthem from occurring in the future” - CMMI SE/SW v 1.1— FSCSperformed causal analysis as part of monthly metrics analysisactivities and identified resolutions as improvement action plans12 2003 Raytheon CompanyAn unpublished work. All rights reserved.
Raytheon Six Sigma FoundationProcess Improvement RoadmapNETWORK CENTRIC SYSTEMSVisualizeVisualizeAchieveMeasure Improvementsand Rebaseline (CMMI mitNETWORK CENTRIC SYSTEMSDeploy Improvements (CMMI 5)Pilot Improvements (CMMI 5)Select And PrioritizeImprovements (CMMI 5)Causal Analysis andResolution (CMMI 5)AchieveCommitImprovePrioritizeEstablish ProcessCapability Baseline (CMM 4)Set Objective Perform anceand Quality Goals (CMM 4)10 2002 Raytheon CompanyAn unpublis hed work. All rights mentImprovement13Characterize 2003 Raytheon CompanyAn unpublished work. All rights reserved.
R6σ Maps to CMMI Level 5MeasureImprovements& Re-baselineNETWORK CENTRIC SYSTEMSSet ObjectivePerformance &Quality GoalsCPIProcess Capability for CPILSL 0.975, Nominal 1.0, USL 1.1515Cp 0.09Cpk -0.0812frequencyDeployImprovementsCpk (upper) 9Cpk (lower) 6Cr 10.96Cpm 0.093K -1.14000.25 0.5 0.751CPIPilotImprovements141.25 1.5 1.752EstablishProcessCapabilityBaselineSelect &PrioritizeImprovements 2003 Raytheon CompanyAn unpublished work. All rights reserved.
NETWORK CENTRIC SYSTEMSAct ThreeAchieving Continuous Improvement onFSCS15 2003 Raytheon CompanyAn unpublished work. All rights reserved.
Quantitative Process Management The FSCS Metrics Analysis process included detailedanalysis of the defect metrics to determine root causeProcessHardwareRequirements instabilityDesign instabilityDrive to improve SPIActual hardware not availablefor testingSIL emphasis on I&Twith emulatorsSIL testing experienceUnit testingknowledge/experiencePeople16NETWORK CENTRIC SYSTEMSDefects escapingimplementationand softwareintegration stagesEmulator design not basedon actual ngintointoSystemSystemI&TI&T 2003 Raytheon CompanyAn unpublished work. All rights reserved.
Causal Analysis NETWORK CENTRIC SYSTEMSEmulator design was based on ADDs, designartifacts, and TEMs instead of actual hardware— Dueto intentionally late arrival of re-used HW— Inherentflaw since checks and balances that enable requirementverification was missing During SIL I&T too much time was spent debuggingthe emulators instead of debugging deliverablecode— Any time at all was too much timeDuring System I&T, the regression test turned intoa comprehensive re-test— Intentto prove the software had not changed since SIL I&Texpanded into a re-verification of requirements because theactual HW was different than the emulators17 2003 Raytheon CompanyAn unpublished work. All rights reserved.
Causal Analysis and Resolution De-emphasize integration with emulators— Whenever NETWORK CENTRIC SYSTEMSpossible, use real software and hardwareRe-engineered the process for Unit Test in theImplementation stage and .— Preparedand presented a Unit Test JITT Testing in the SIL I&T stage— Integrate real software and hardware, hold off on TestEmphasize early testing of final system configuration— Assigna SIL I&T lead to coordinate activities— Focus on external interfaces Includes most technical unknowns and competition for scarce hardwareresources— Start18the System I&T stage as soon as possible (but no sooner) 2003 Raytheon CompanyAn unpublished work. All rights reserved.
AchievementNETWORK CENTRIC SYSTEMSQuantitative Process Management (CMM L4) Causal Analysis and Resolution (CMMI L5) Organizational Innovation and Deployment (CMMI L5) Raytheon Six Sigma Process Measurable Continuous Process Improvement19 2003 Raytheon CompanyAn unpublished work. All rights reserved.
Comparison of B1 and B2/3/4 Metrics NETWORK CENTRIC SYSTEMSProductivityB1 SIL I&T Productivity 2.1 LOC/HrB2/3/4 SIL I&T Productivity 3.4 LOC/Hr— ctsaspectsofofdevelopmentdevelopment CPI and SPIJUL 2001 Cum CPI / SPI .91 / .93JAN 2002 Cum CPI / SPI .96 / .99— 5%/ 6% hethecumulativecumulativeCPICPIandandSPISPI20 2003 Raytheon CompanyAn unpublished work. All rights reserved.
Comparison of B1 and B2/3/4 Metrics26,361 ELOC51%NETWORK CENTRIC SYSTEMS39,798 ELOCComparison of B1 and B2/3/4 SIL I&T Labor IL I&T Labor 1 2003 Raytheon CompanyAn unpublished work. All rights reserved.
Comparison of B1 and B2/3/4 MetricsNETWORK CENTRIC SYSTEMSTracer Build 1 Defect sRA191081010039SD2010010022Detected In Stage:Total Escaped:ODStage SIT3422100003621GoalDetected In Stage:Total Escaped:AT000Maint00Totals1930150117498800453 80% 20%Tracer Build 2 Defect 810481%19%Detected In Stage:Total Escaped:22Stage OriginatedIMSILSDIn Range!SIT53150000815GoalDetected In Stage:Total Escaped:ATMaint00000Totals12819720473480054226,361 Implementation 132%132%improvementimprovement19,869 ELOC 80% 20% 2003 Raytheon CompanyAn unpublished work. All rights reserved.
Comparison of B1 and B2/3/4 MetricsNETWORK CENTRIC SYSTEMSTracer Build 1 Defect sRA191081010039Stage 8434810577%23%Detected In Stage:Total Escaped:SIT3422100003621GoalDetected In Stage:Total Escaped:AT000Maint00Totals1930150117498800453 80% 20%Tracer Build 2 Defect 810481%19%Detected In Stage:Total Escaped:23Stage OriginatedIMSILSDIn Range!SIT53150000815GoalDetected In Stage:Total Escaped:ATMaint00000Totals12819720473480054226,361 stemI&TI&T 39%39%improvementimprovement19,869 ELOC 80% 20% 2003 Raytheon CompanyAn unpublished work. All rights reserved.
Results NETWORK CENTRIC SYSTEMSDuring SIL I&T, too much time was spent debuggingthe emulators instead of debugging deliverable code— Mitigated:SIL I&T productivity improved in B2/3/4— Mitigated:CPI / SPI improved in B2/3/4During System I&T, the regression test turned into acomprehensive re-test— Mitigated:Fewer labor hours were spent integrating more code inB2/3/4 SIL I&T During System I&T, ESIL team complained abouthigh number of defects that had escaped from SILI&T— Mitigated:In stage defect detection increased 132%(Implementation stage), out of stage defect detection decreased39%24 2003 Raytheon CompanyAn unpublished work. All rights reserved.
CMMI Level 5 PracticesMeasureImprovements& Re-baselineNETWORK CENTRIC SYSTEMSSet ObjectivePerformance &Quality GoalsResultsCPIQPM PlanStabilize process& EstablishProcess capabilityBaselineProcess Capability for CPILSL 0.975, Nominal 1.0, USL 1.15Cp 0.09Metrics AnalysisCpk -0.0812frequencyDeployImprovements15Cpk (upper) 9Cpk (lower) 6Cr 10.96Cpm 0.093K -1.140EEOS B2VMSS, B3/4InfoDev B2PilotImprovements2500.25 0.5 0.7511.25 1.5 1.752CPISelect &PrioritizeImprovementsNew Unit Test JITT,new SIL I&T JITT 2003 Raytheon CompanyAn unpublished work. All rights reserved.
Conclusions Metrics and Analysis are essential to continuousprocess improvement— Metrics NETWORK CENTRIC SYSTEMSare key to triggering and measuring process changesDevelop a strong QPM Plan including metricscollection from the beginning— Itis unknown at the beginning which metrics will eventuallybecome the most valuable— You 26can never go back and collect what you missedQPM and metrics are valuable for convincingcustomers and management to support processimprovements 2003 Raytheon CompanyAn unpublished work. All rights reserved.
NETWORK CENTRIC SYSTEMSBackup27 2003 Raytheon CompanyAn unpublished work. All rights reserved.
Normalized LOC Calculations NETWORK CENTRIC SYSTEMSIn Stage Defects204117 -(26,361-19,869)126,361 132%117 Out of Stage Defects2657 -(26,361-19,869)126,361 39%5728 2003 Raytheon CompanyAn unpublished work. All rights reserved.
Comparison of B1 and B2/3/4 Metrics-25%26,361 ELOCNETWORK CENTRIC SYSTEMS19,869 ELOCComparison of B1 and B2 SIL I&T Labor IL I&T Labor uding(includingregressionregressiontest)test)29 2003 Raytheon CompanyAn unpublished work. All rights reserved.
CMMI Level 5 Behavior Context DiagramKnoworganizationalcompetencies,needs, & goals1Move processcapabilitytowards org.goals2Determineprogram rootcauses ation rootcauses fordefects30NETWORK CENTRIC SYSTEMSIdentify edimprovements7Monitor8improvement oforganizationalcapability 2003 Raytheon CompanyAn unpublished work. All rights reserved.
A Practical Application of CMMI Level 5 Practices A Case Study of the Future Scout and Cavalry System (FSCS) Program circa 2001 ASEE Workshop on Software Engineering Process Improvement - 08 Fe